How to round values
This tutorial will show you how to round values.
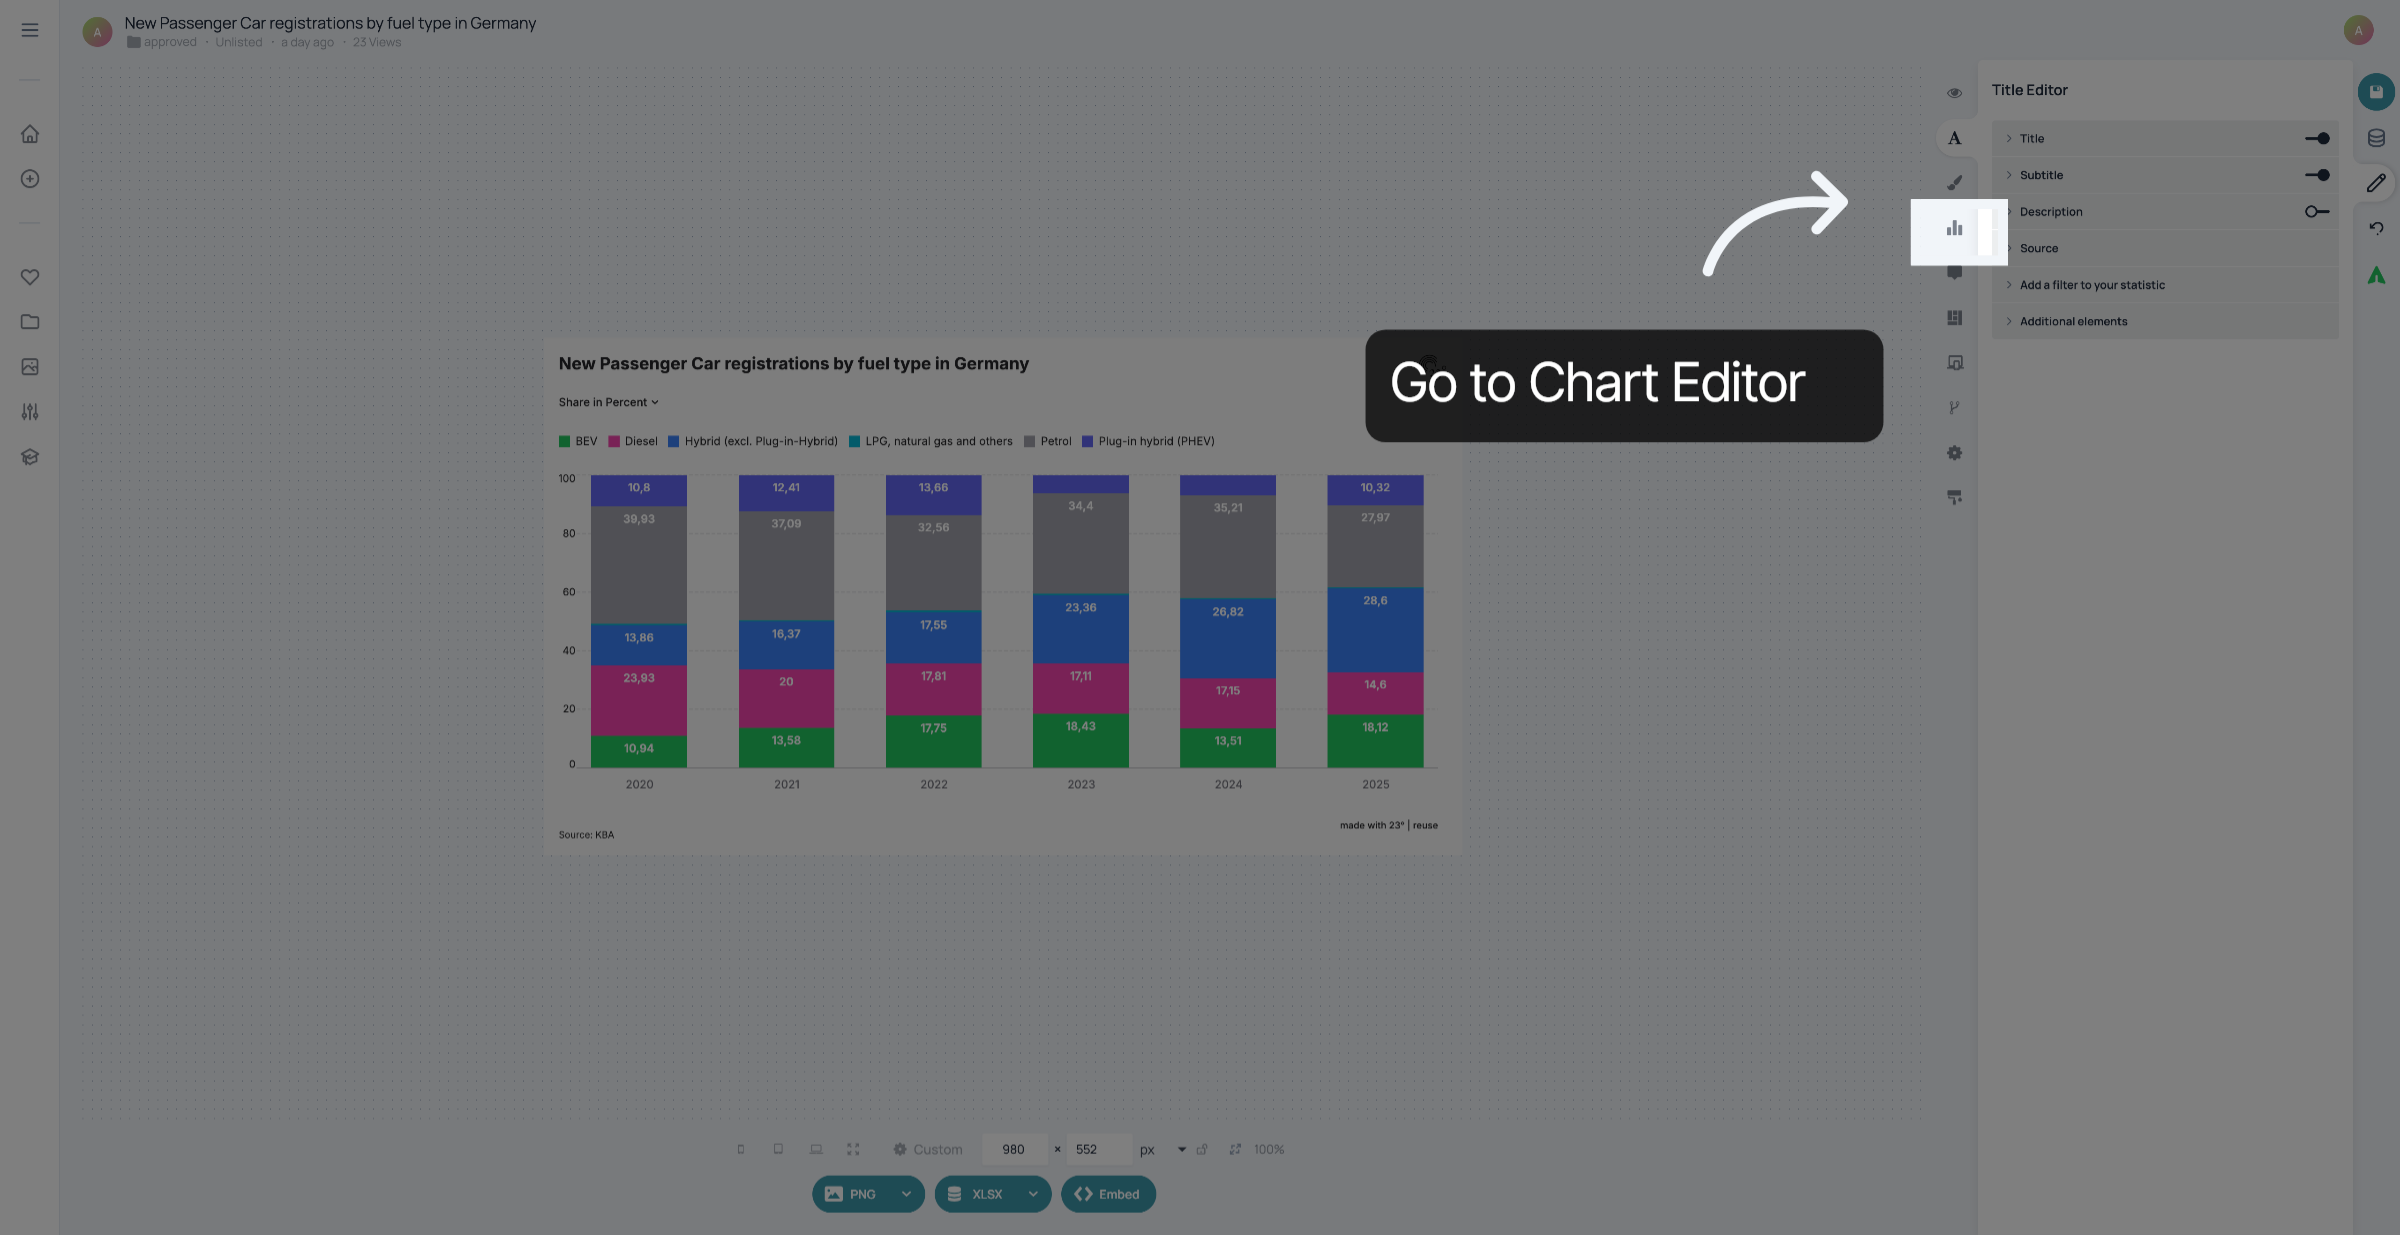
1. Go to Chart Editor
Click here to go to the chart editor.
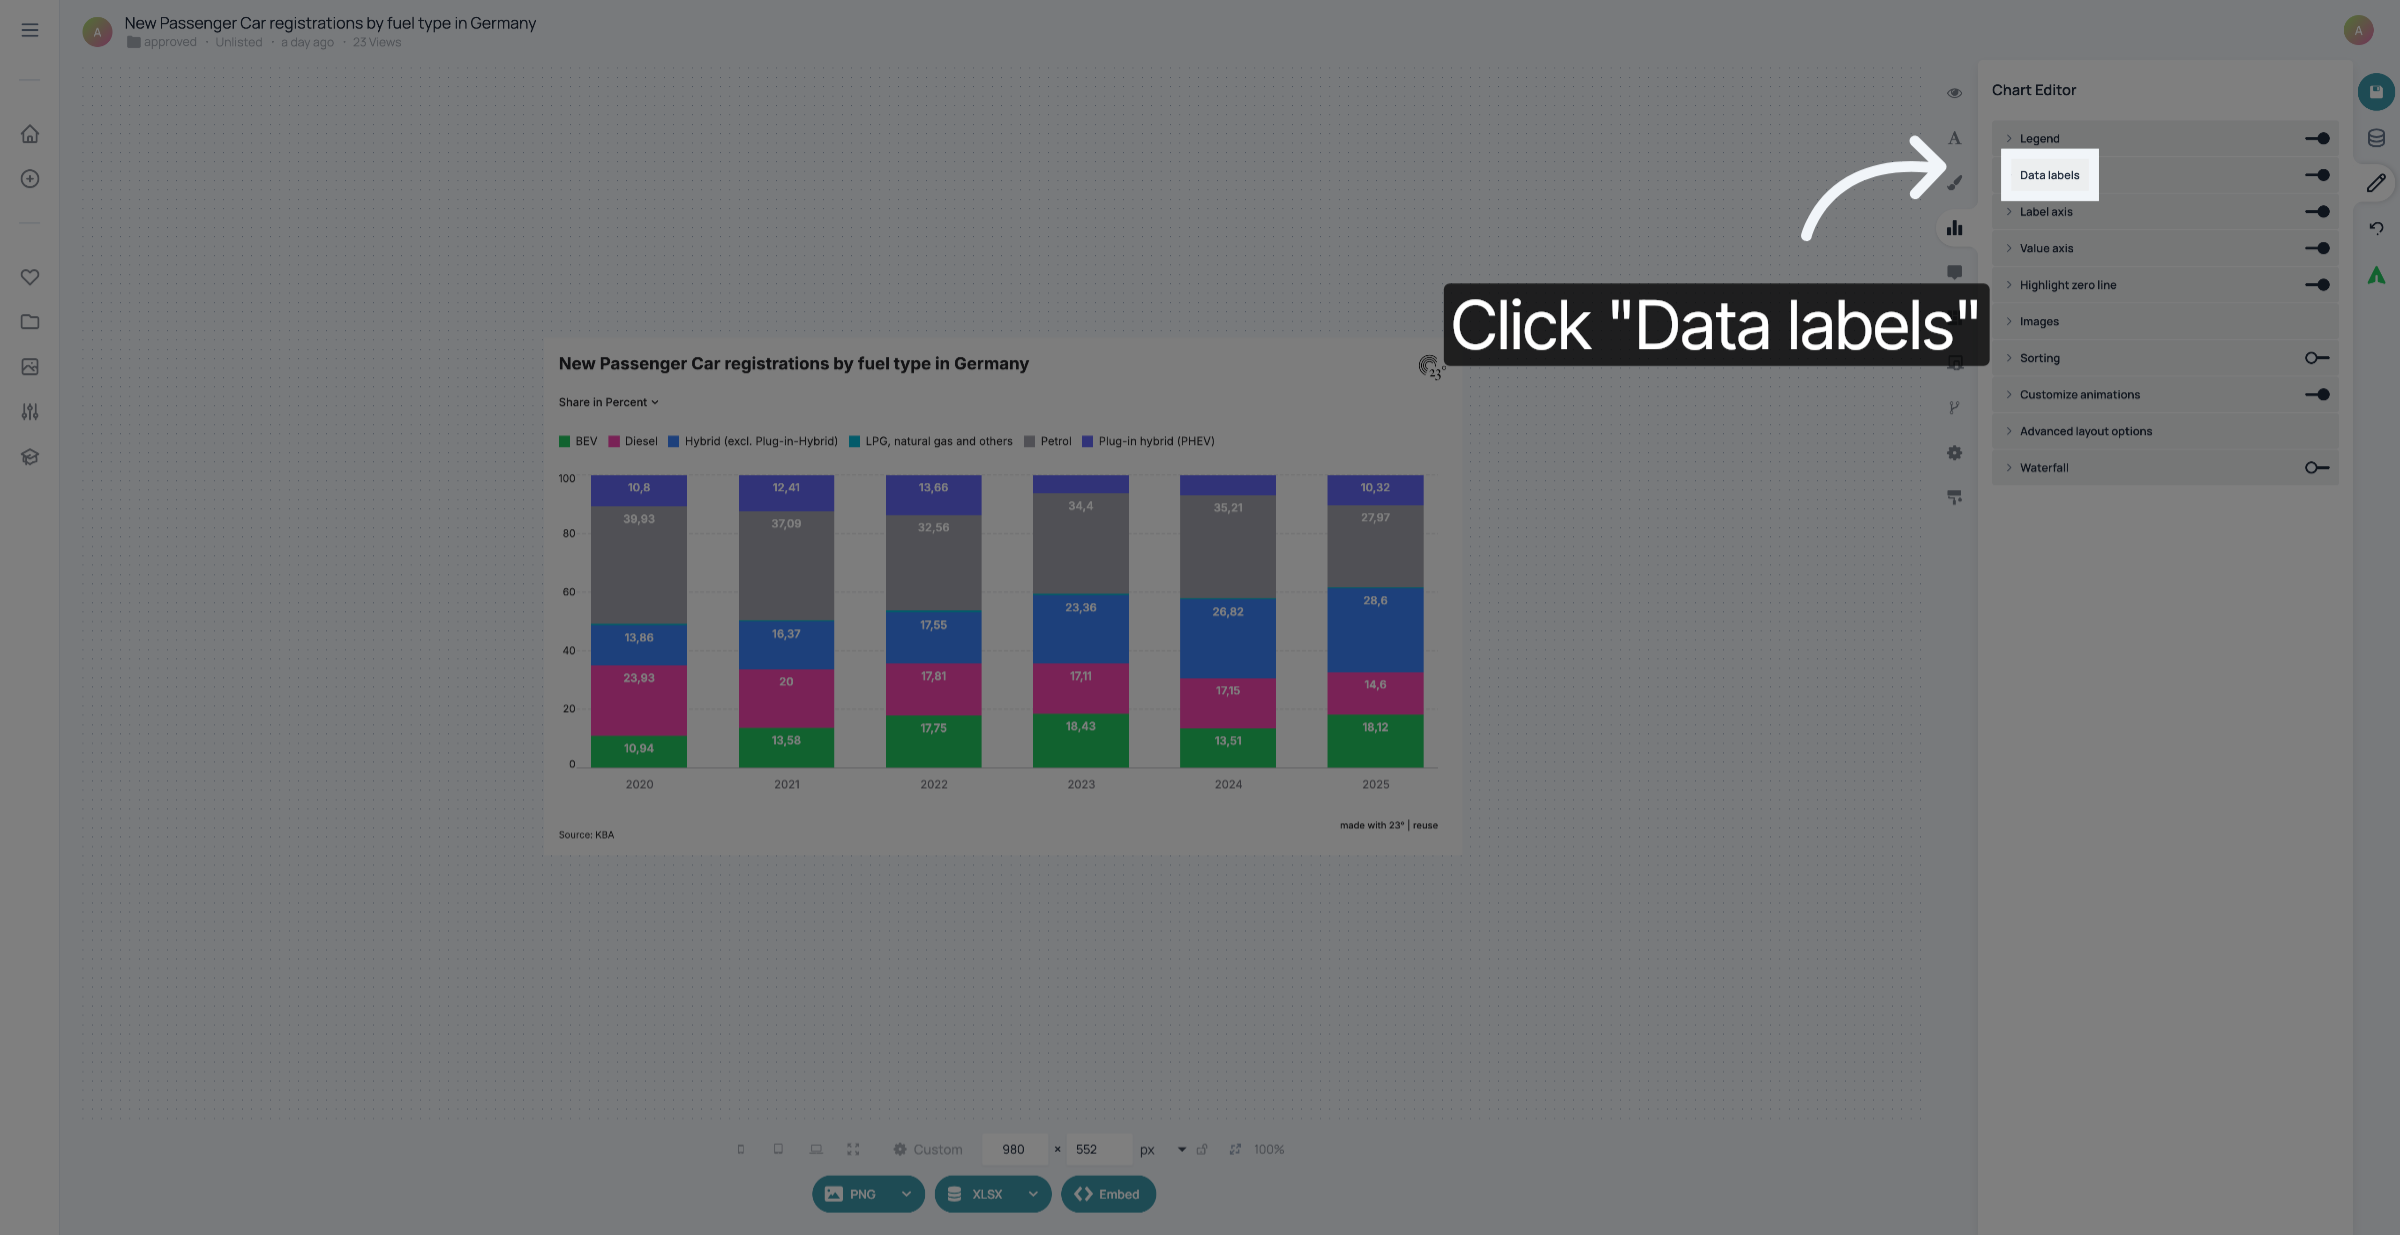
2. Open Data labels
Click "Data labels
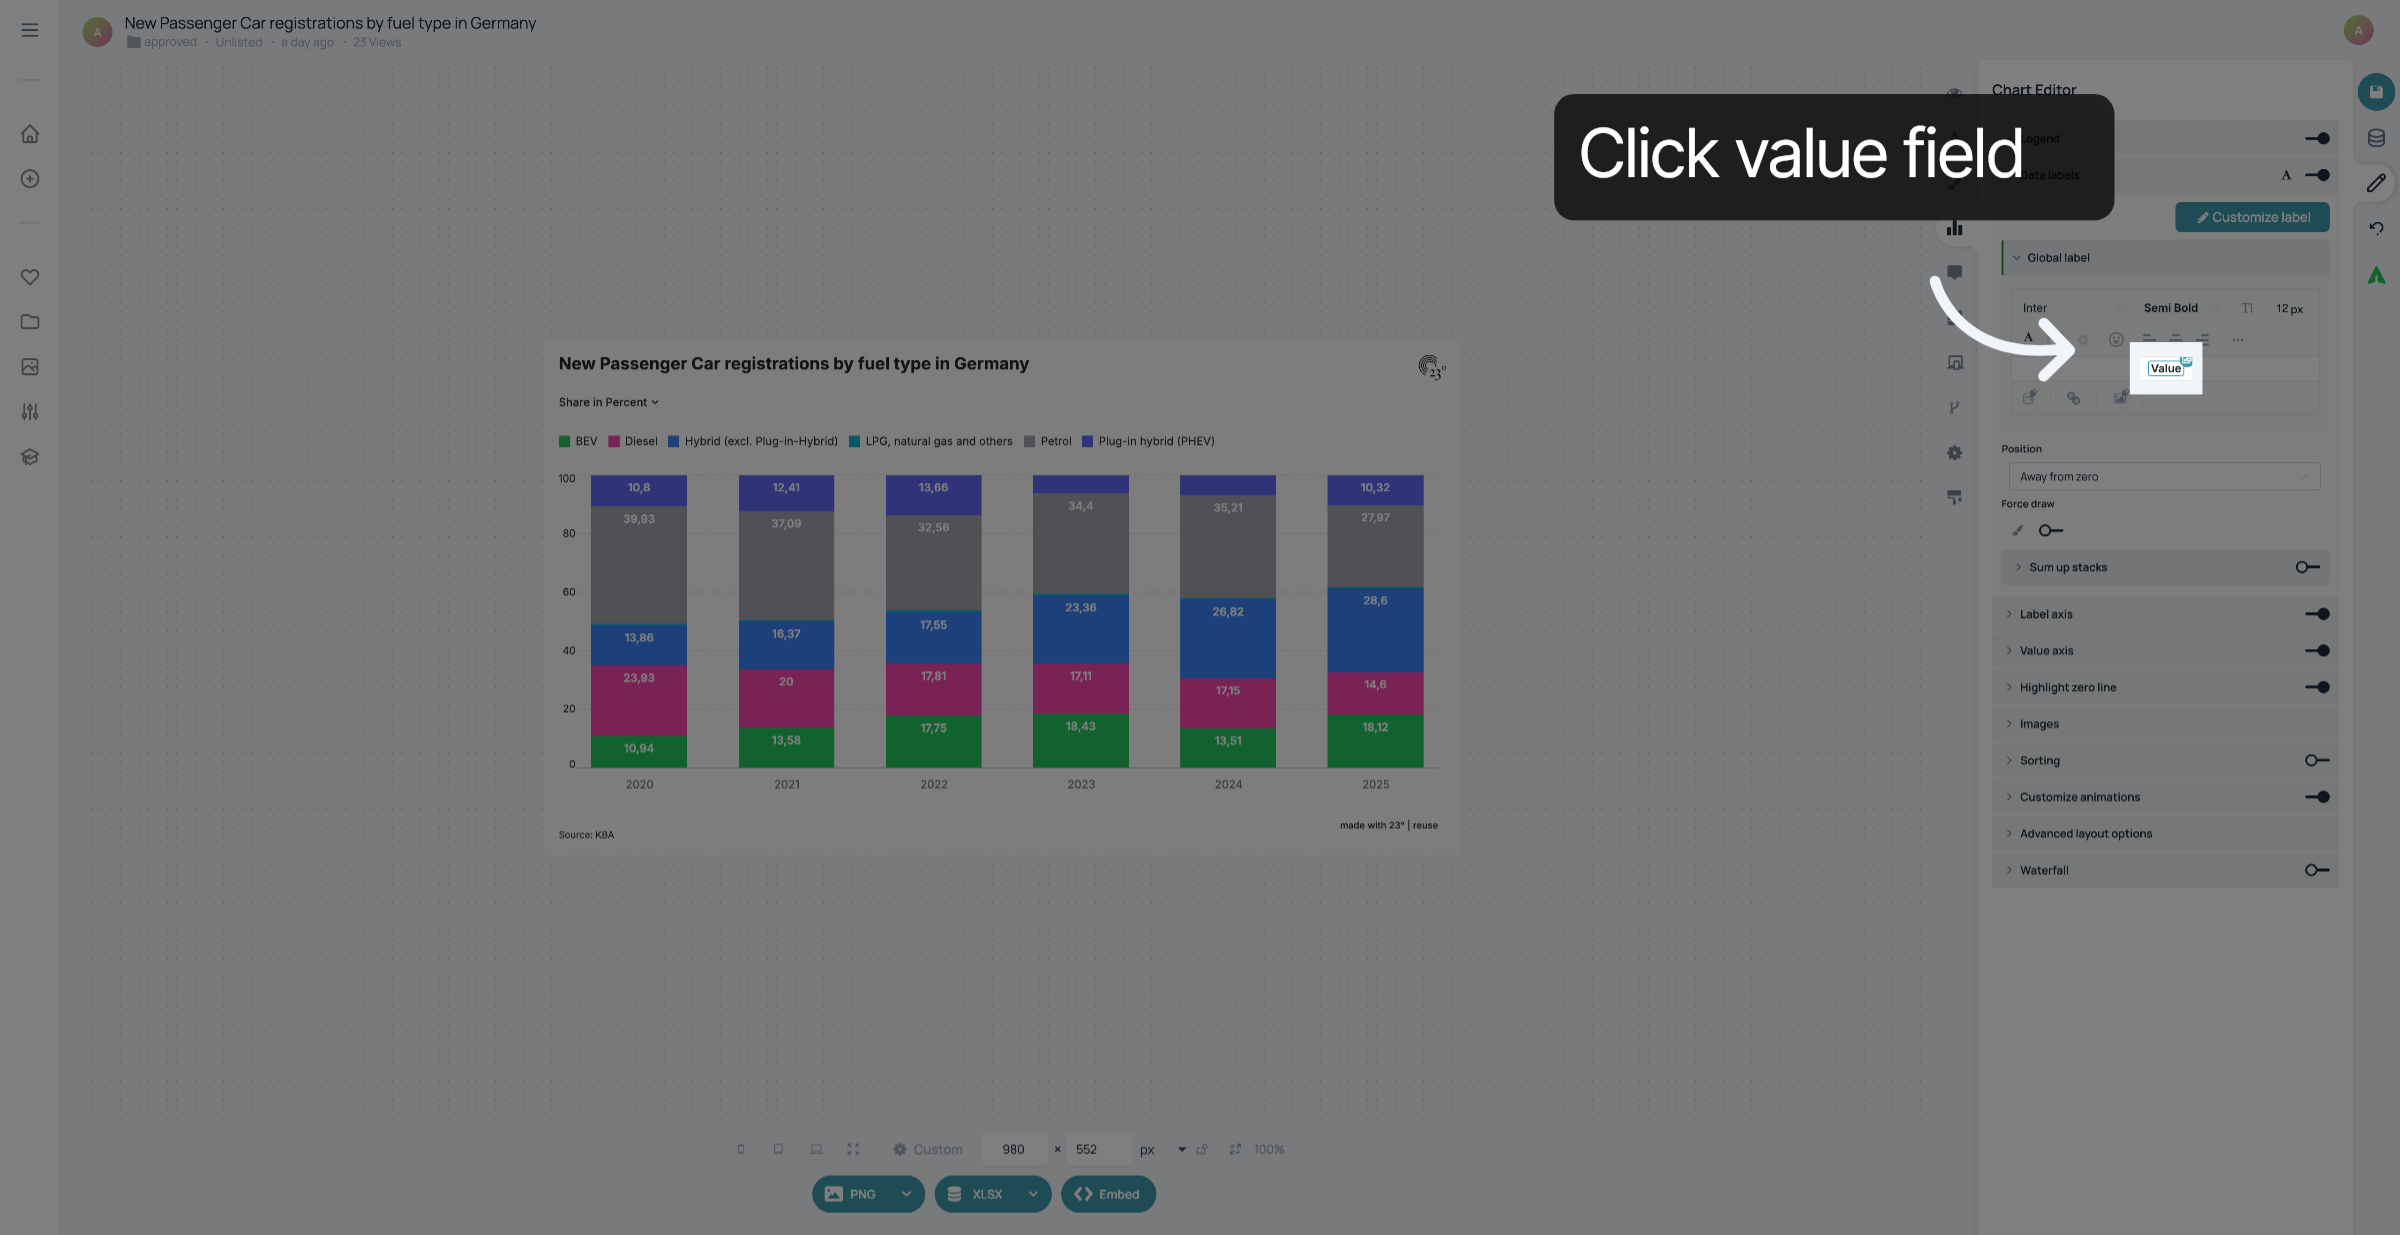
3. Select Value Field
Select the value field.
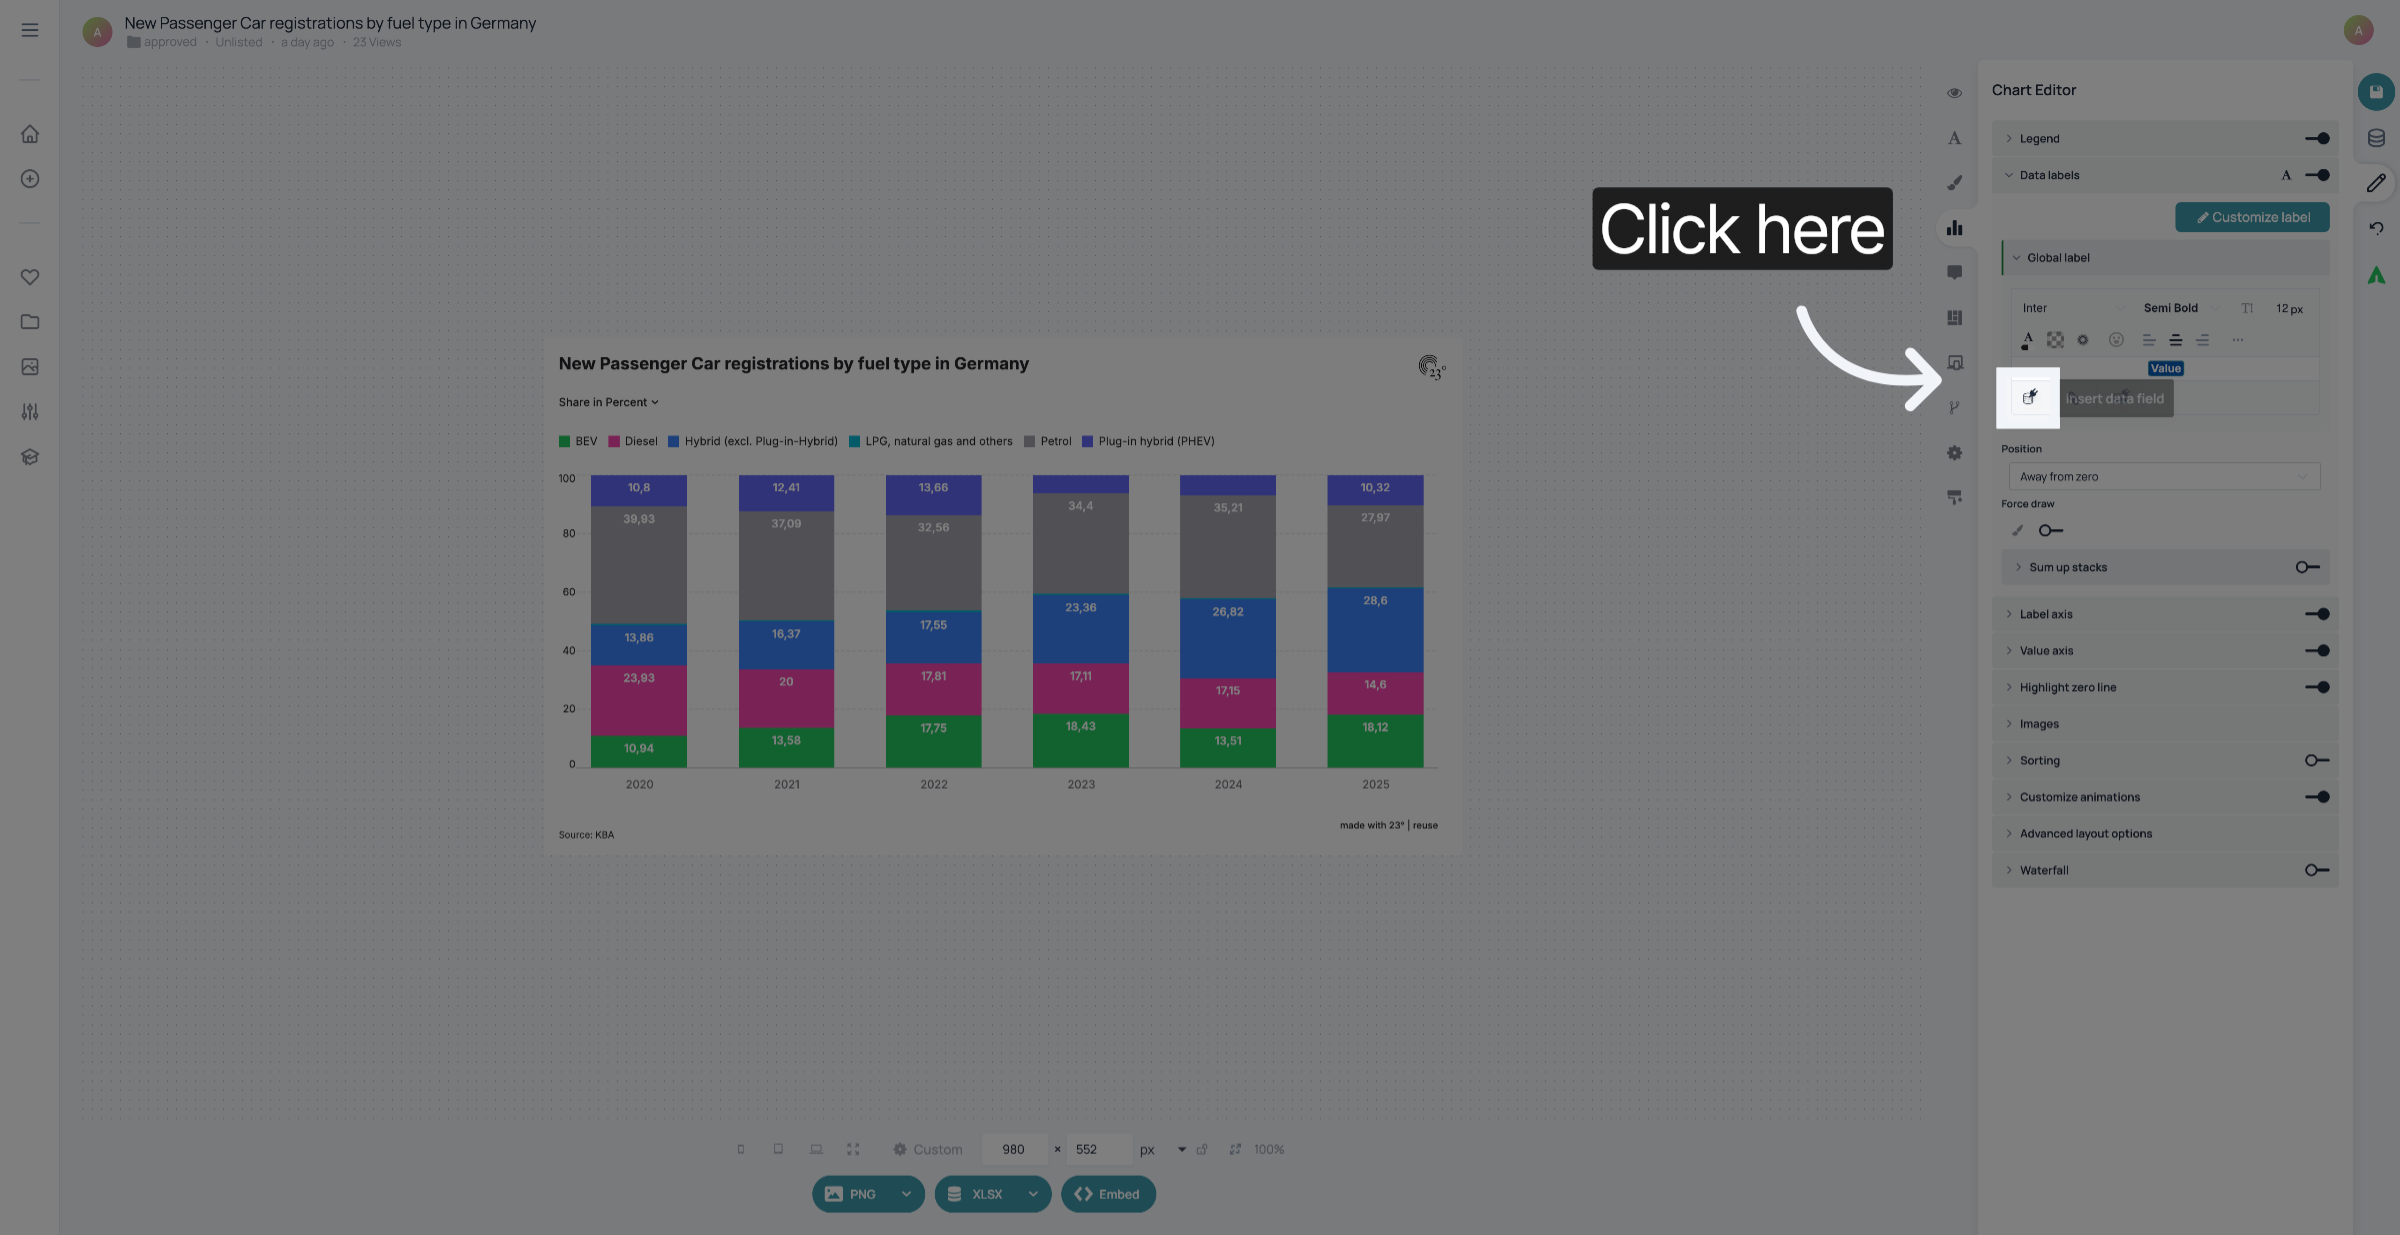
4. Customize value formatting
Click here to customize the formatting of the value.
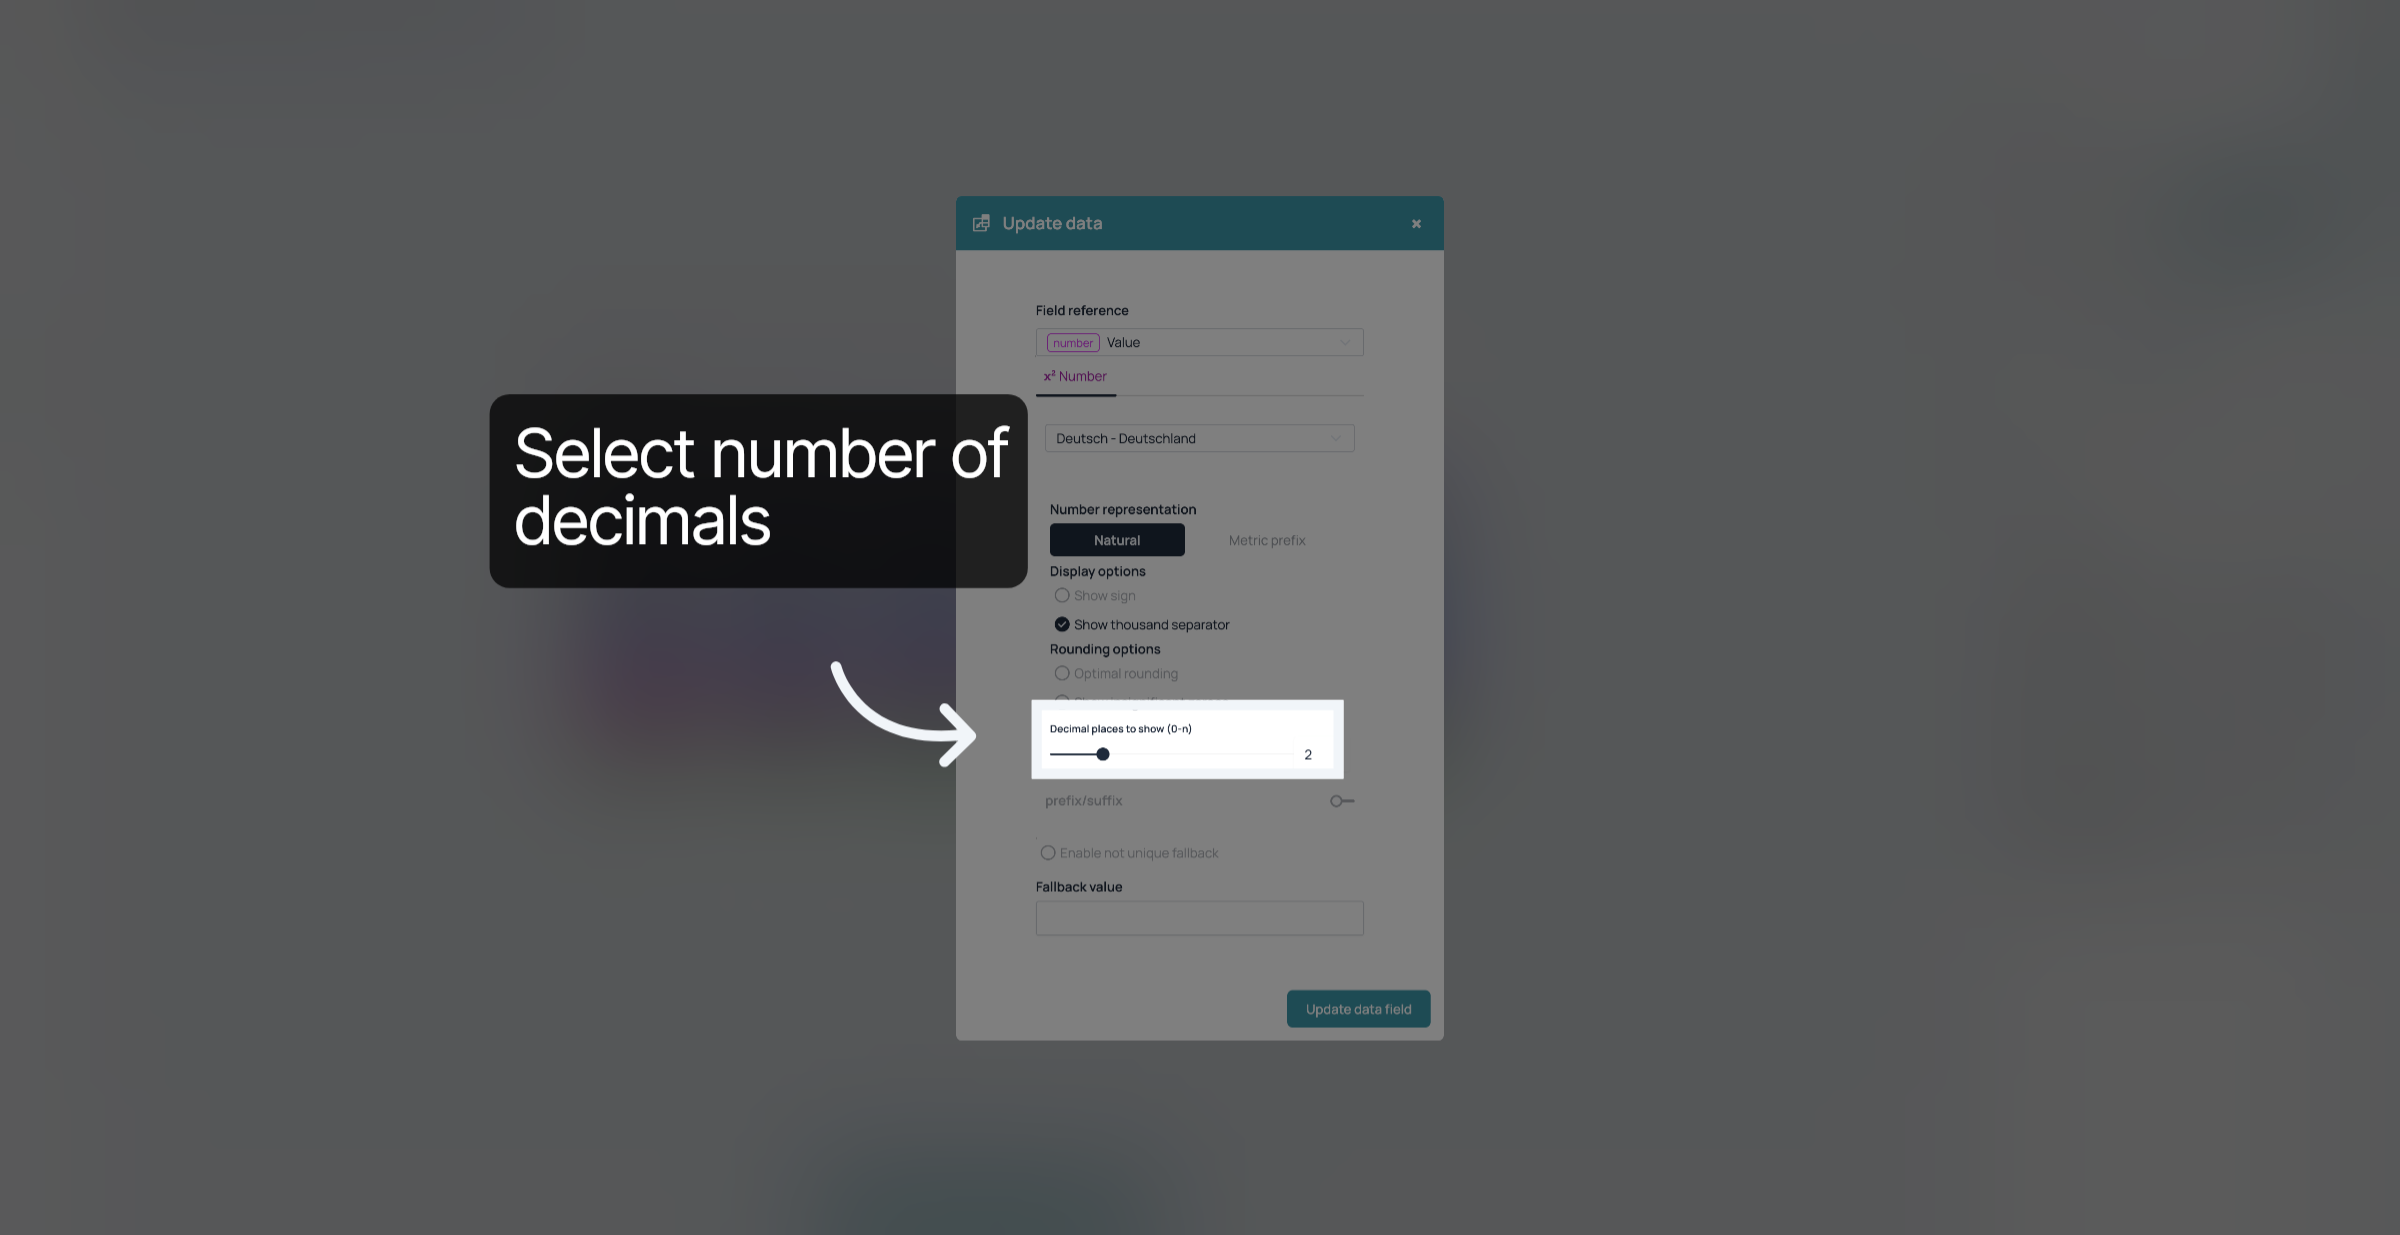
5. Select decimals
Drag the slider to select the number of decimals you want to show, or type it in the field at the right.
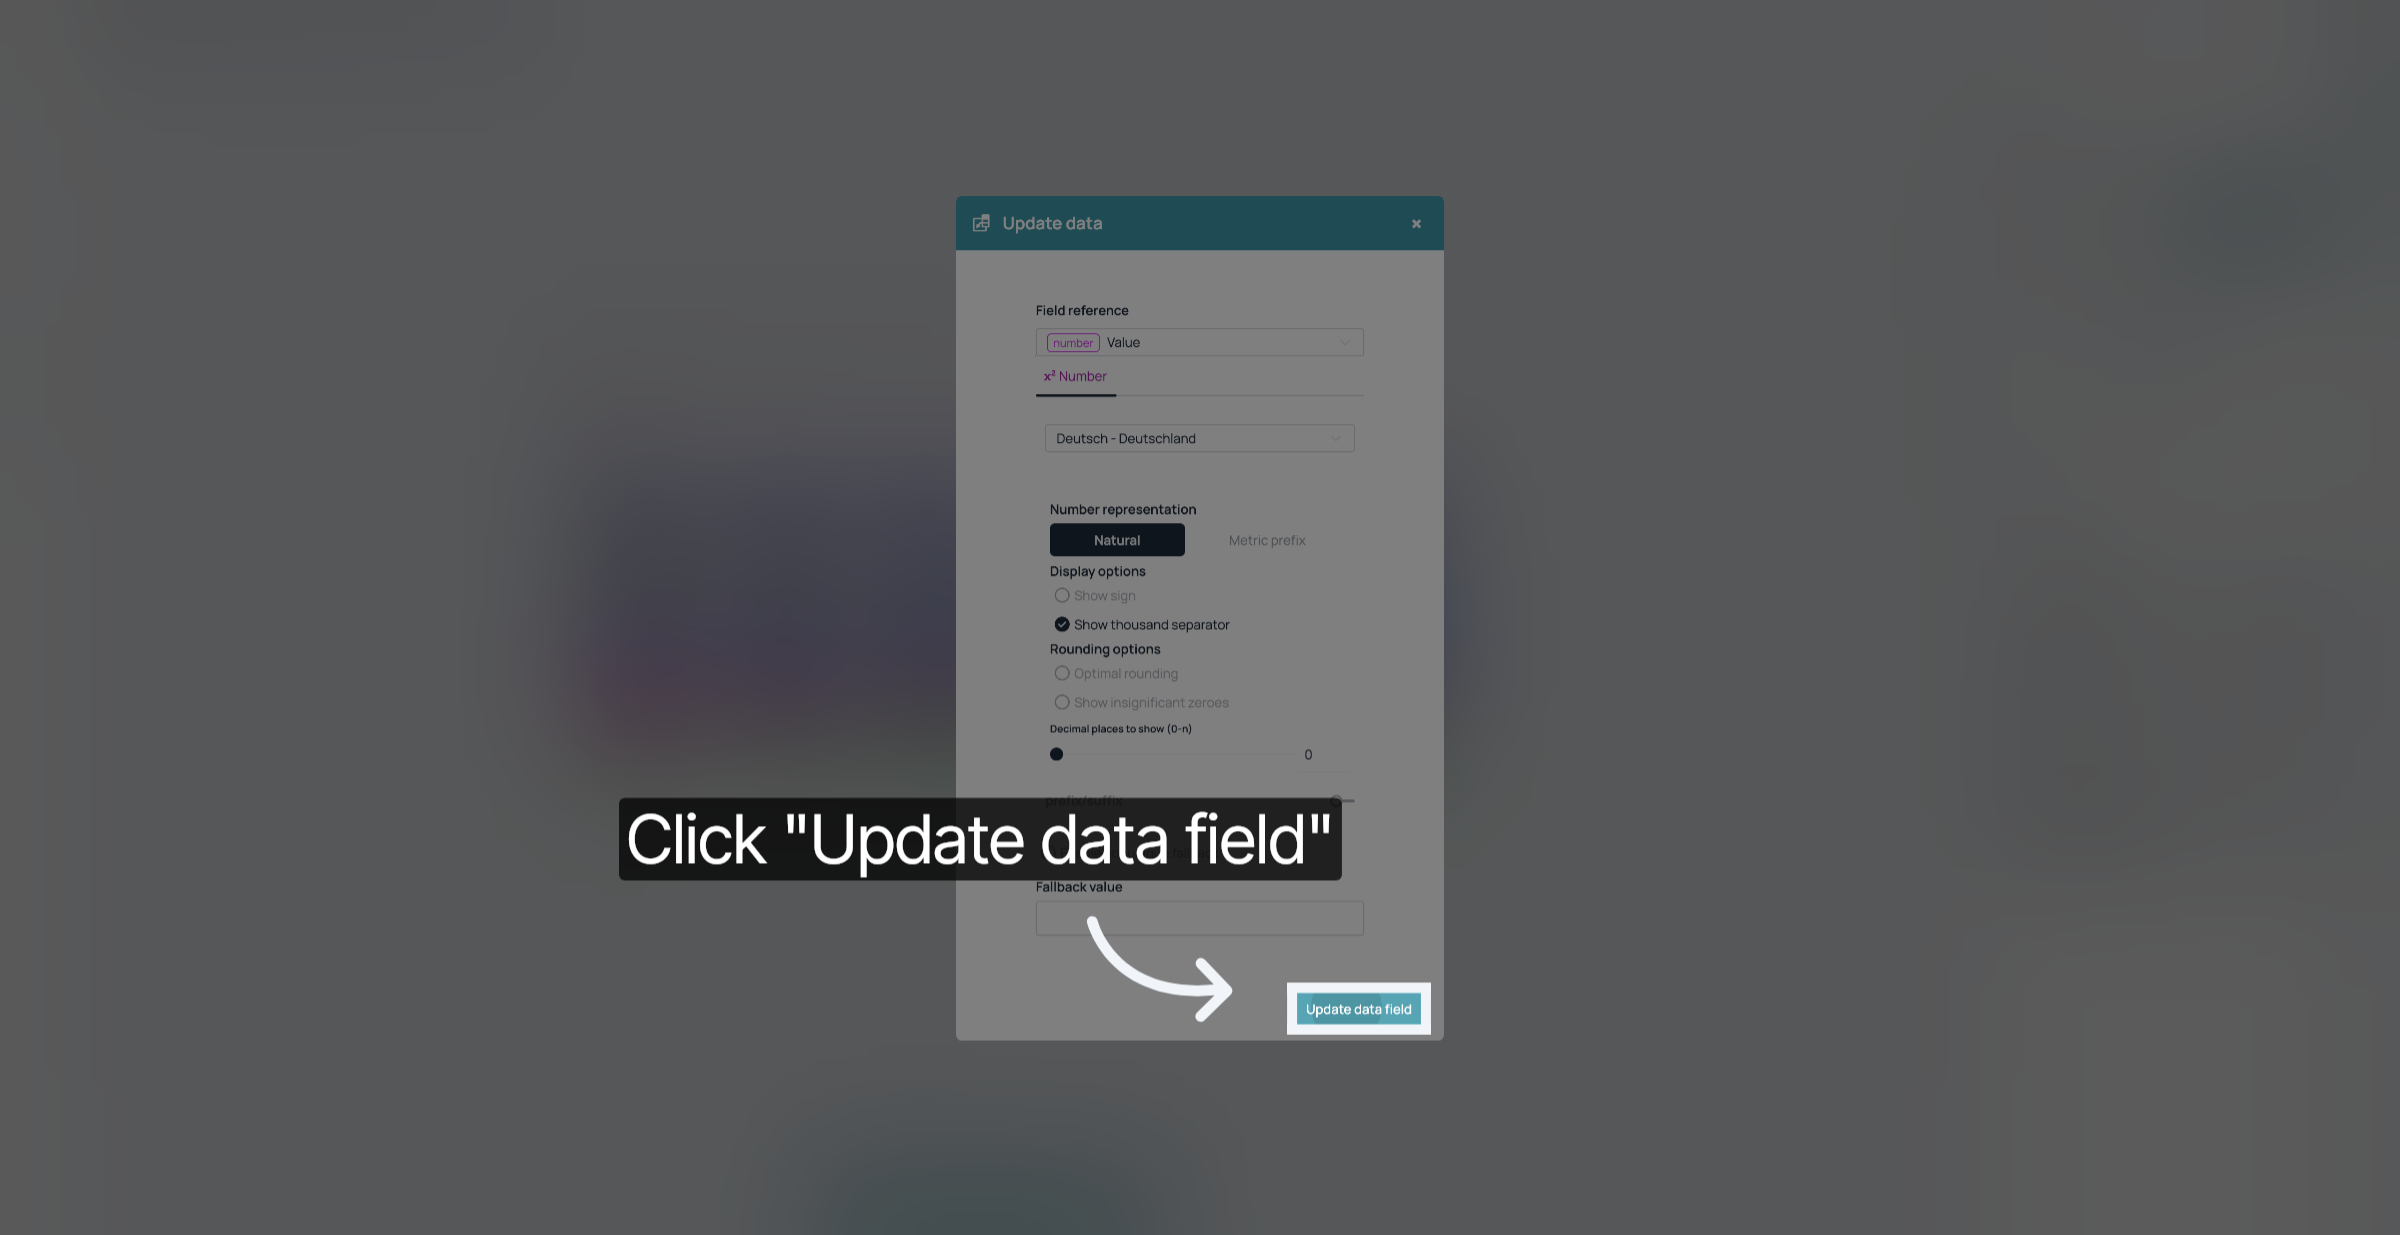
6. Update Data Field
Click "Update Data Field".
7. Save your changes
Don't forget to save your changes.
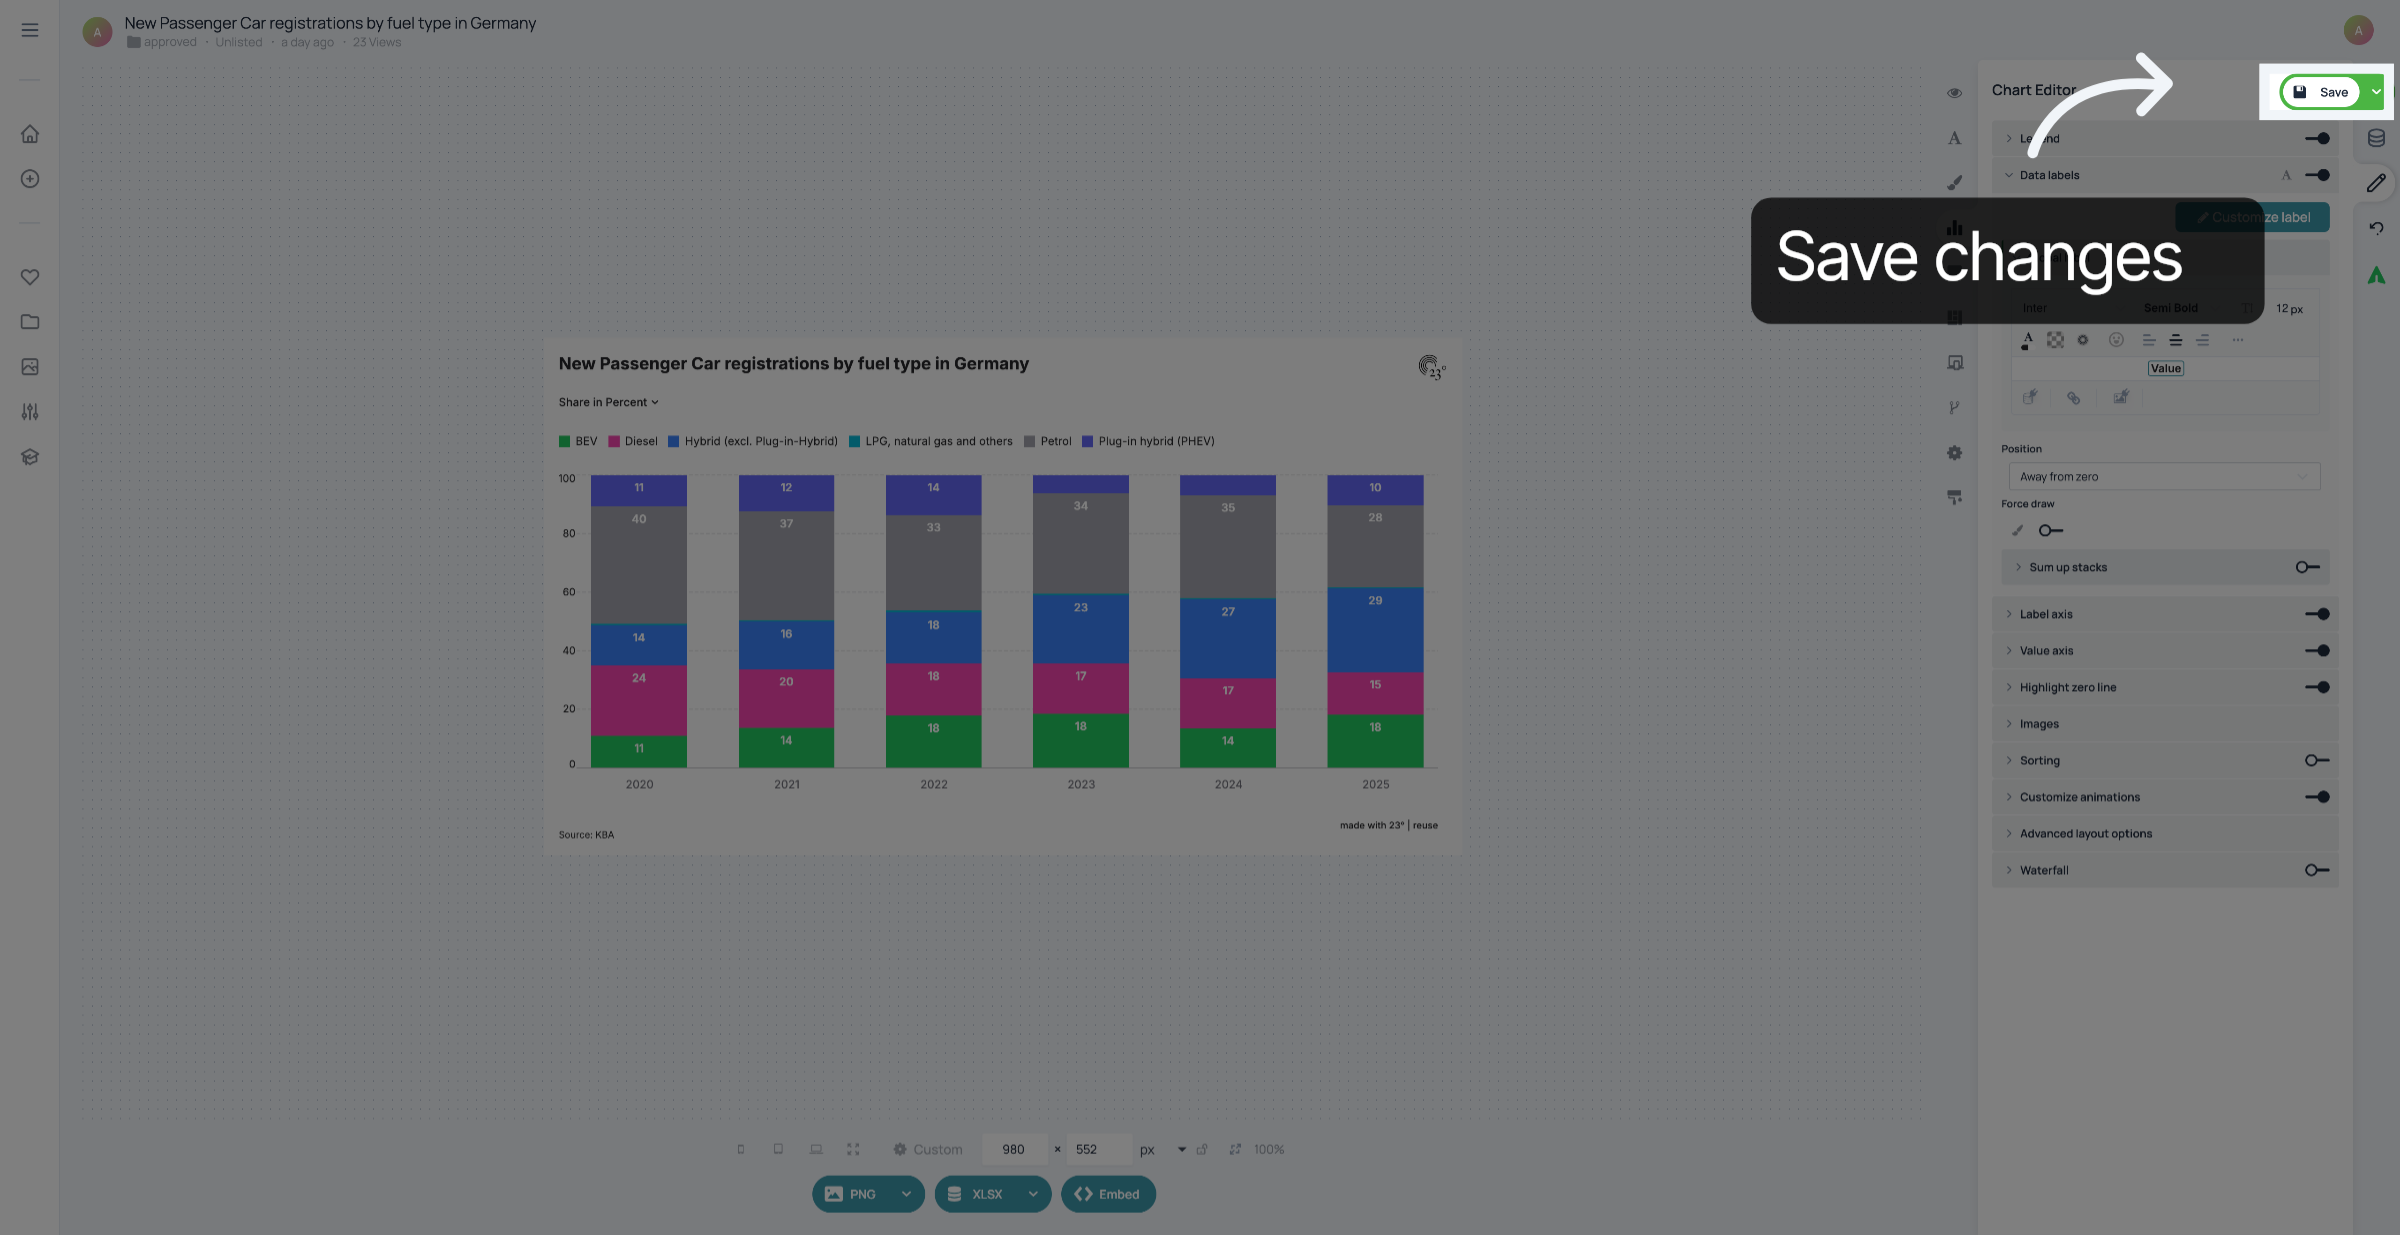
You have successfully rounded the values in your visualisation.