Dot Plots: Value Display
This tutorial guides you through configuring label display settings for dot plots in 23degrees.
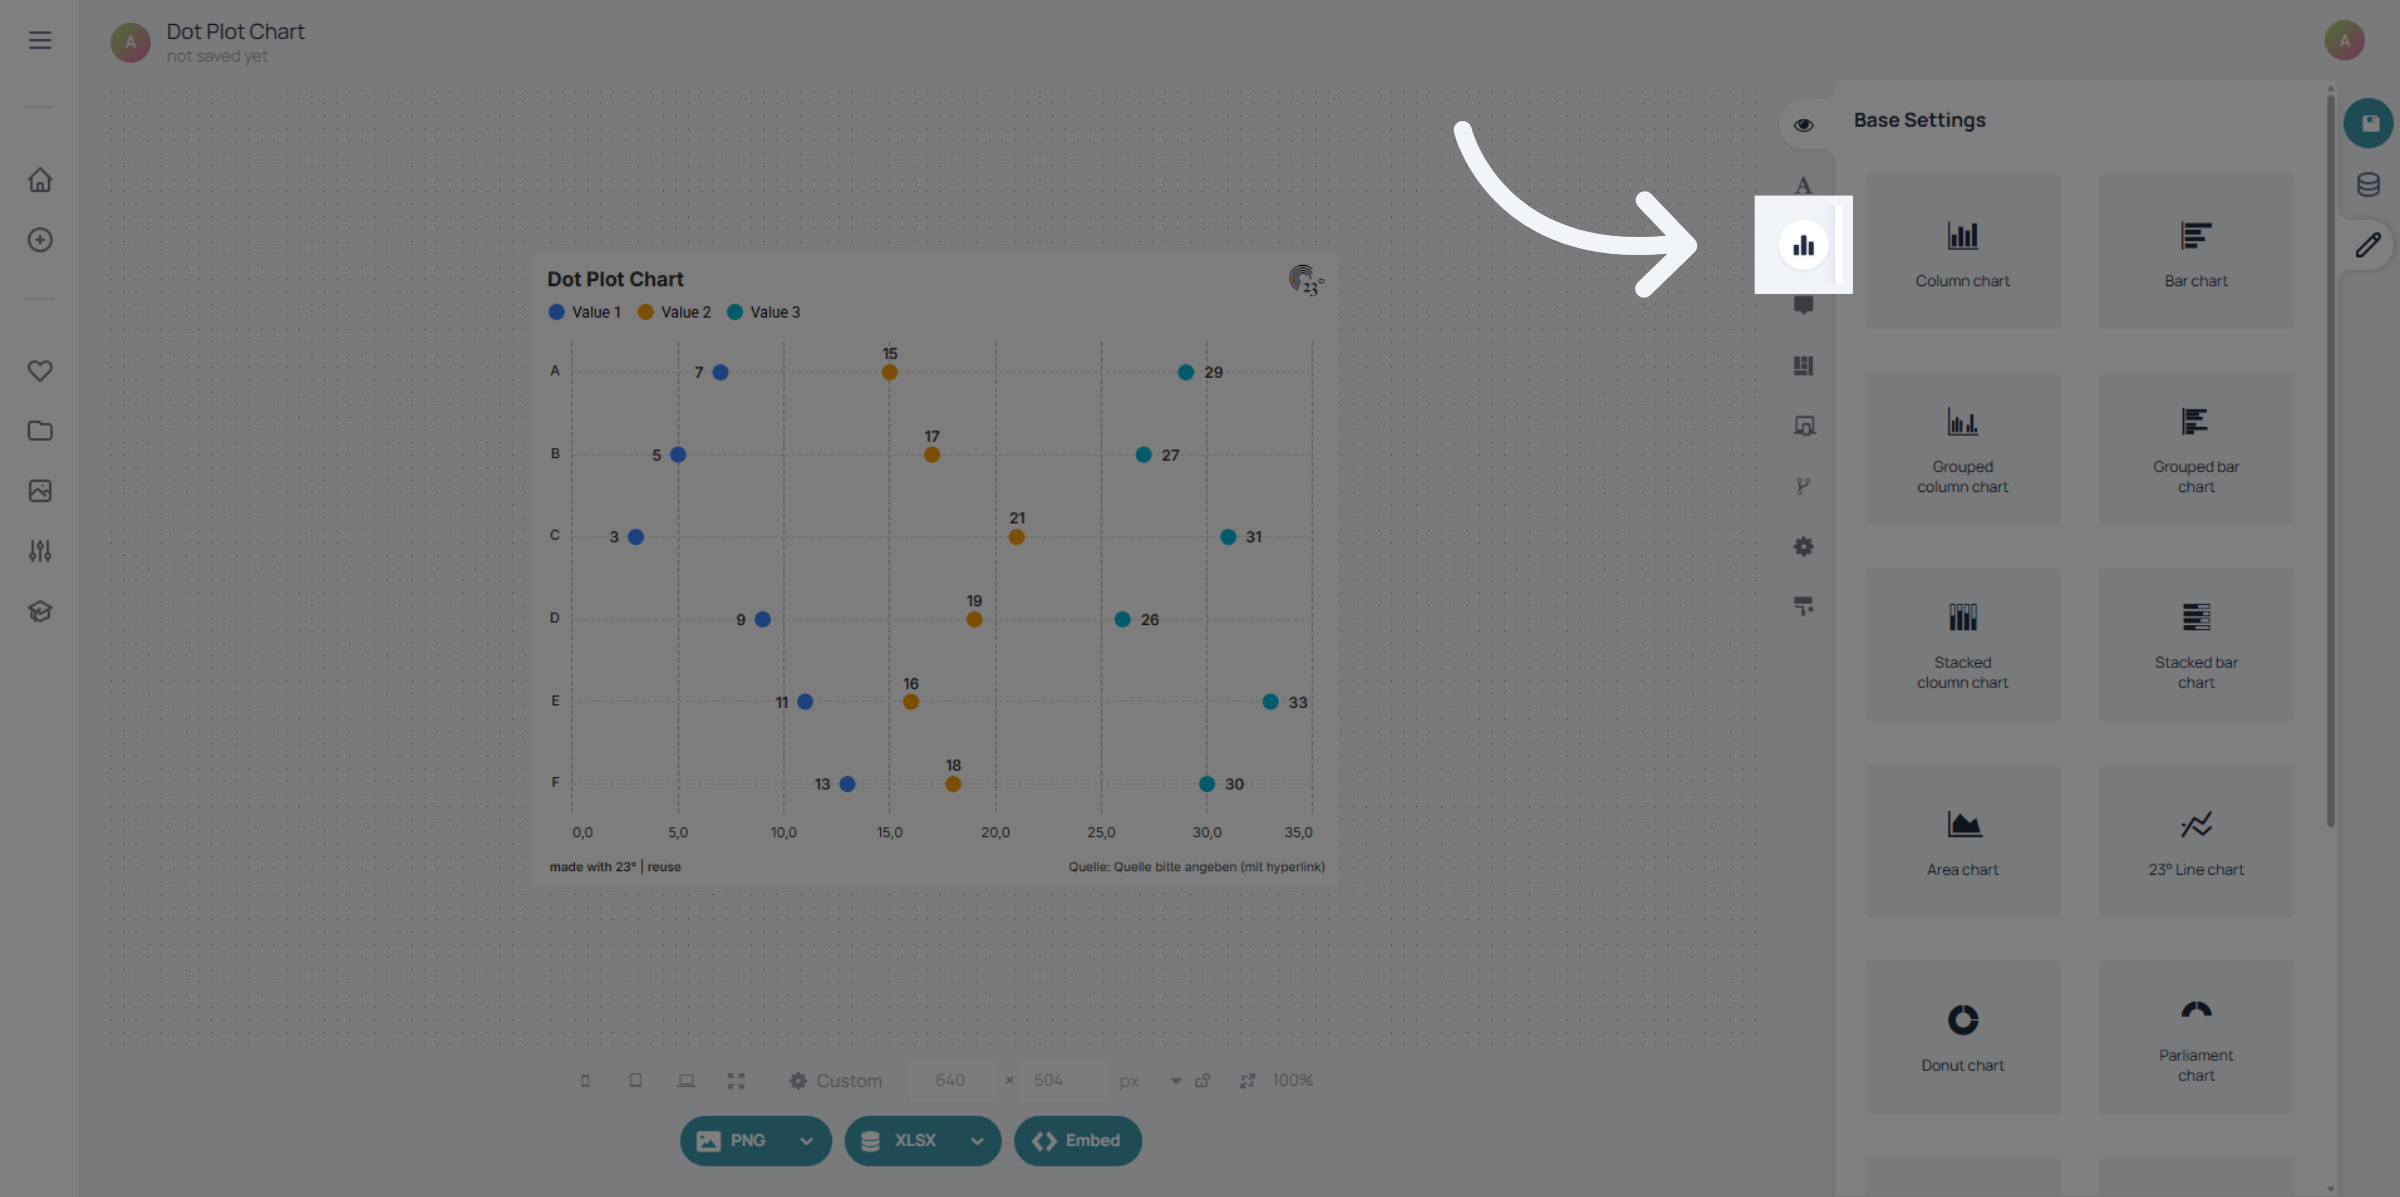
To access the value display options go to the chart editor.
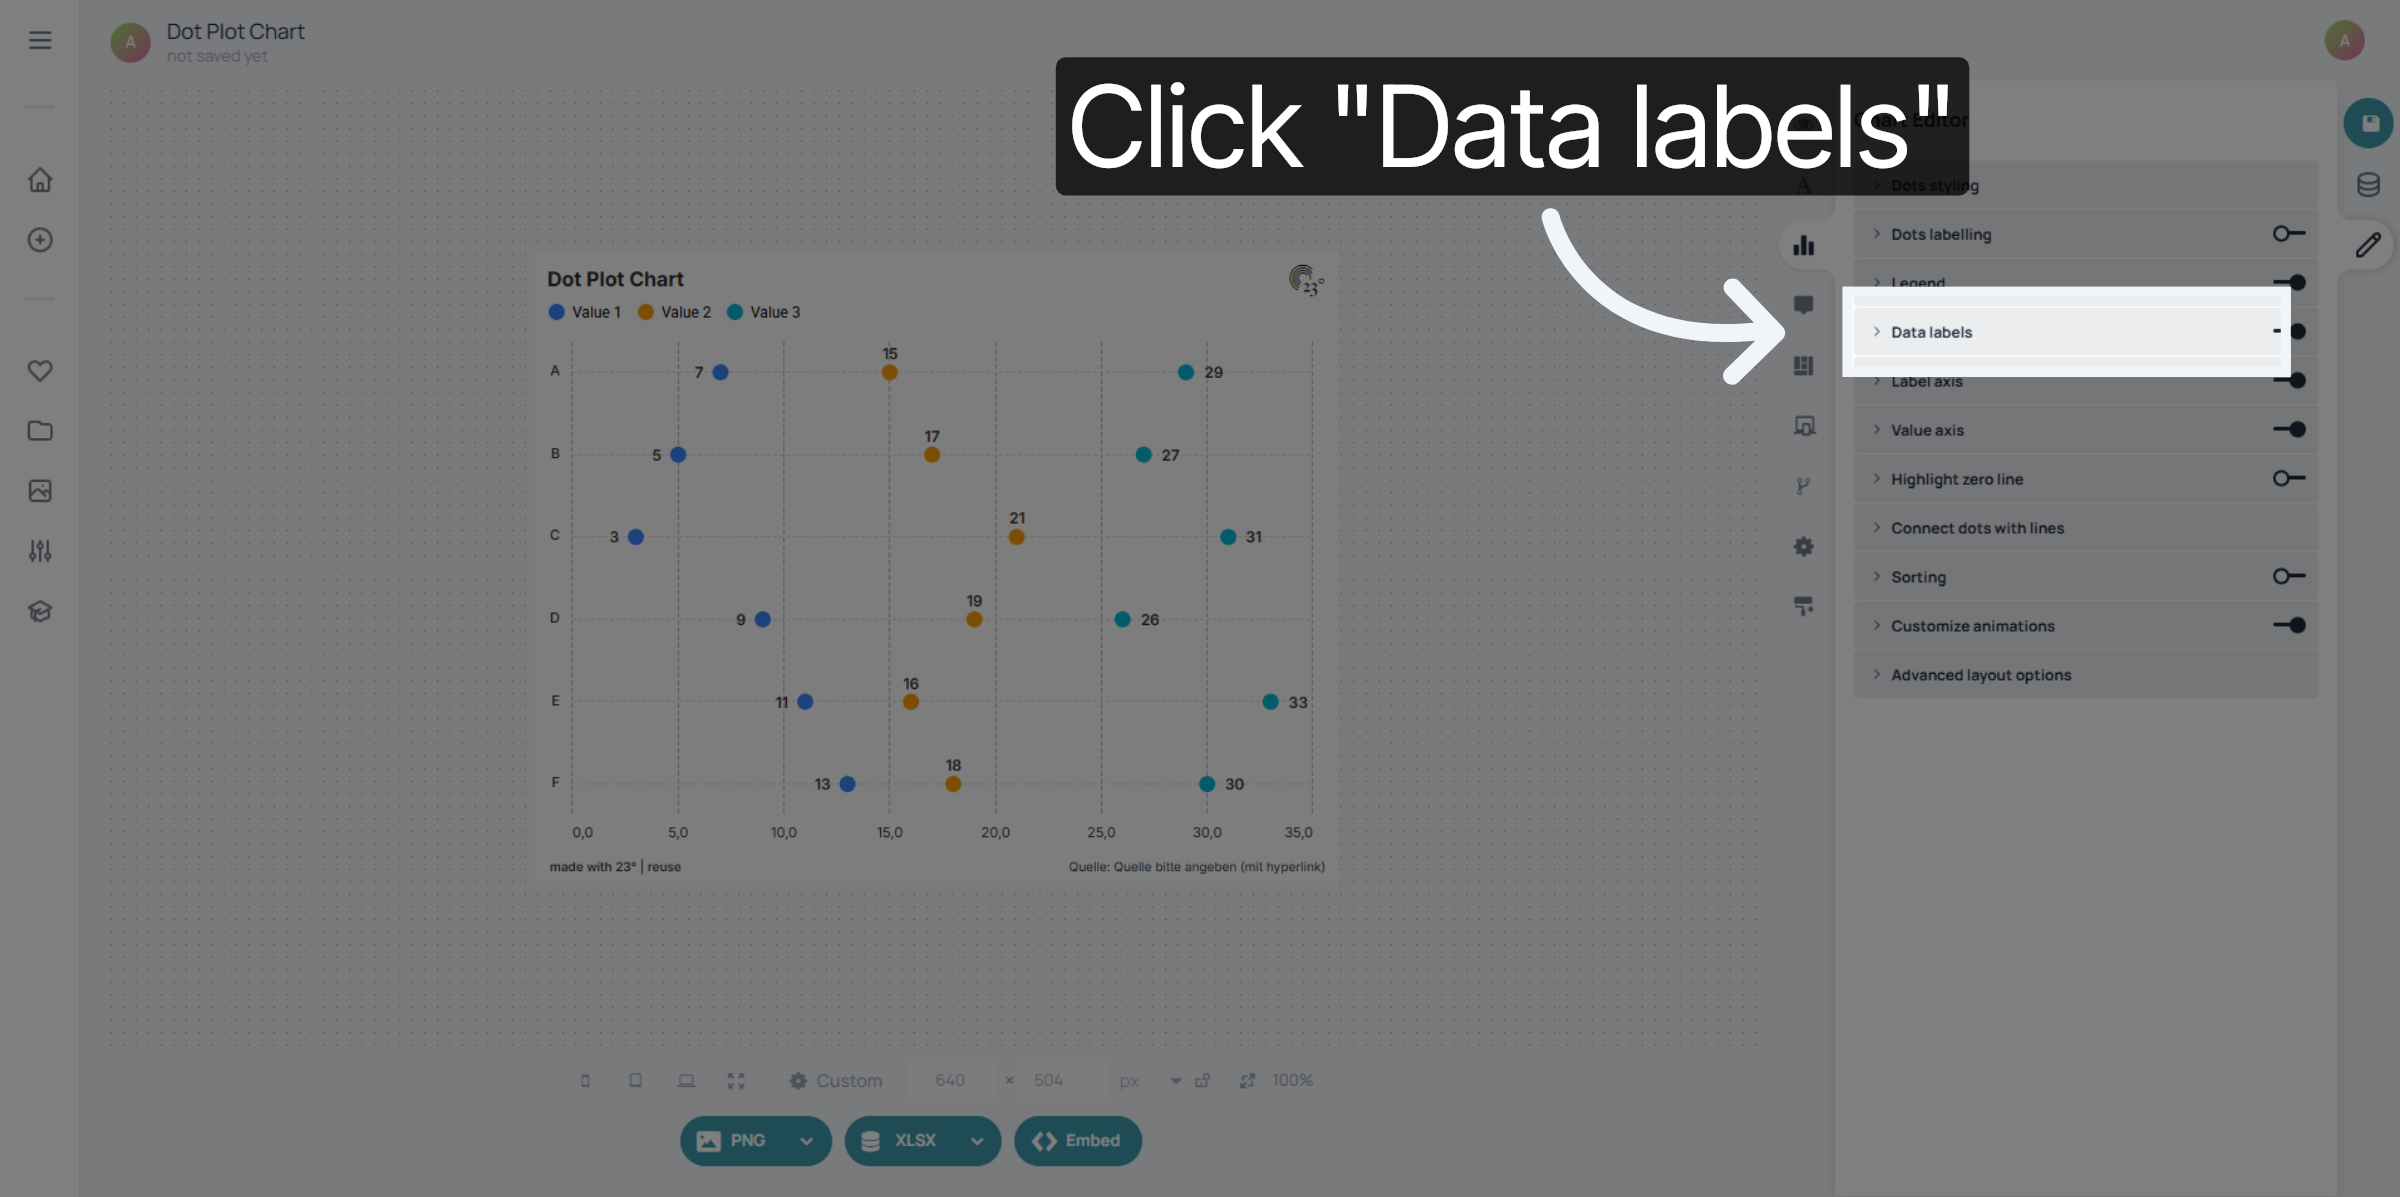
Click Data labels to modify how labels appear on your dot plot.
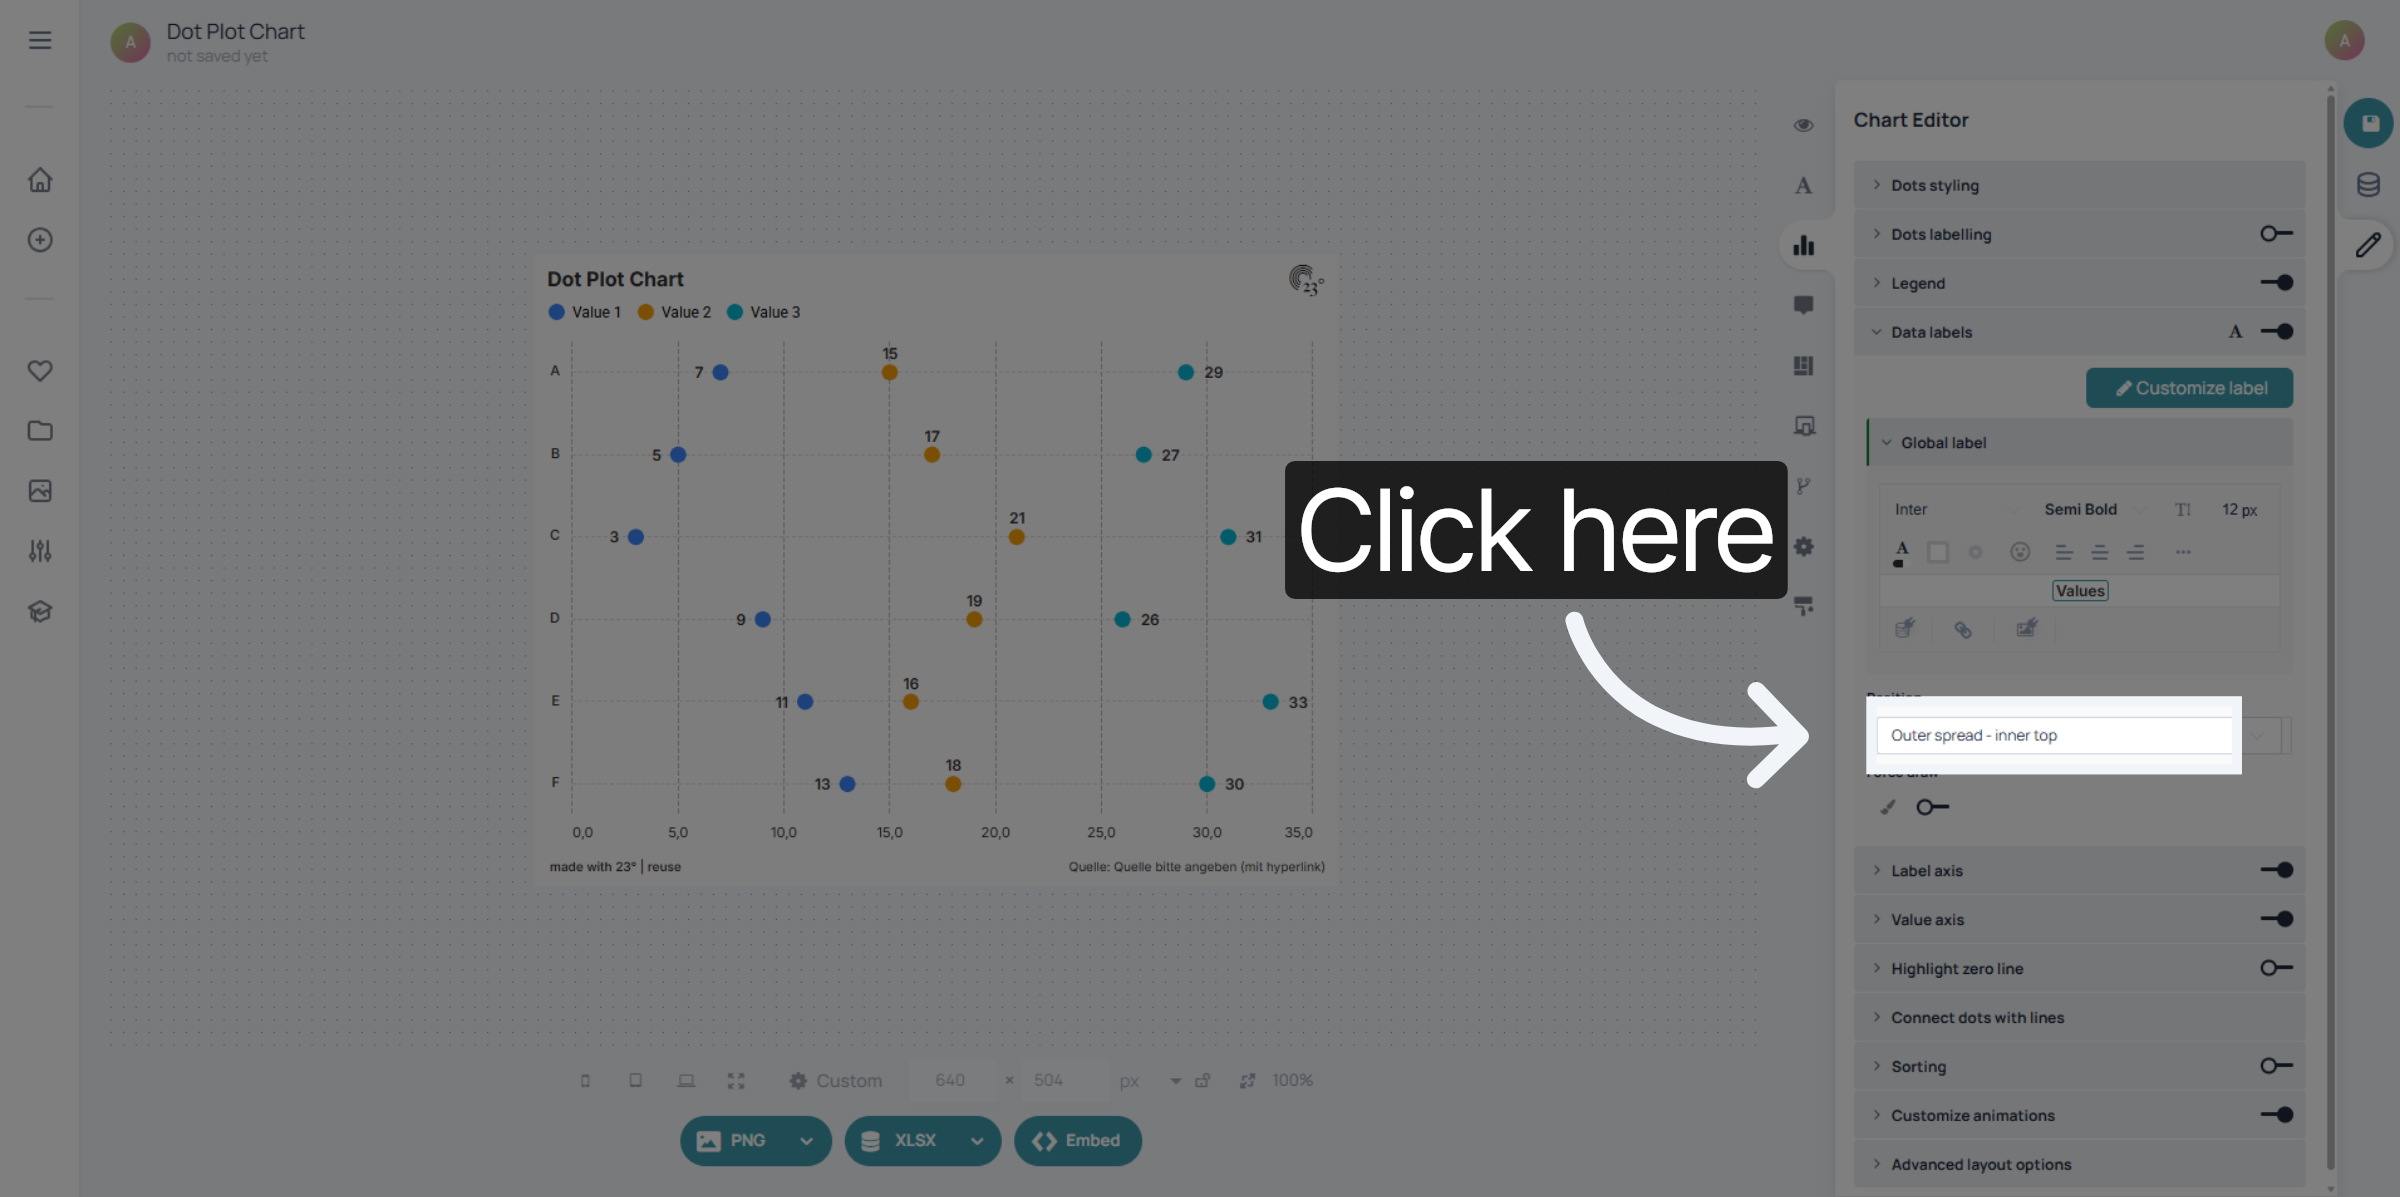
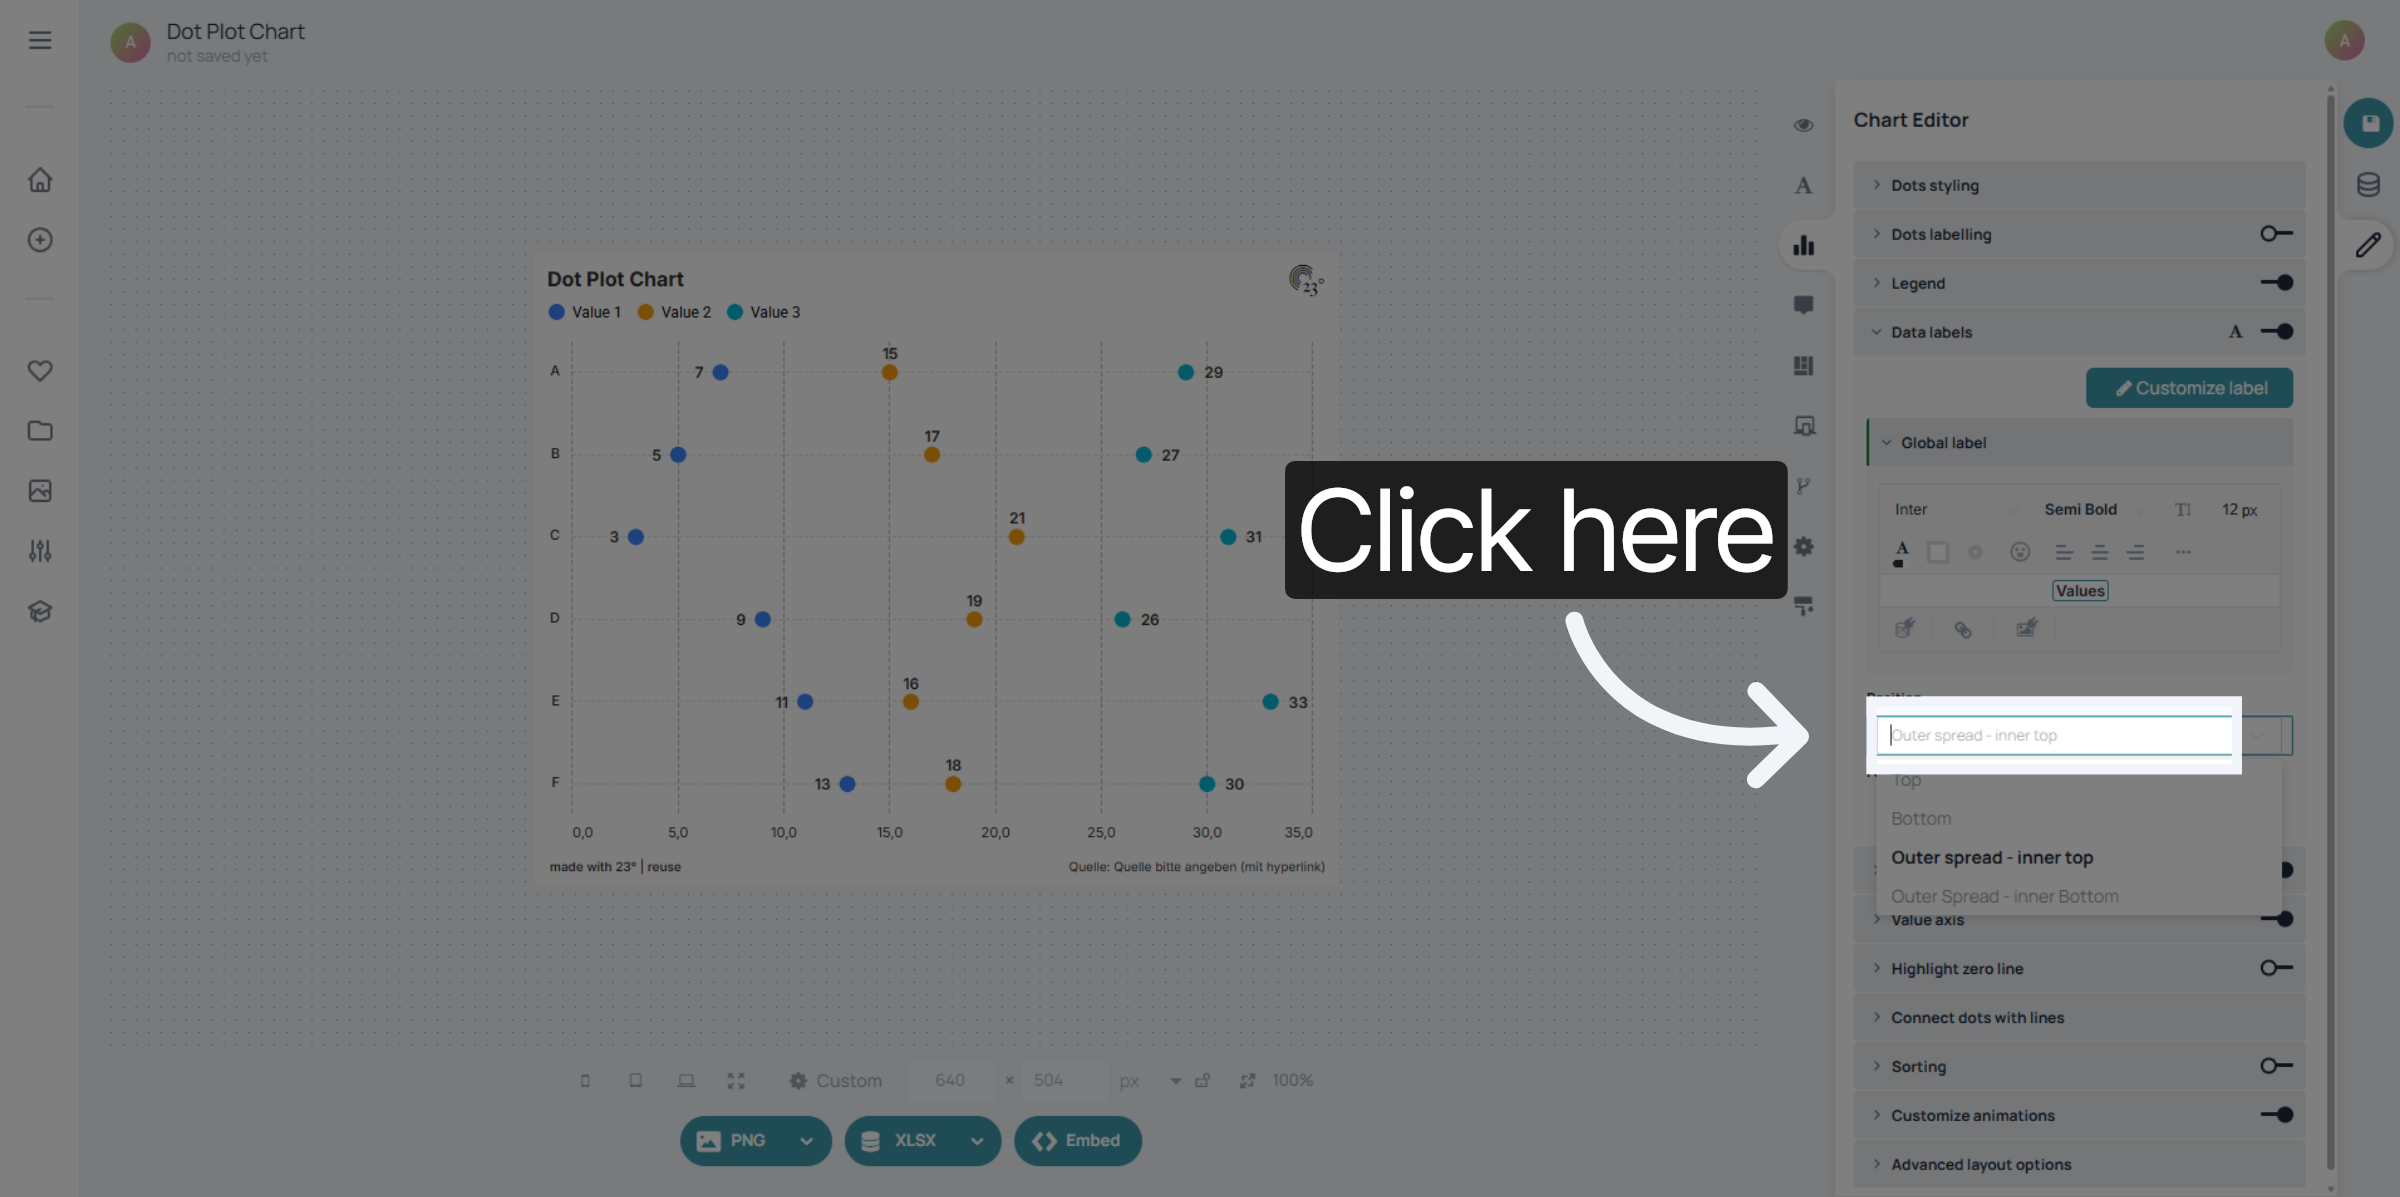
Click here to open the label position options.
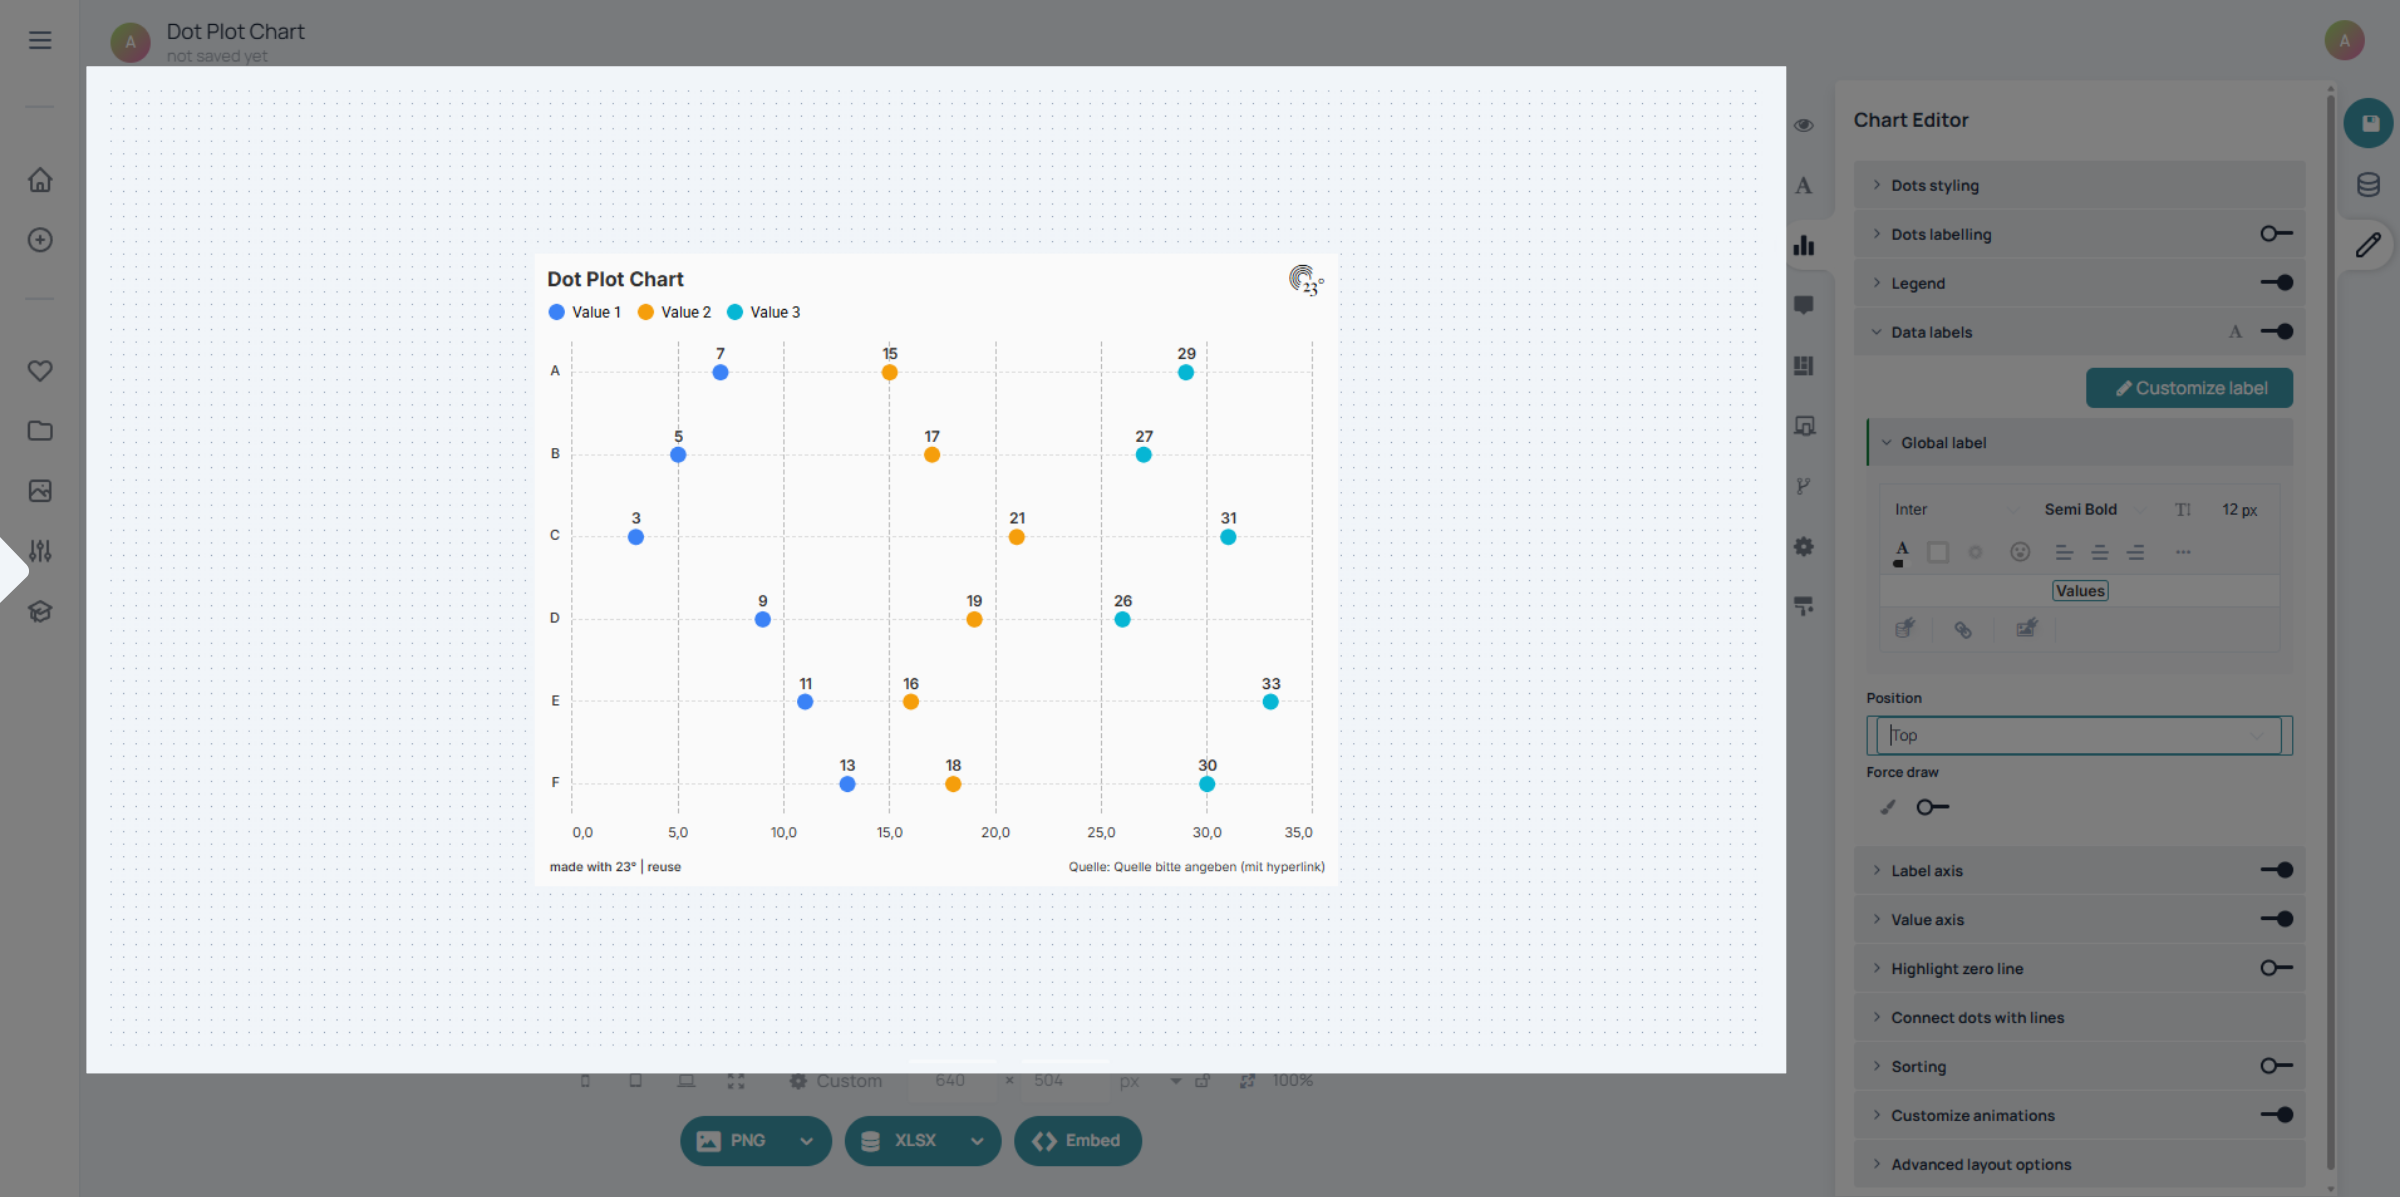
Click Top to position data labels above the dots.
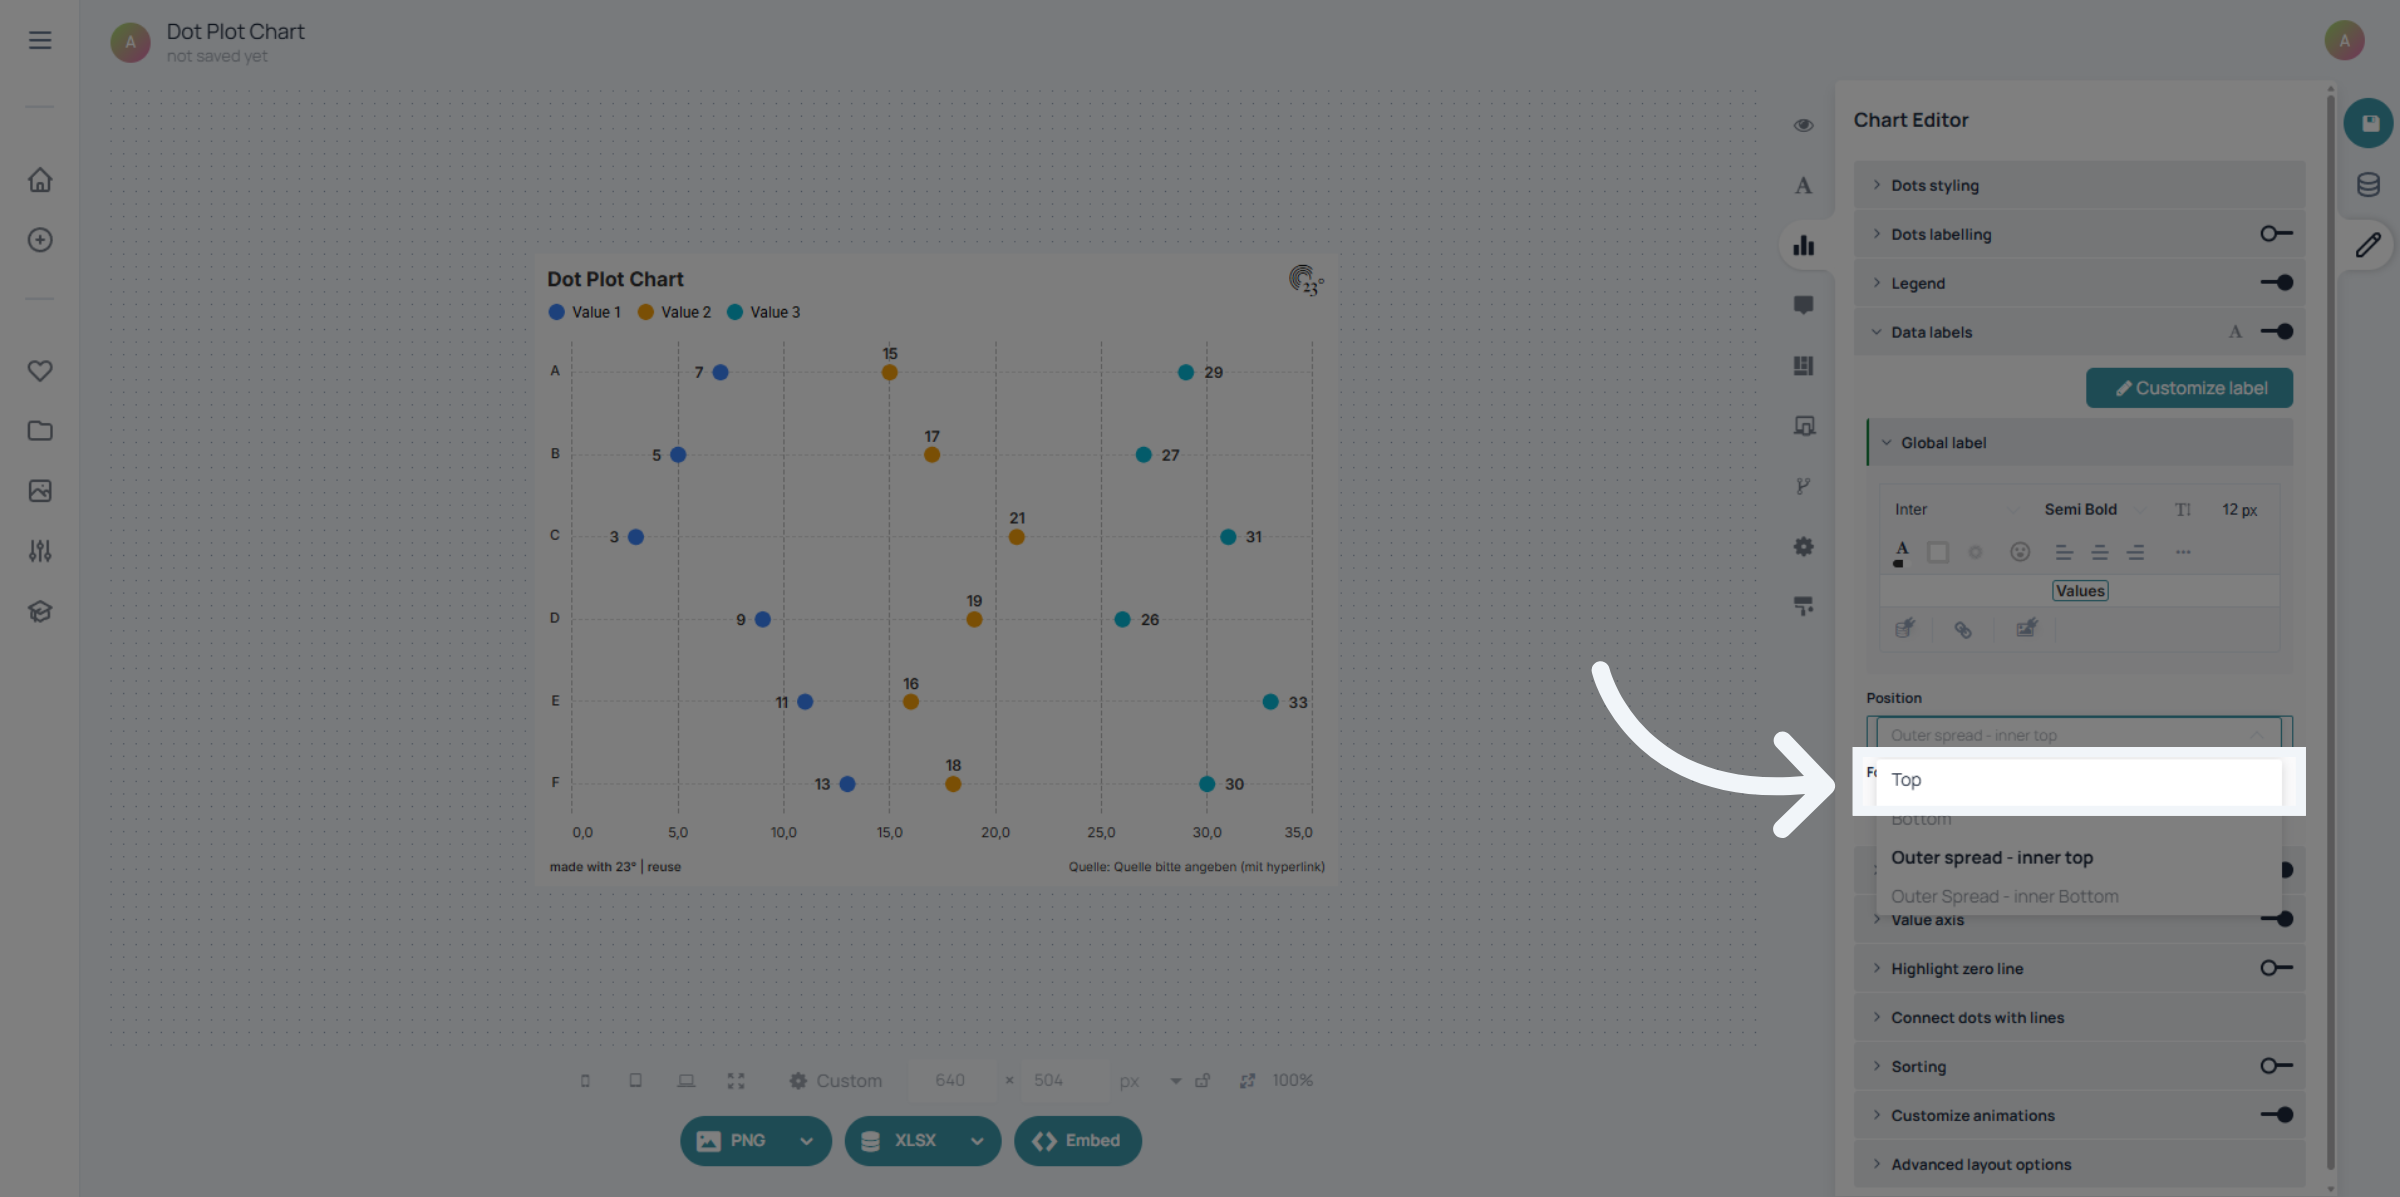
Now all your values are on top of the dot
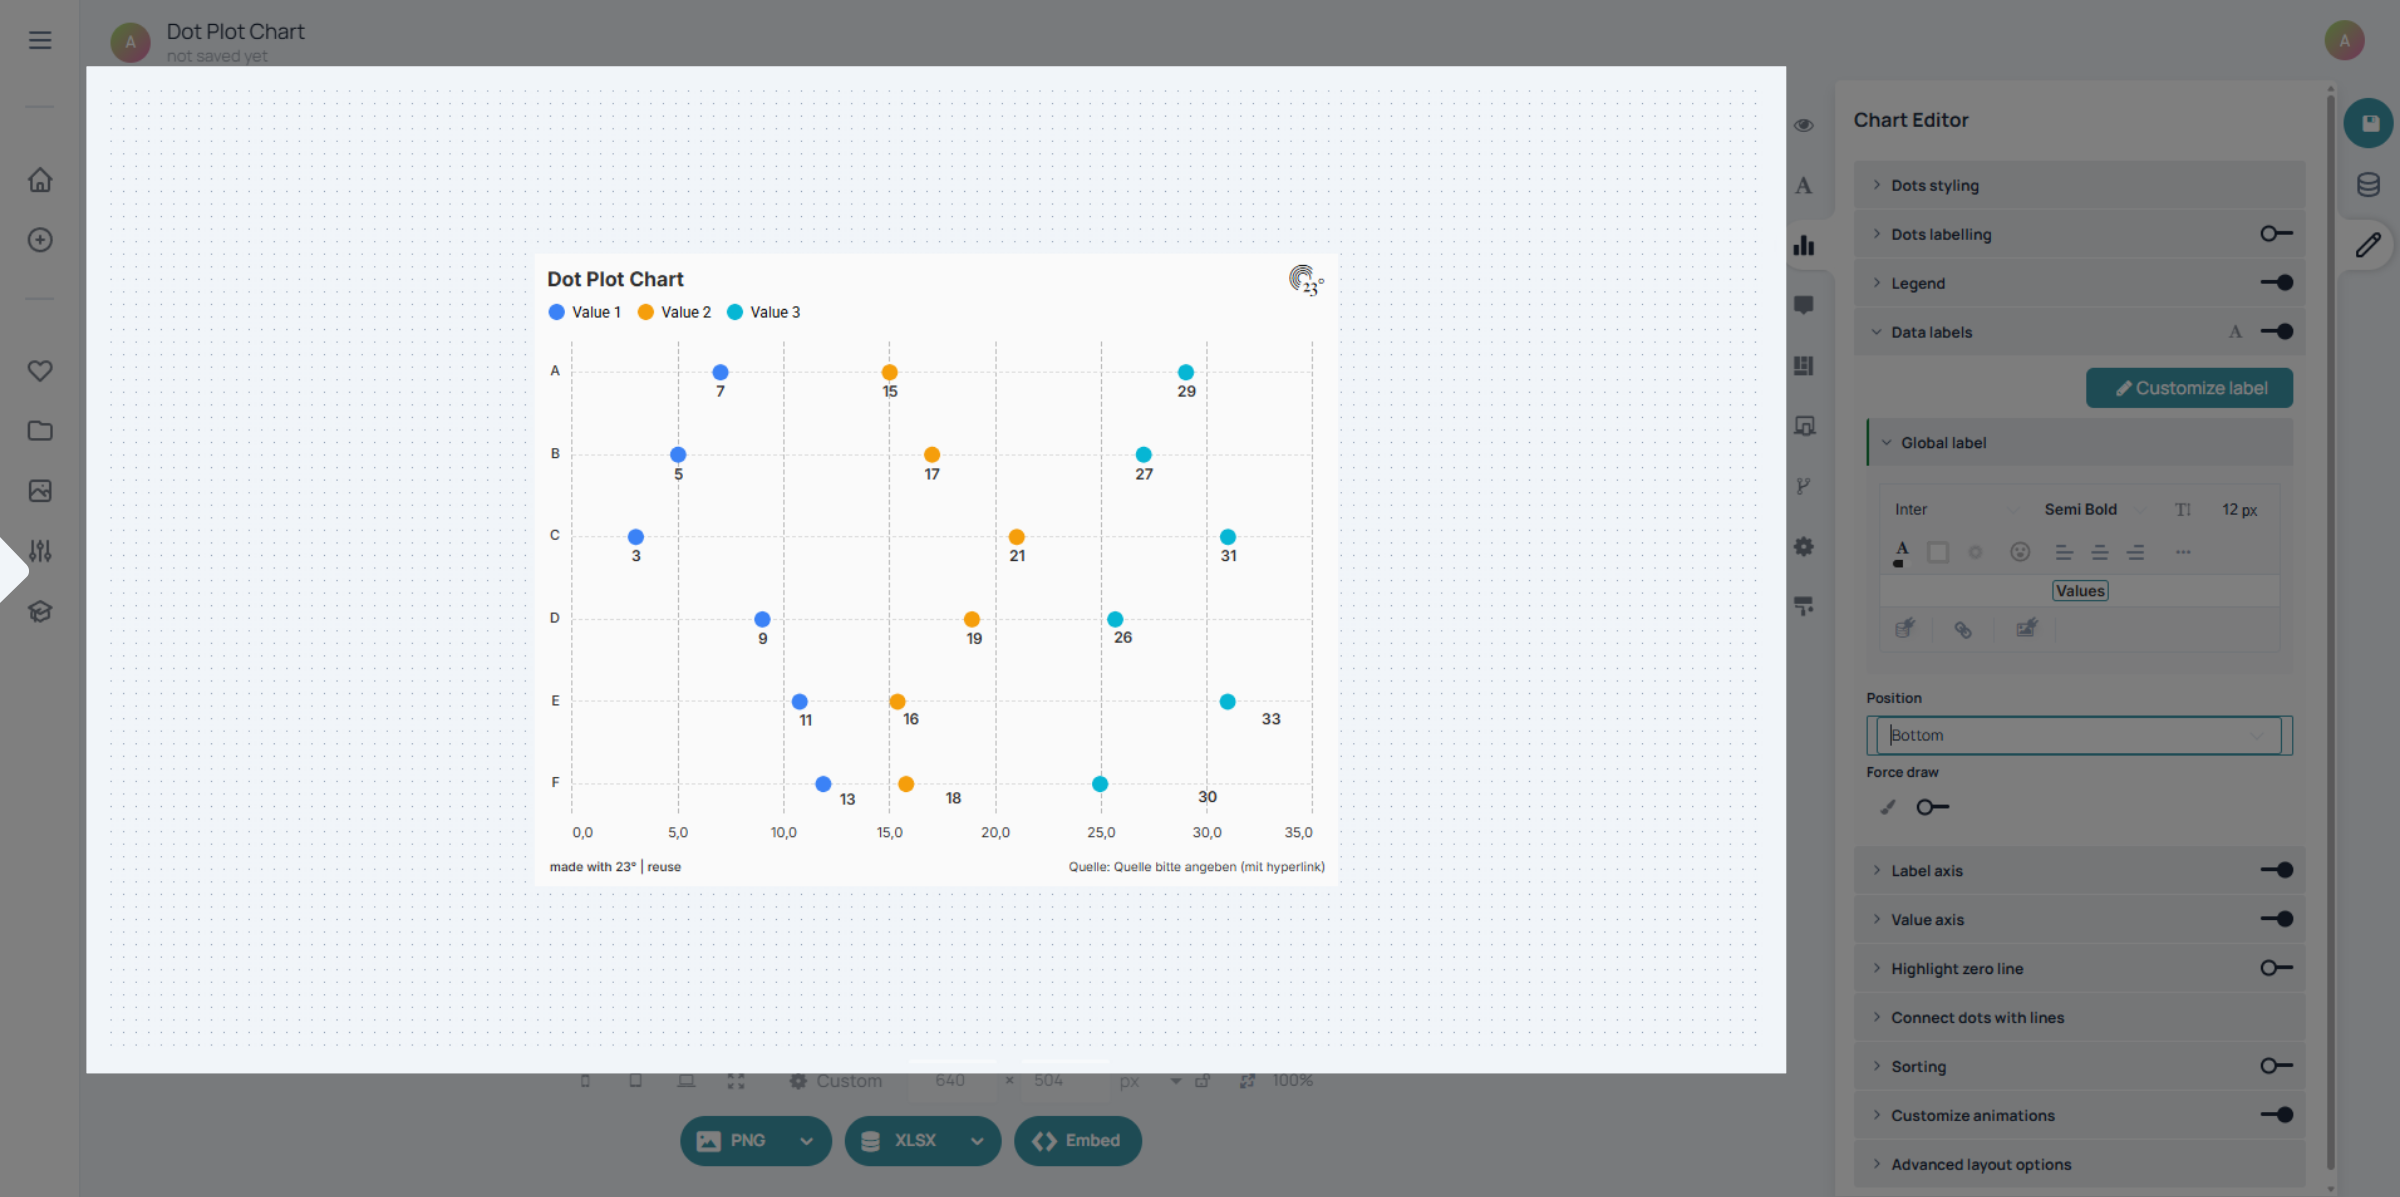
Click Bottom to place data labels below the dots.
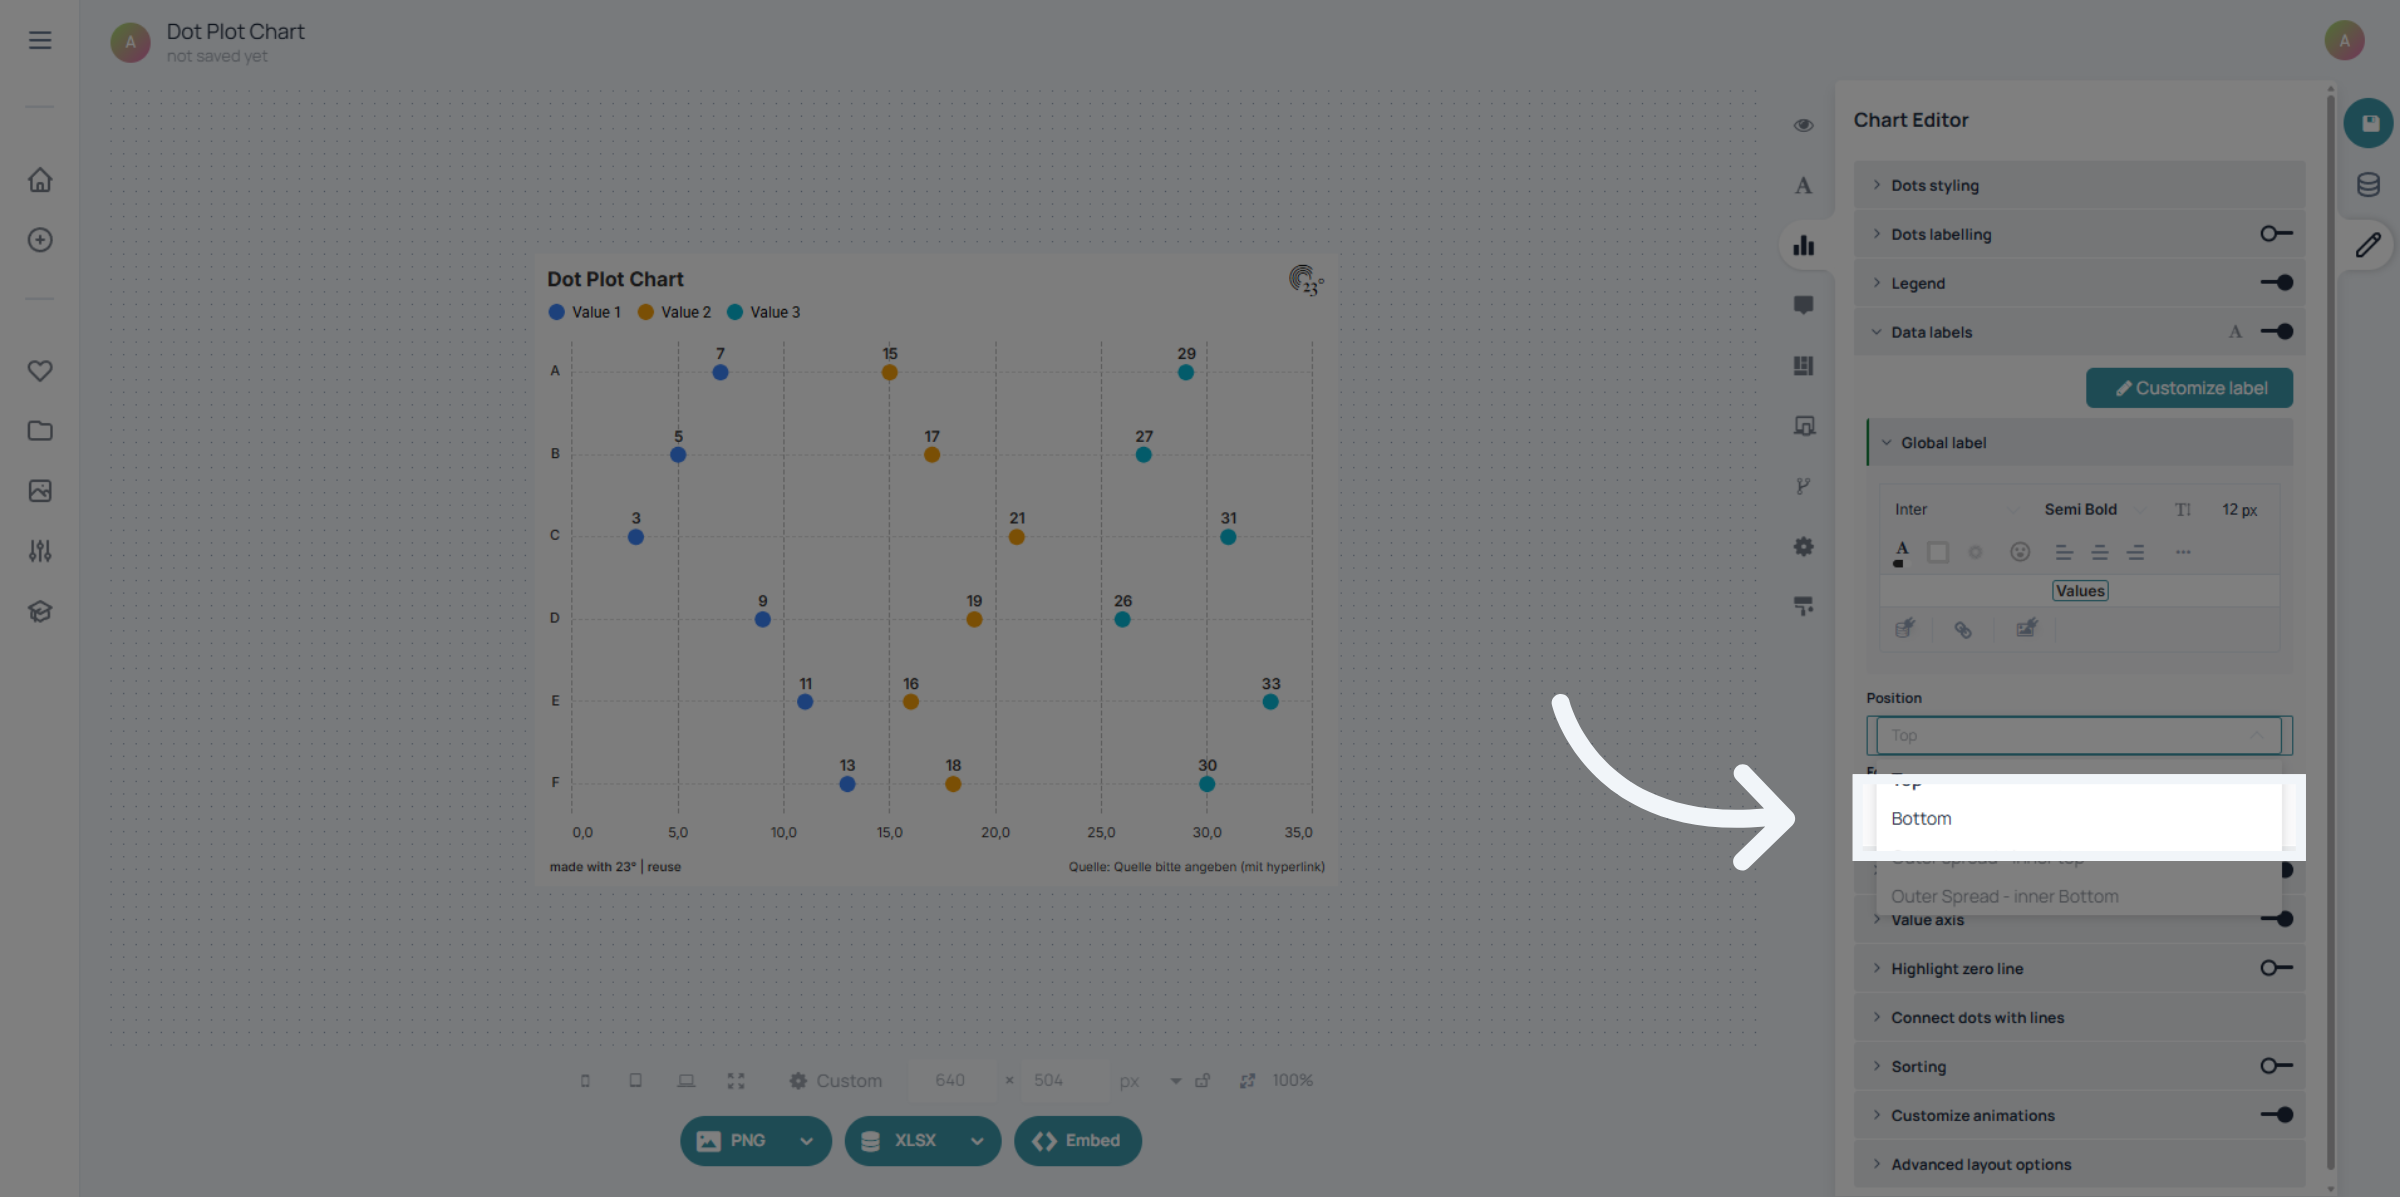
Now all your values are below the dots.
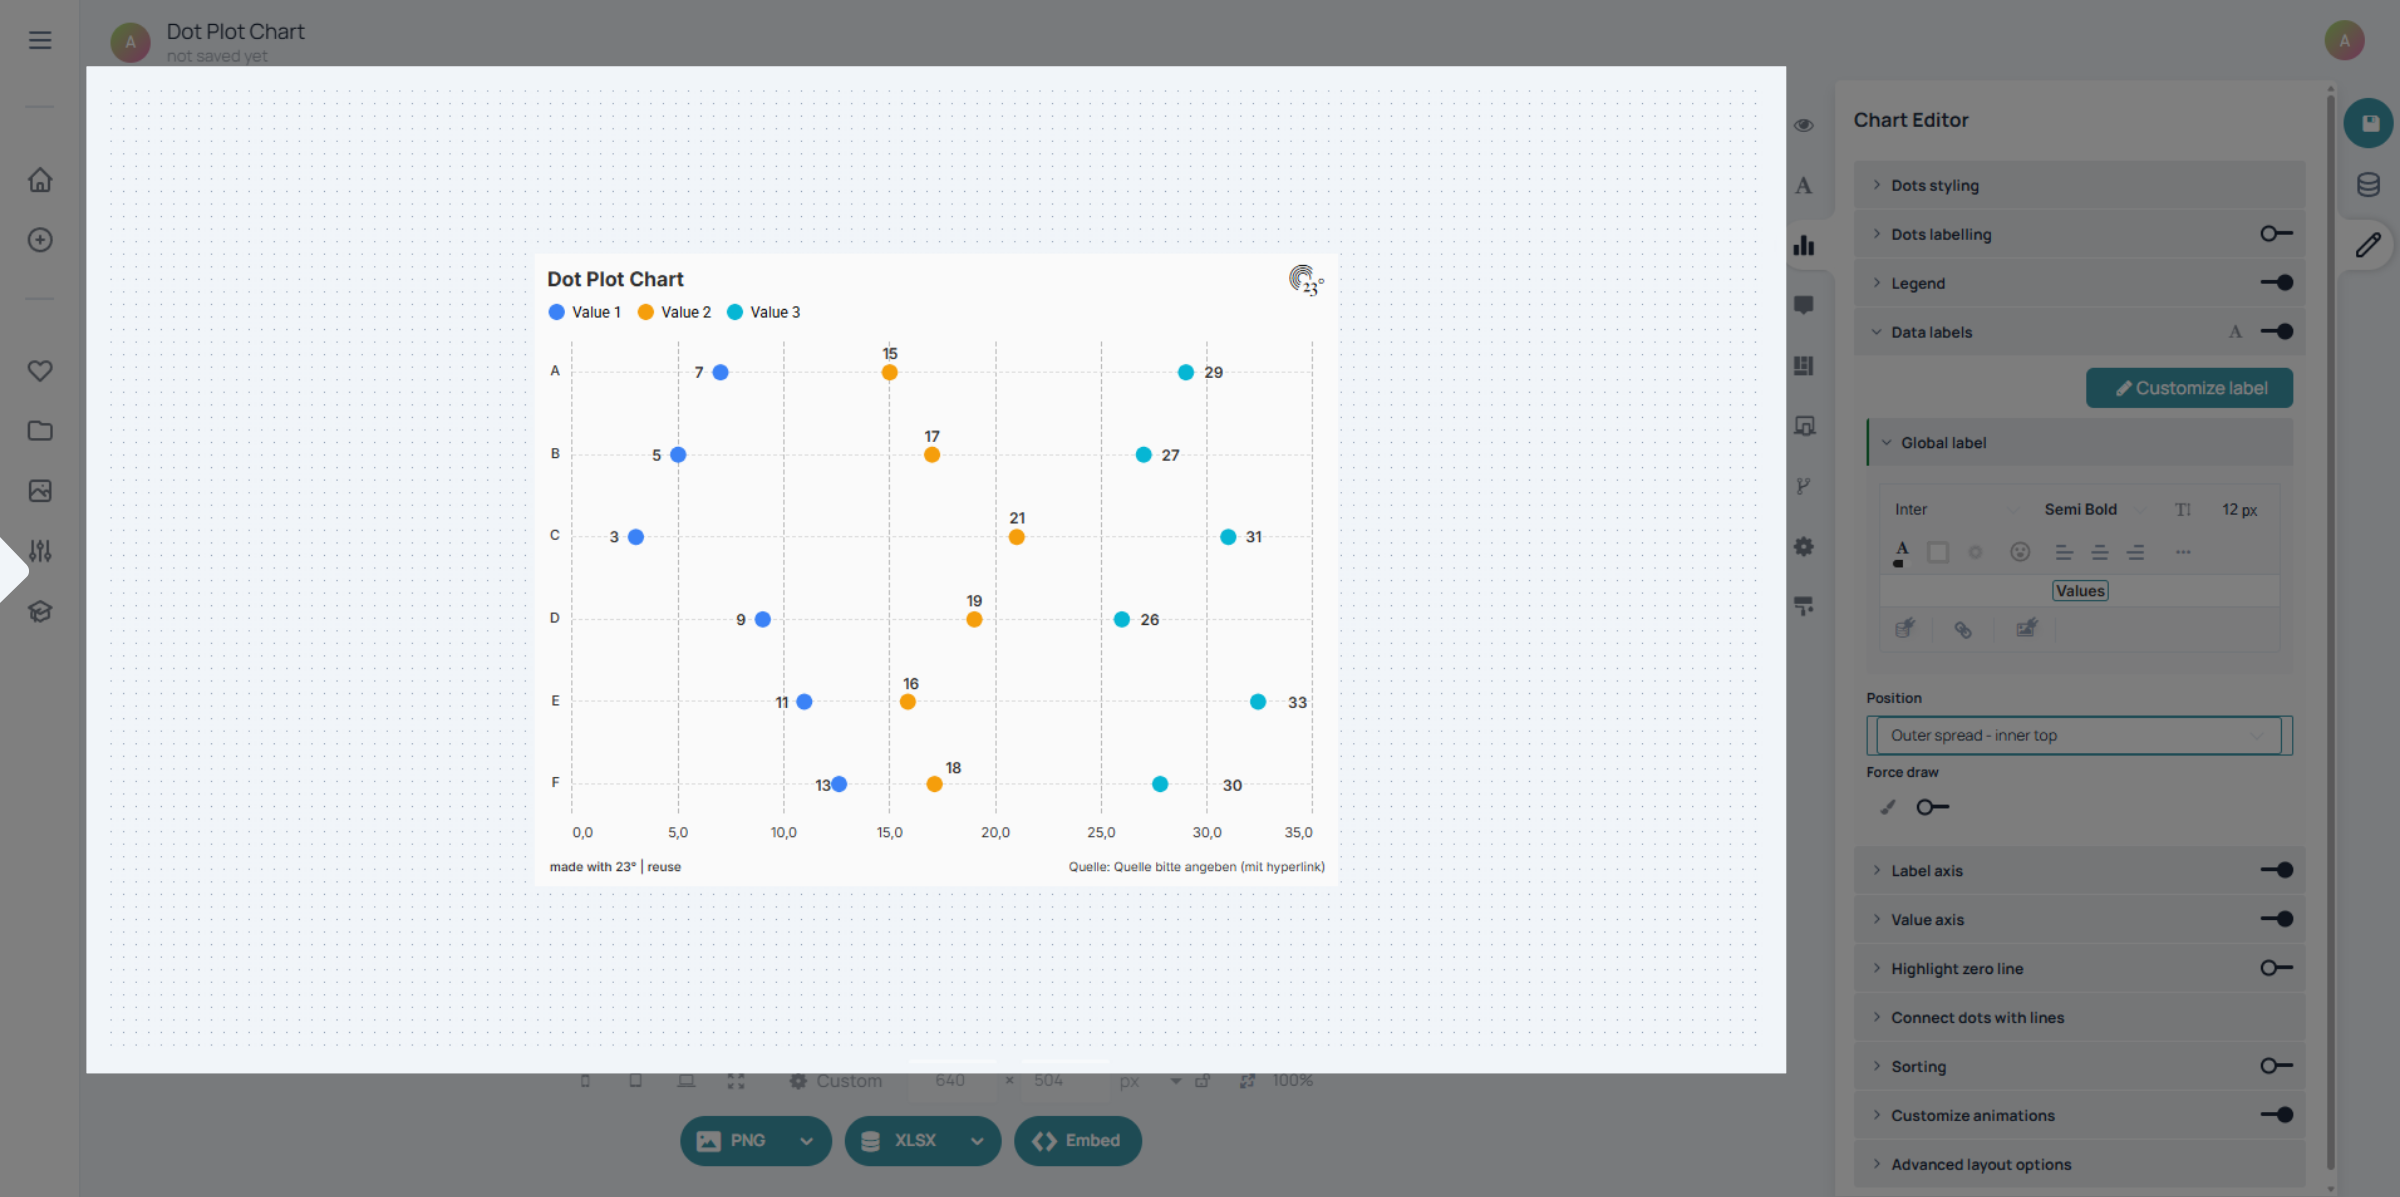
Click Outer spread - inner top if you want the outer labels to the side and the middle ones above the dots.
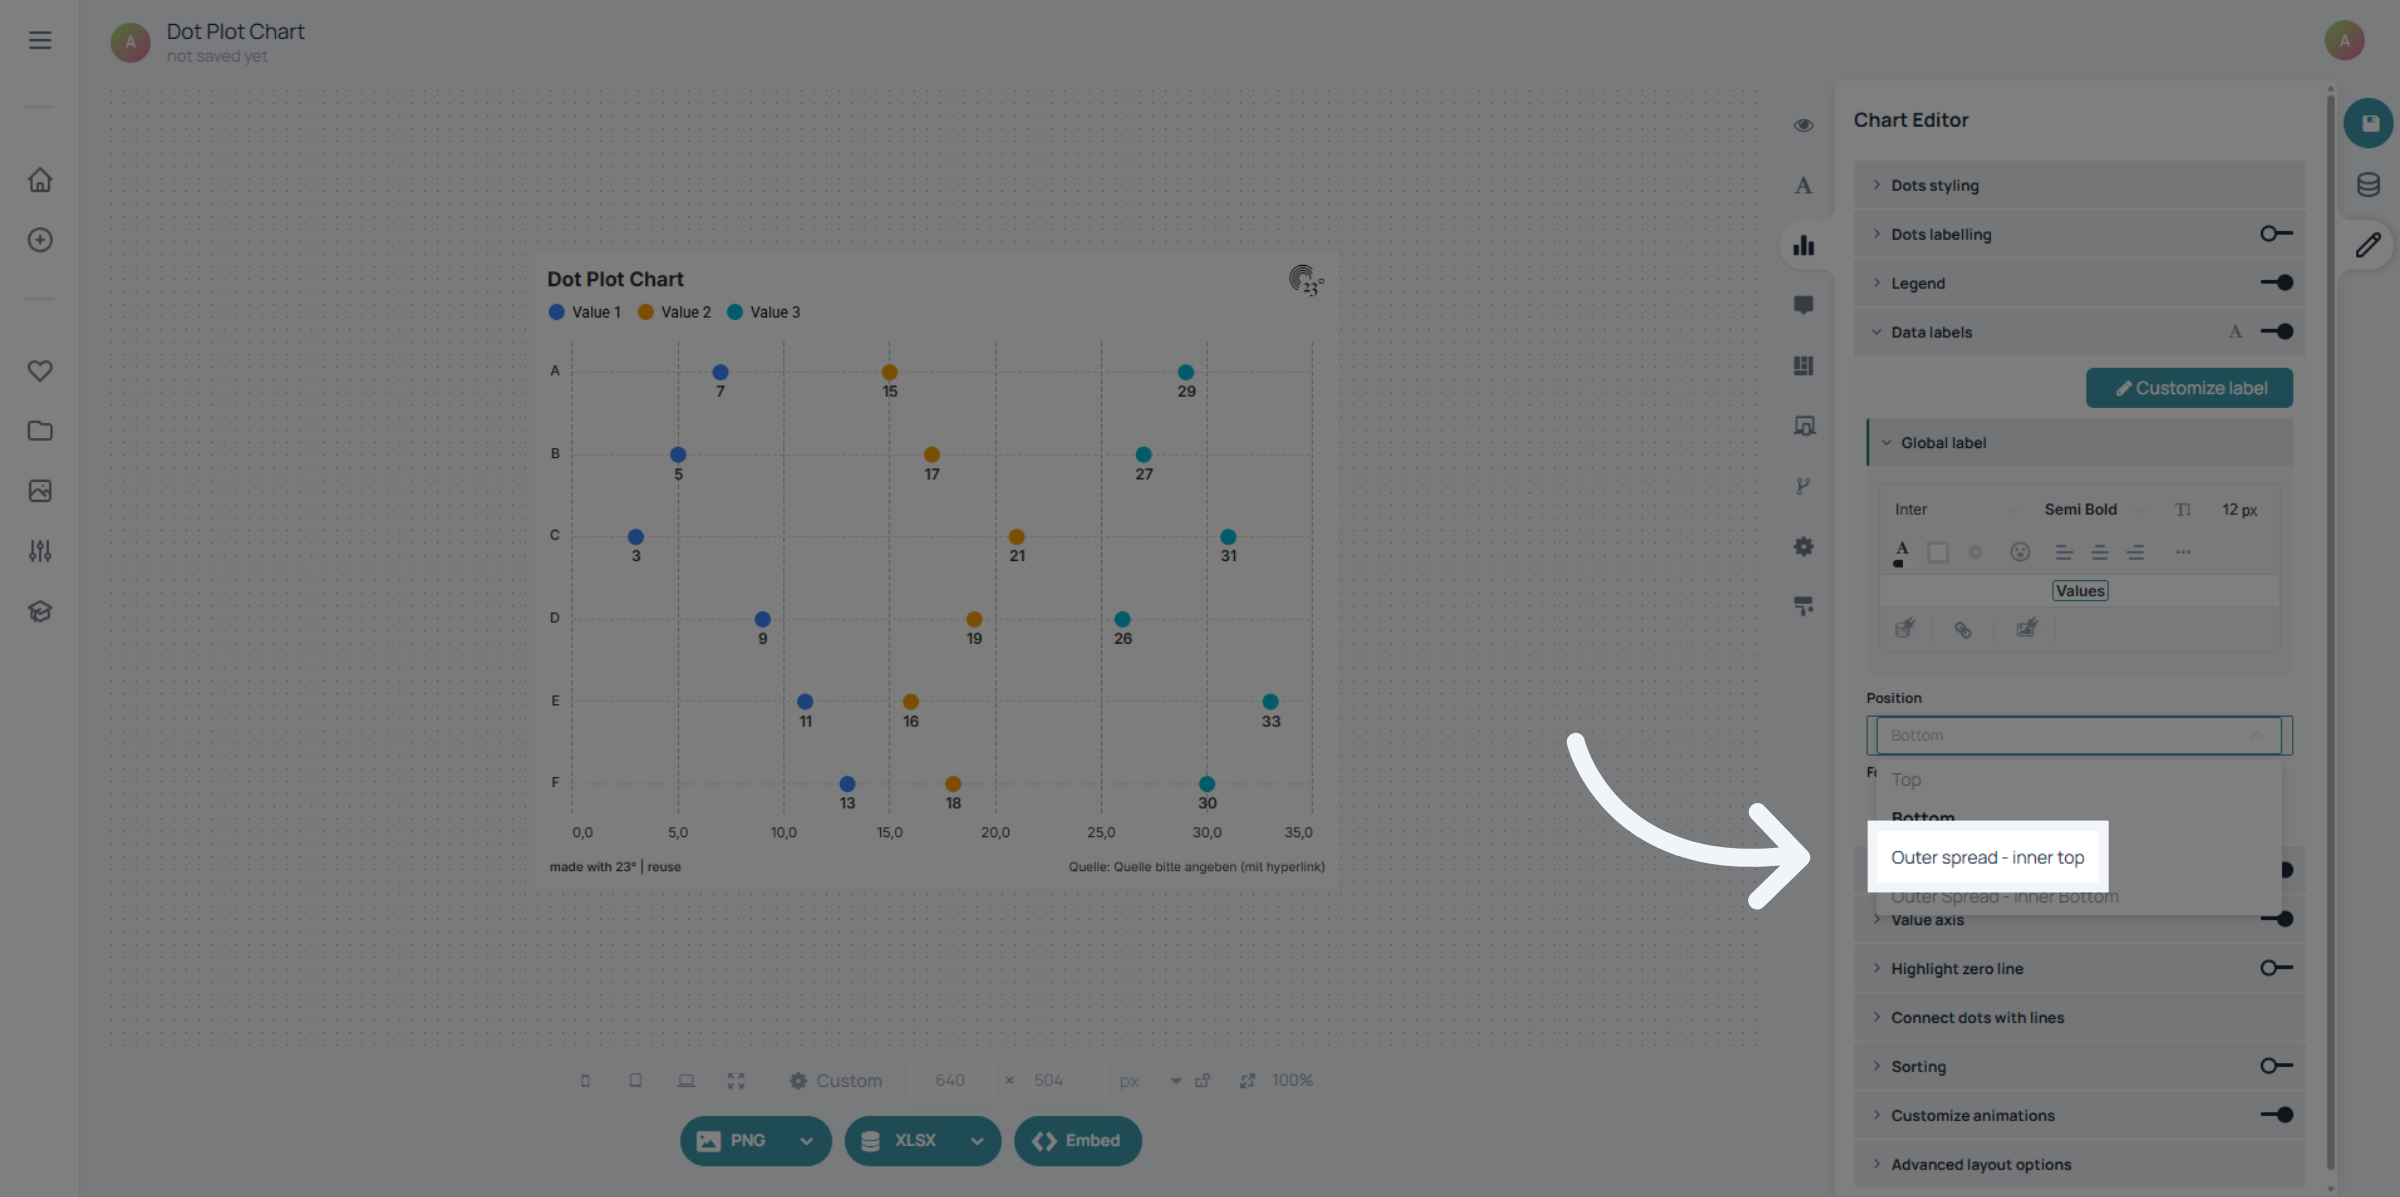
Here you can see what it looks like.
Click here to access label spread options once more.
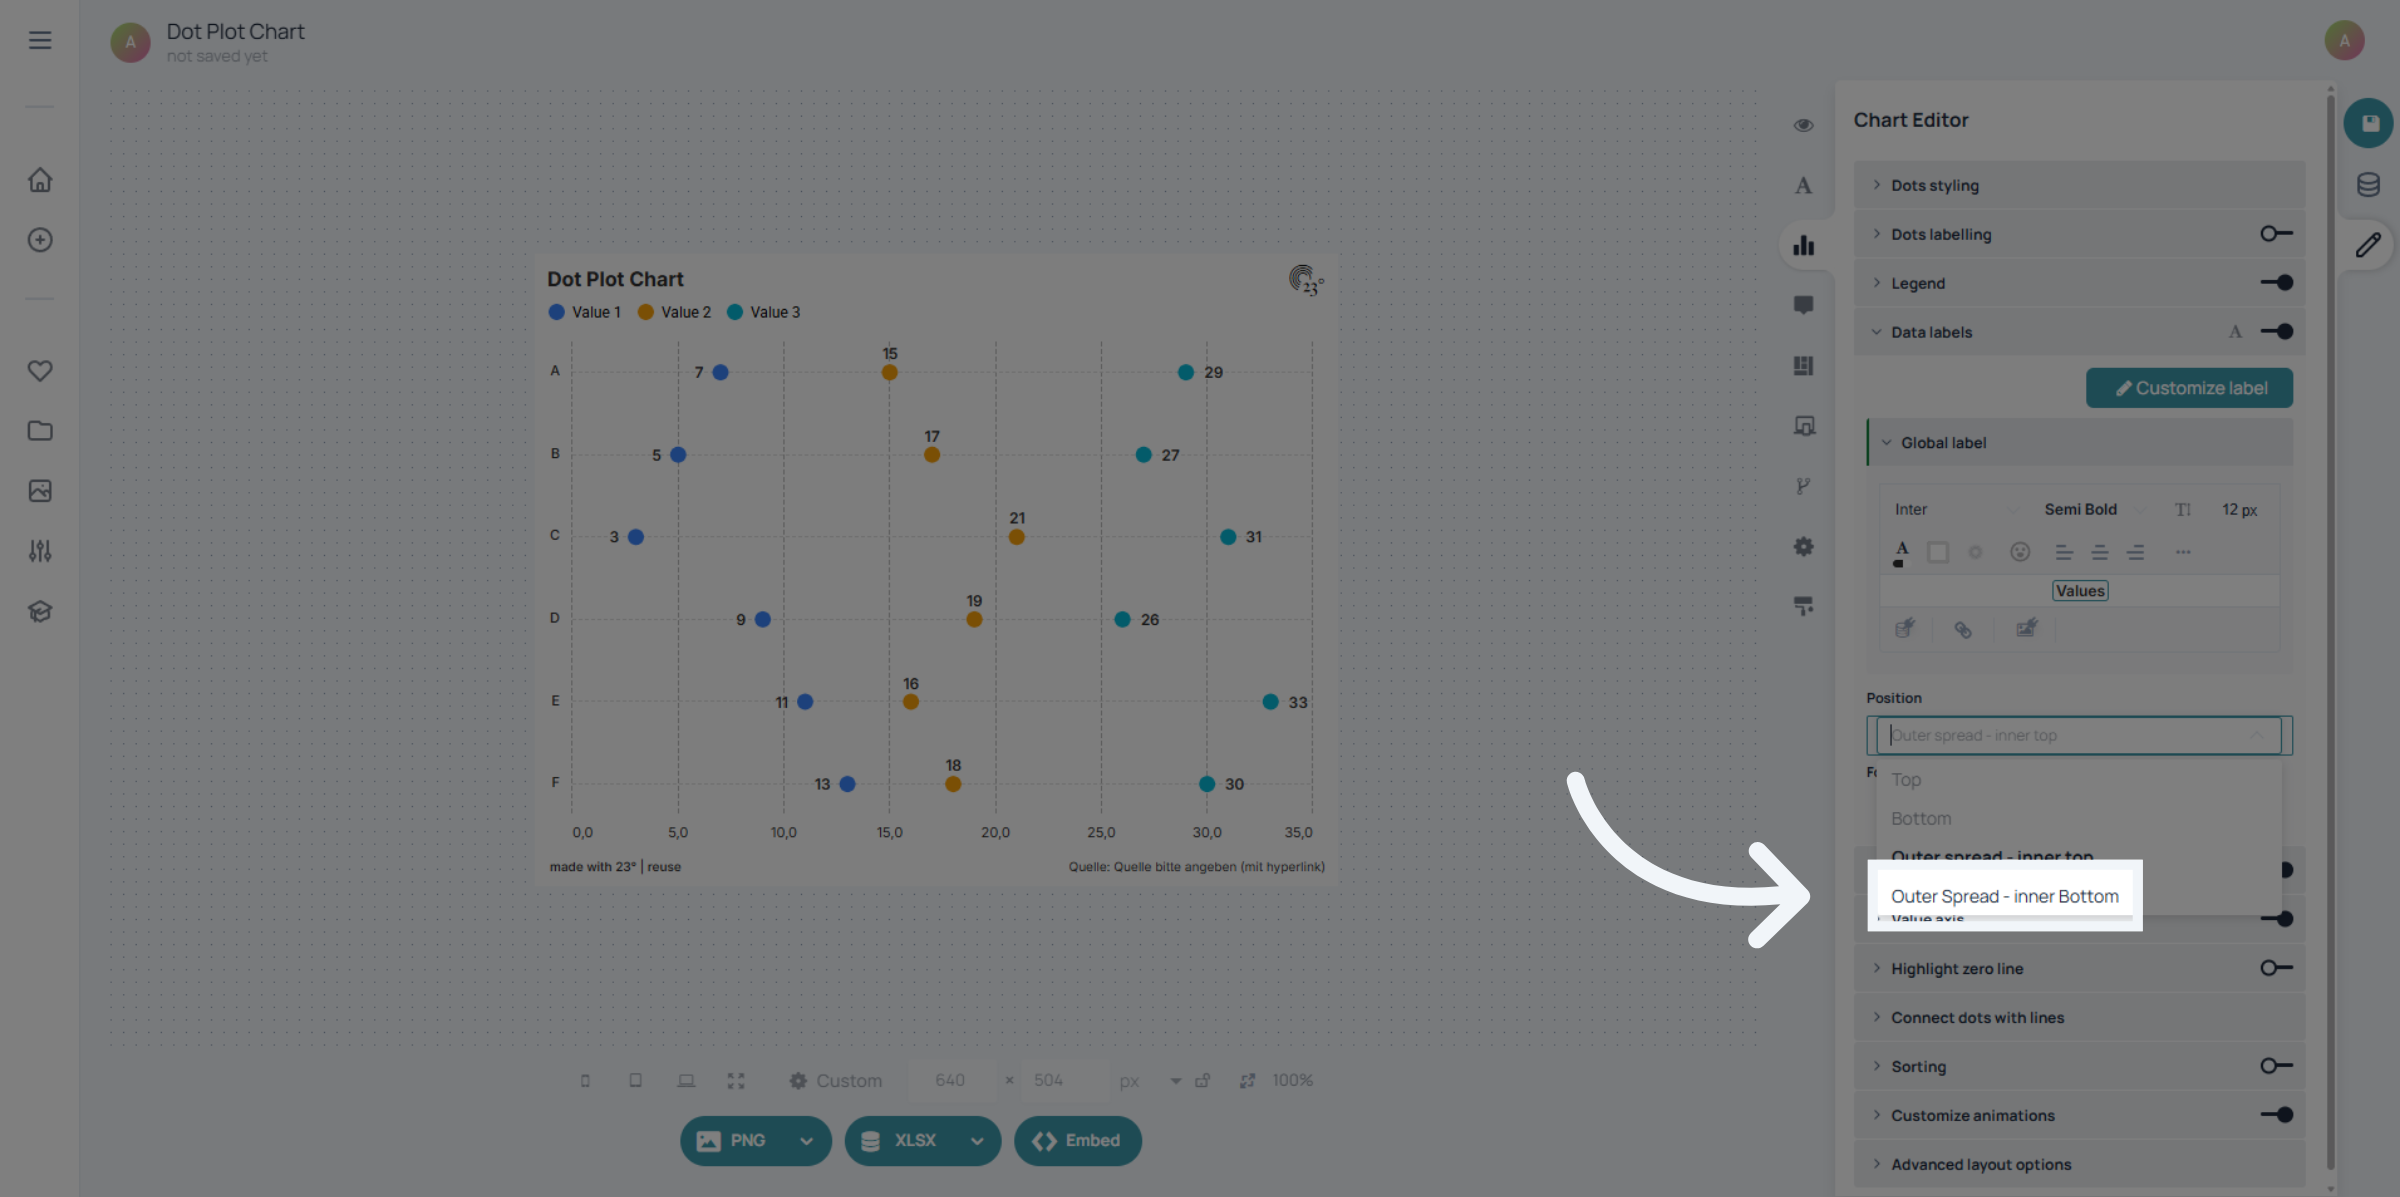
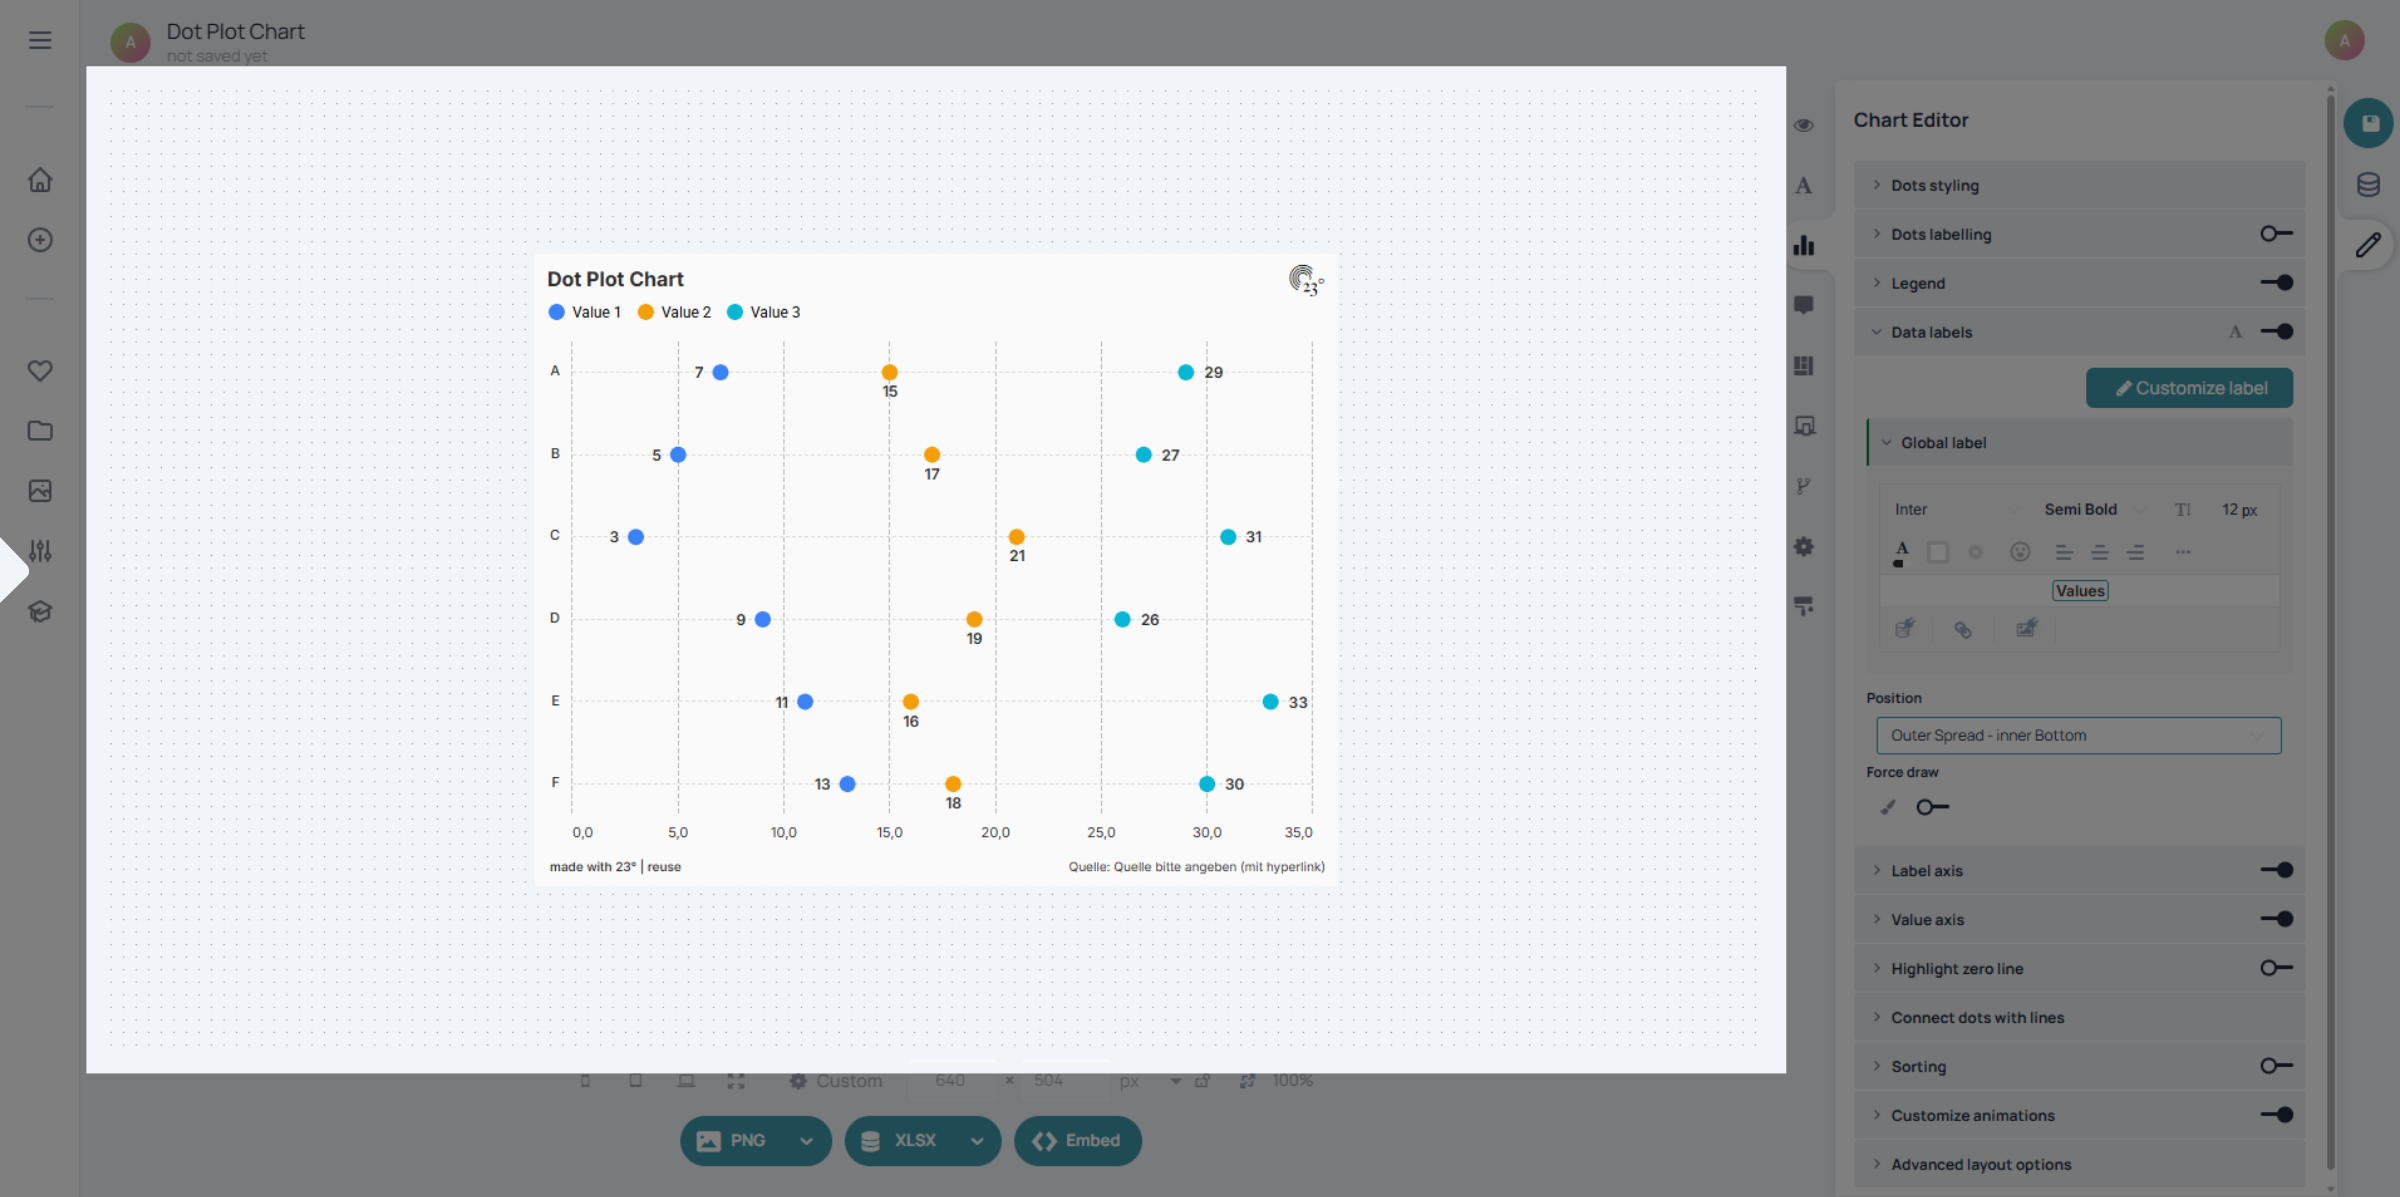
Click Outer Spread - inner Bottom if you want the outer labels on the side and the inner ones below the dots.
And thats what this option looks like.
You have successfully configured the value display settings for your dot plot in 23degrees. Check out other chart tutorials for more insights.