How the dataset of a Fan Chart should be structured
This tutorial explains the required dataset structure for creating a Fan Chart
1. Columns
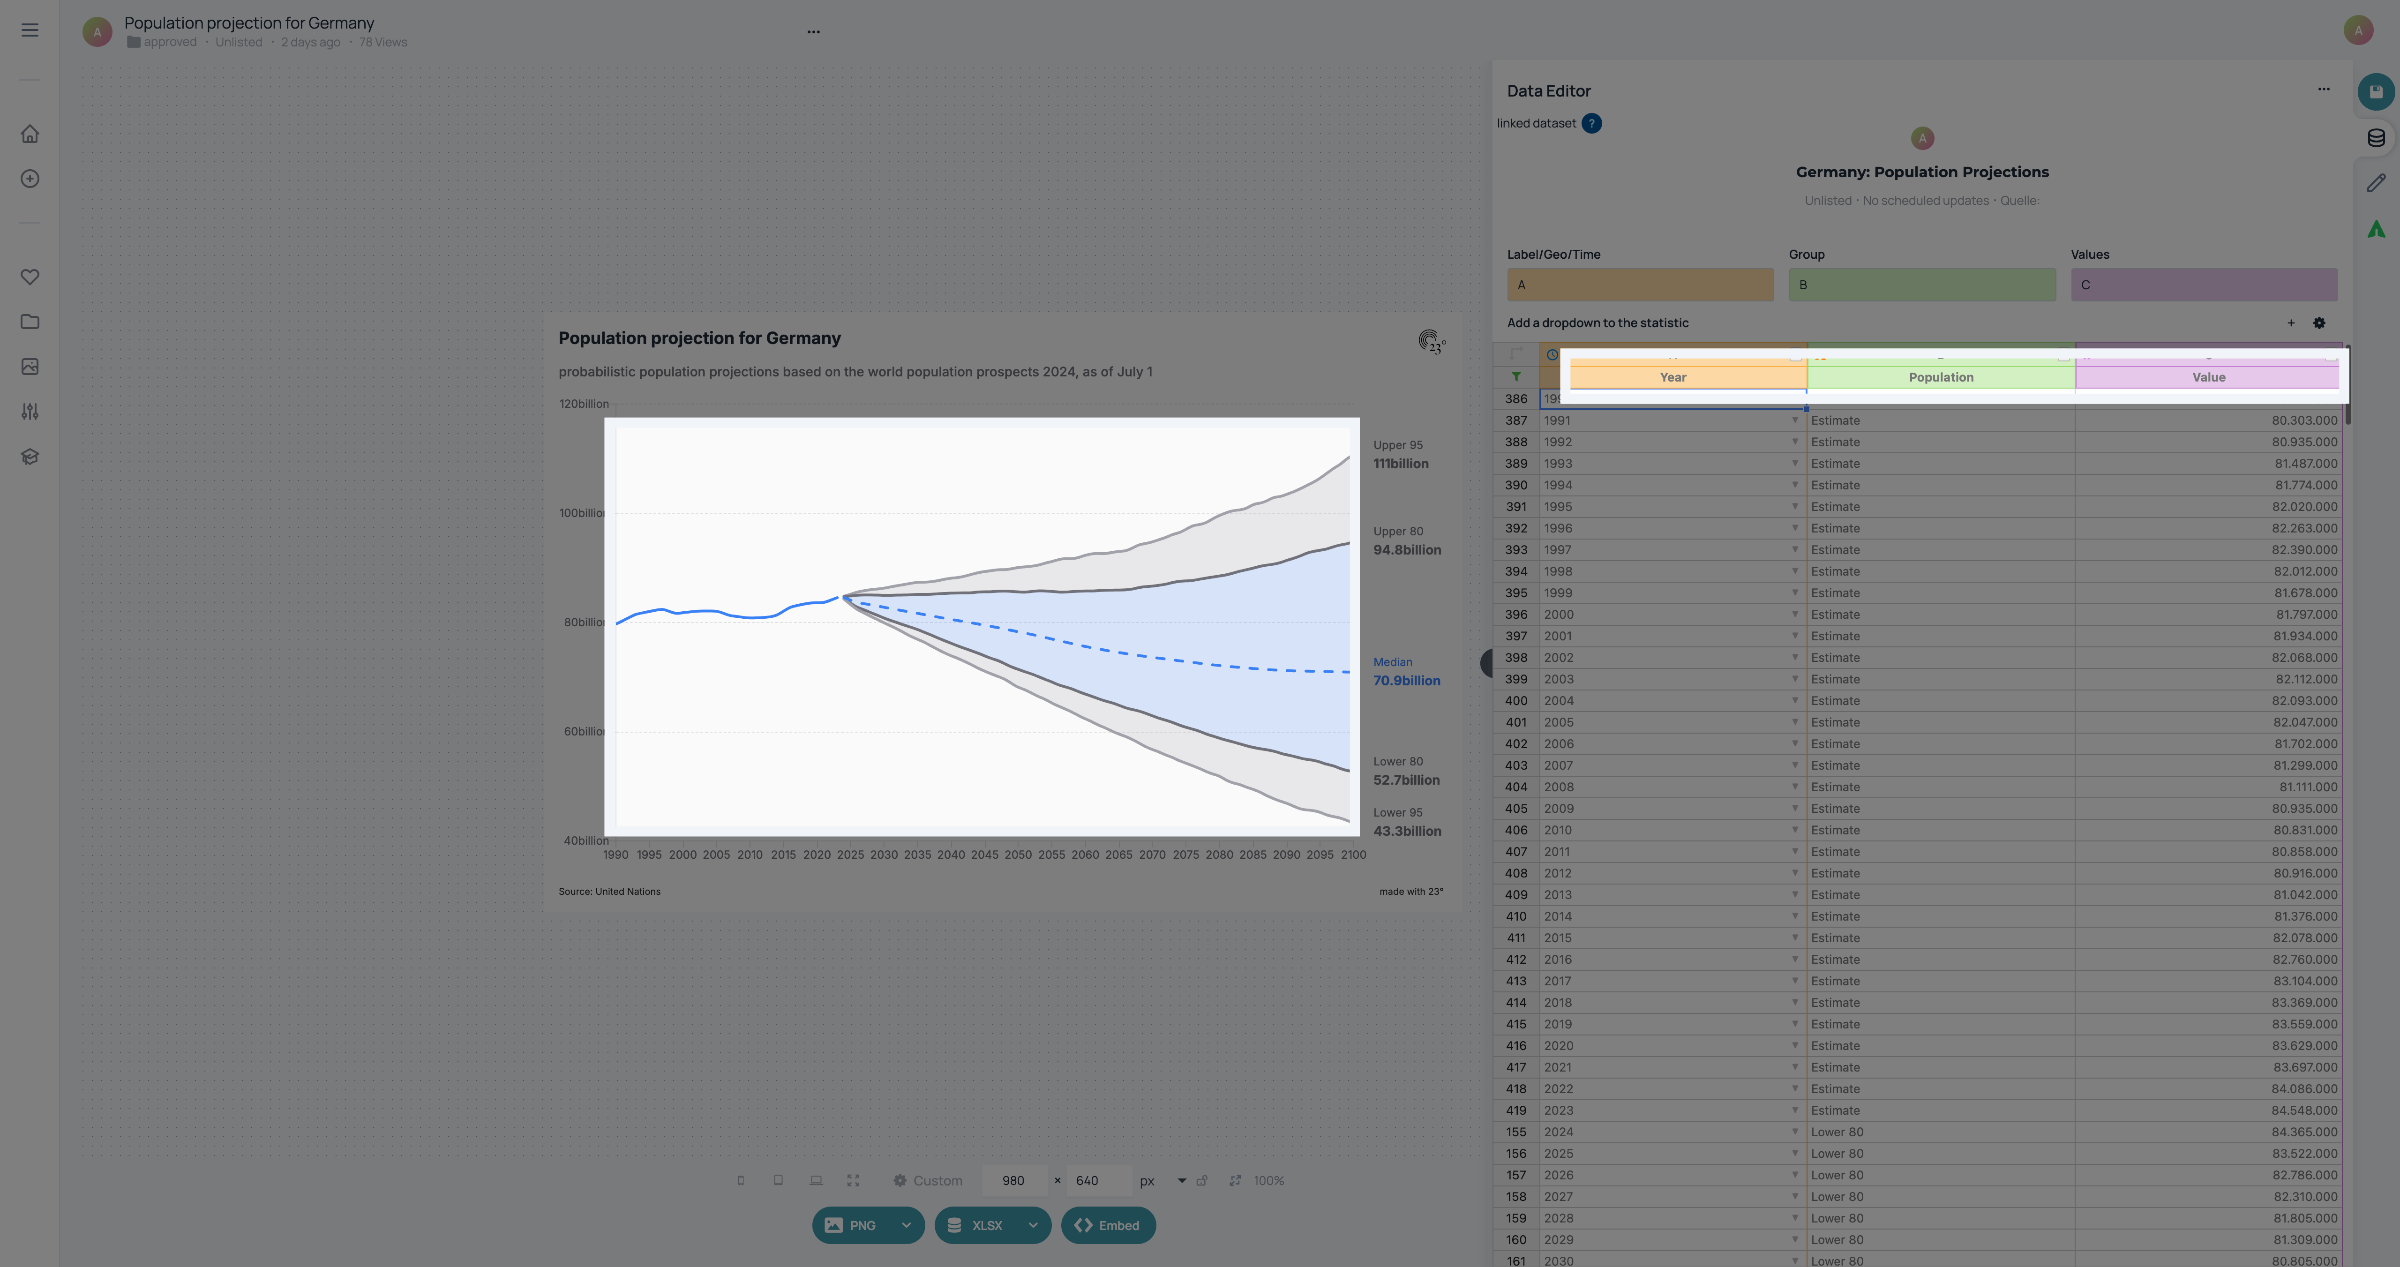
To create a linechart like this, you will need a dataset with three columns: One for the year, one for the group that doubles as the labels of the lines, and one for the values.
2. Single line
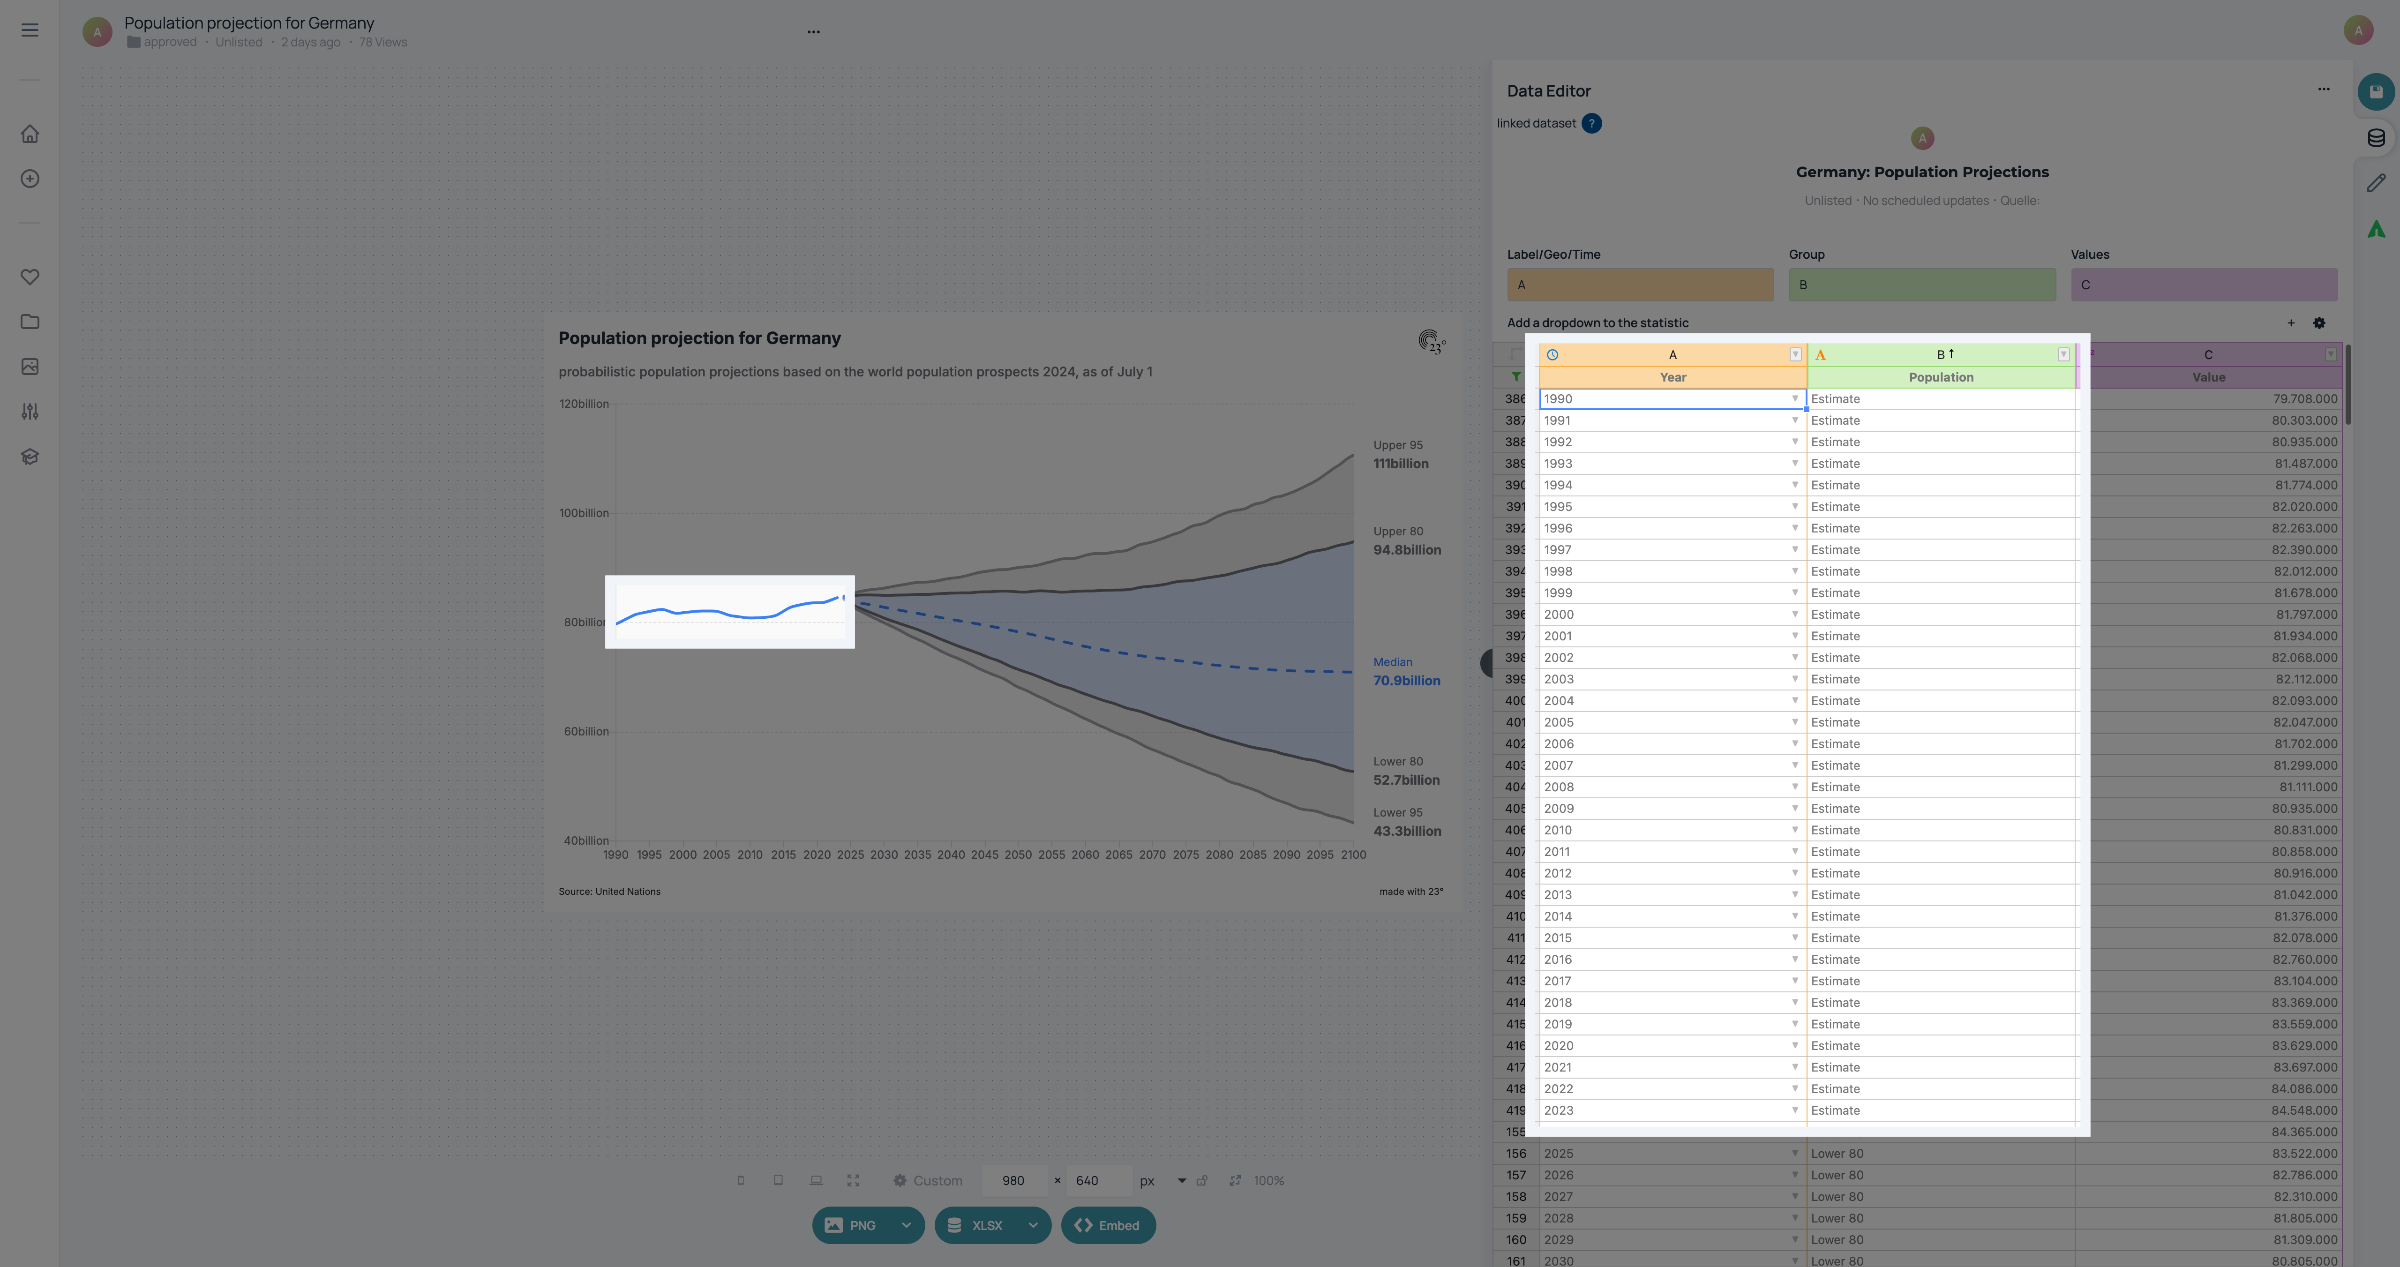
For the starting of the line, you will need only one value for every year. In this case, it's the years from 1990 to 2023.
3. Fan Chart
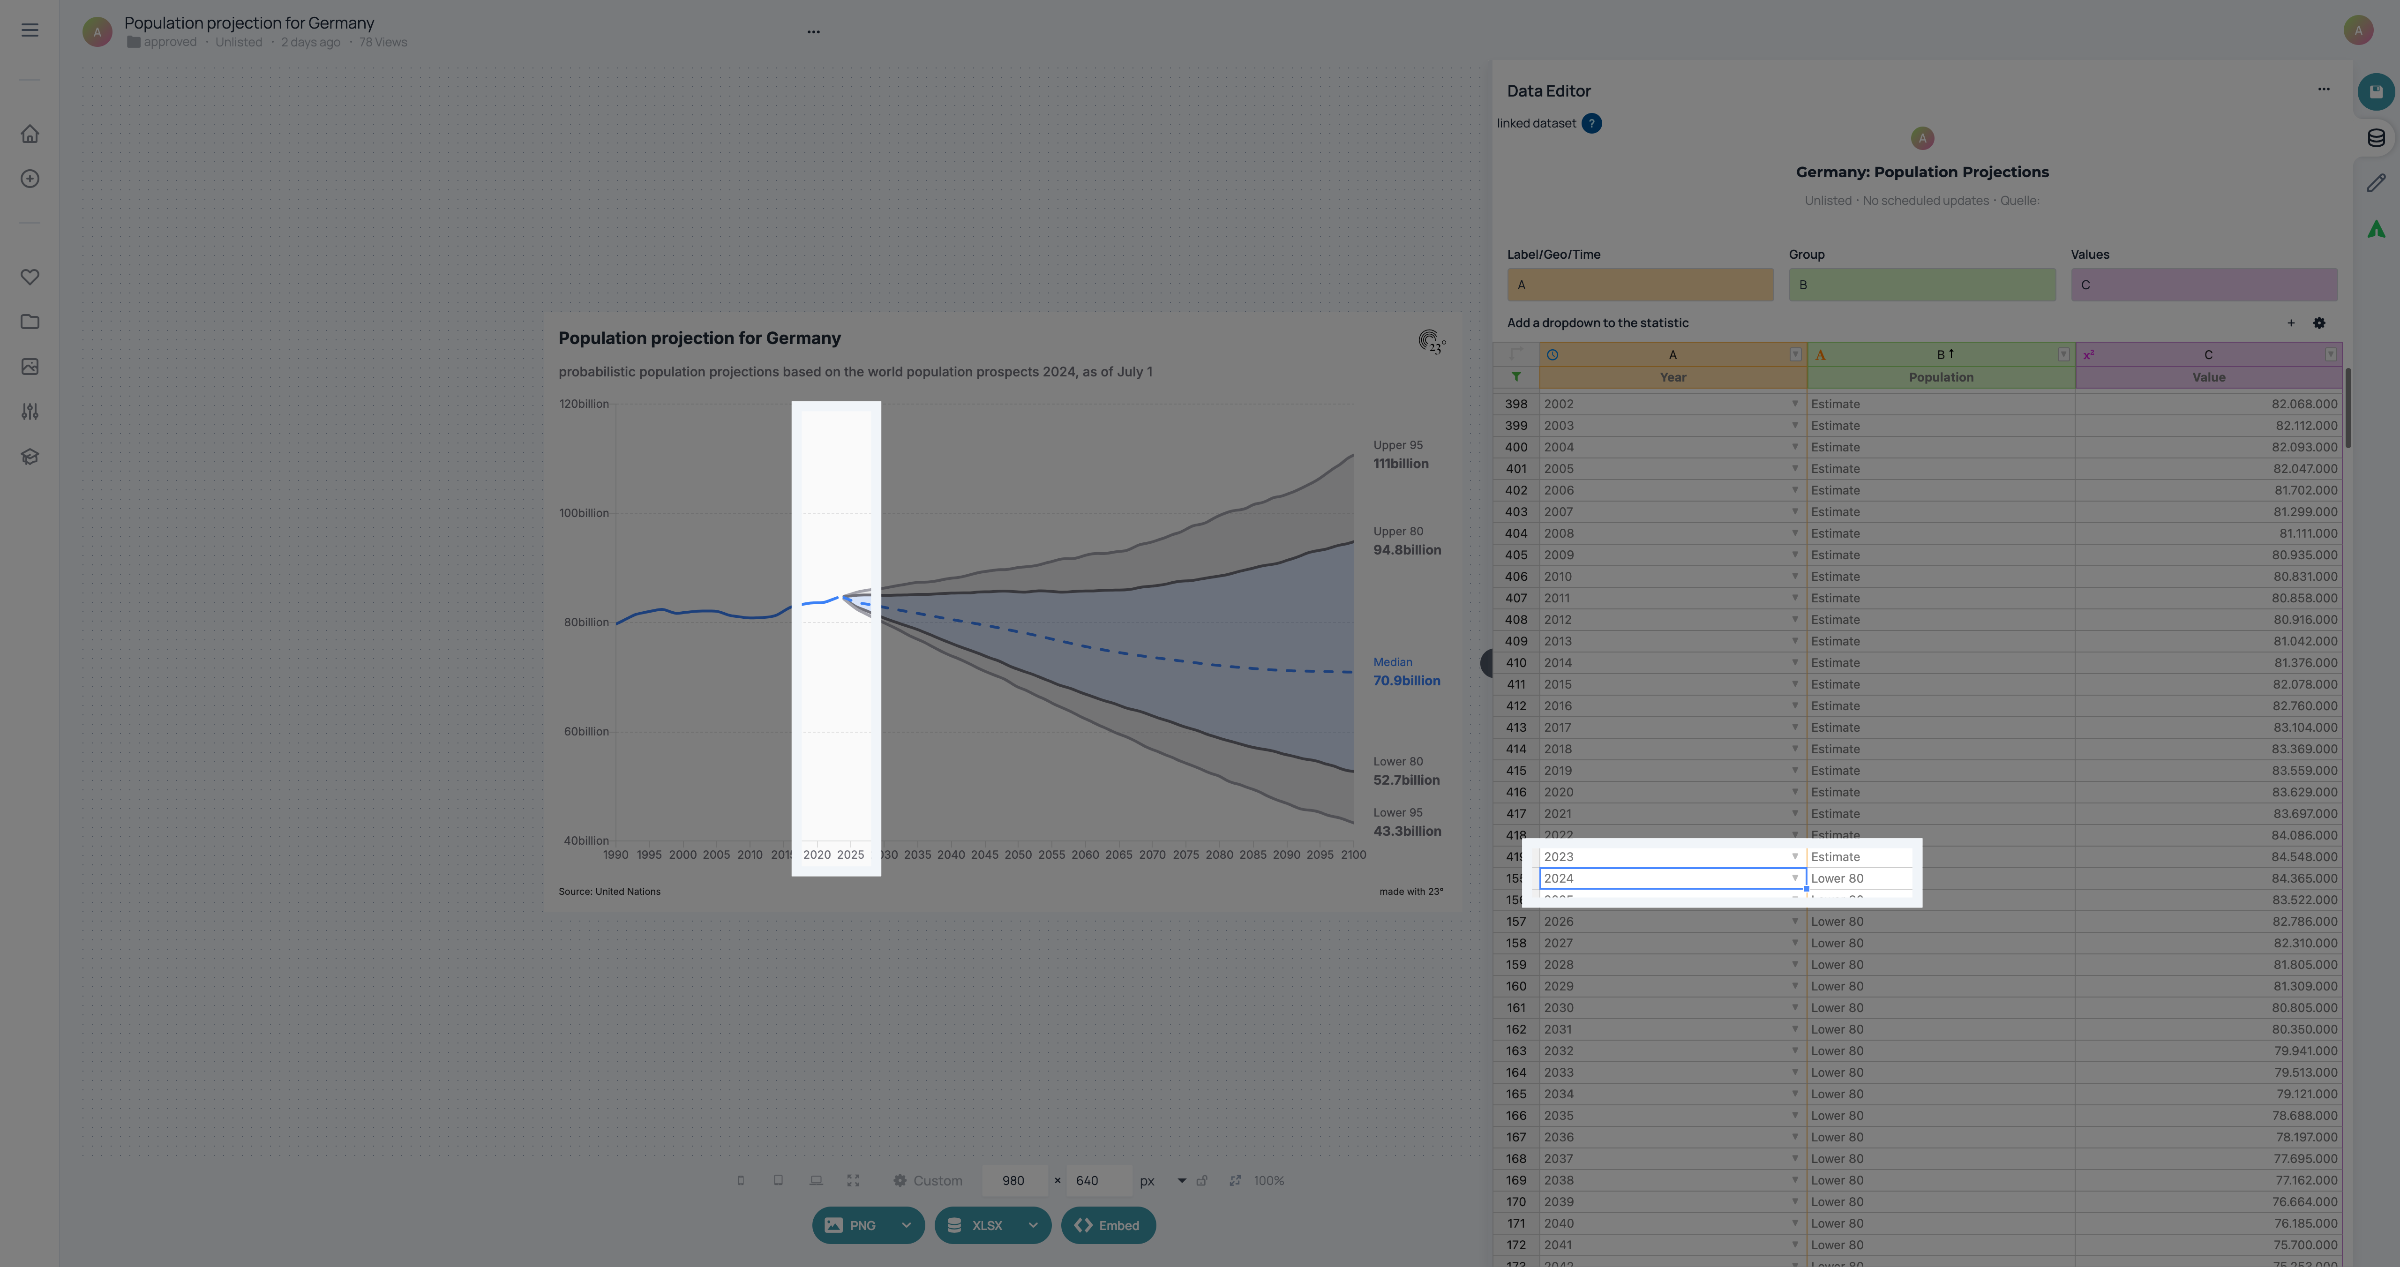
From 2024 on, the line splits up into several lines. This means that from here on, you will need multiple values for every year. In this case, there are four groups with the same years and different values.
4. Fan Chart
Each of them starts in the year 2024 and goes to 2100.
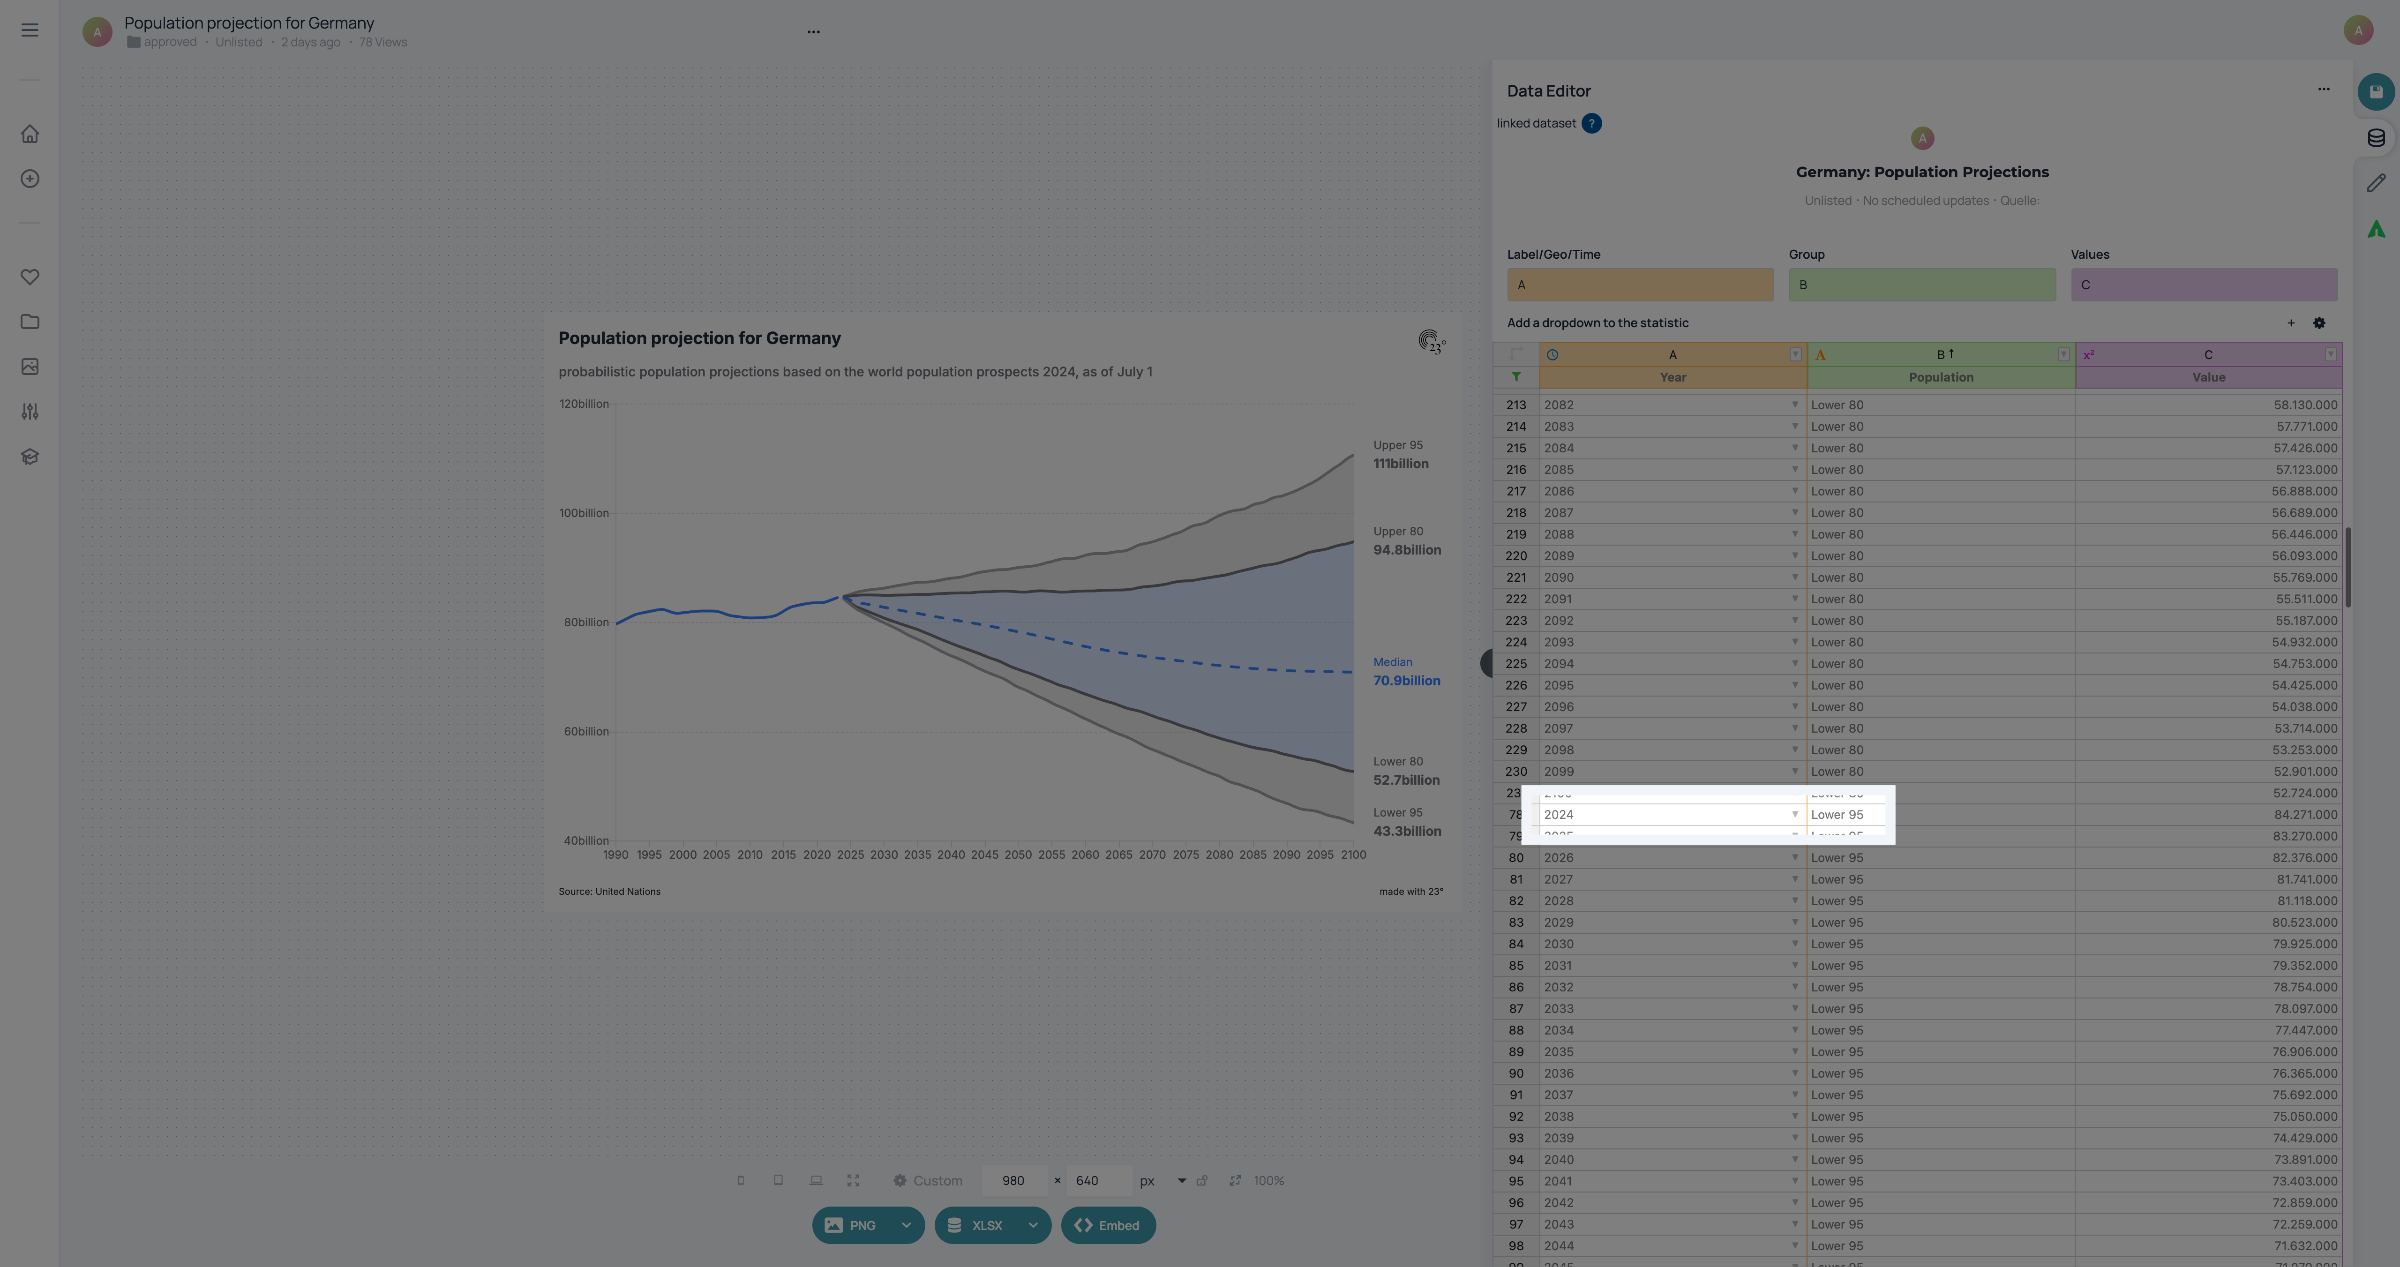
Make sure your dataset looks like this, and you have successfully structured it to create a Fan Chart.