How to change the format of time datafields
This tutorial explains how to customize the display formats of date and time data fields.
1. Check your dataset
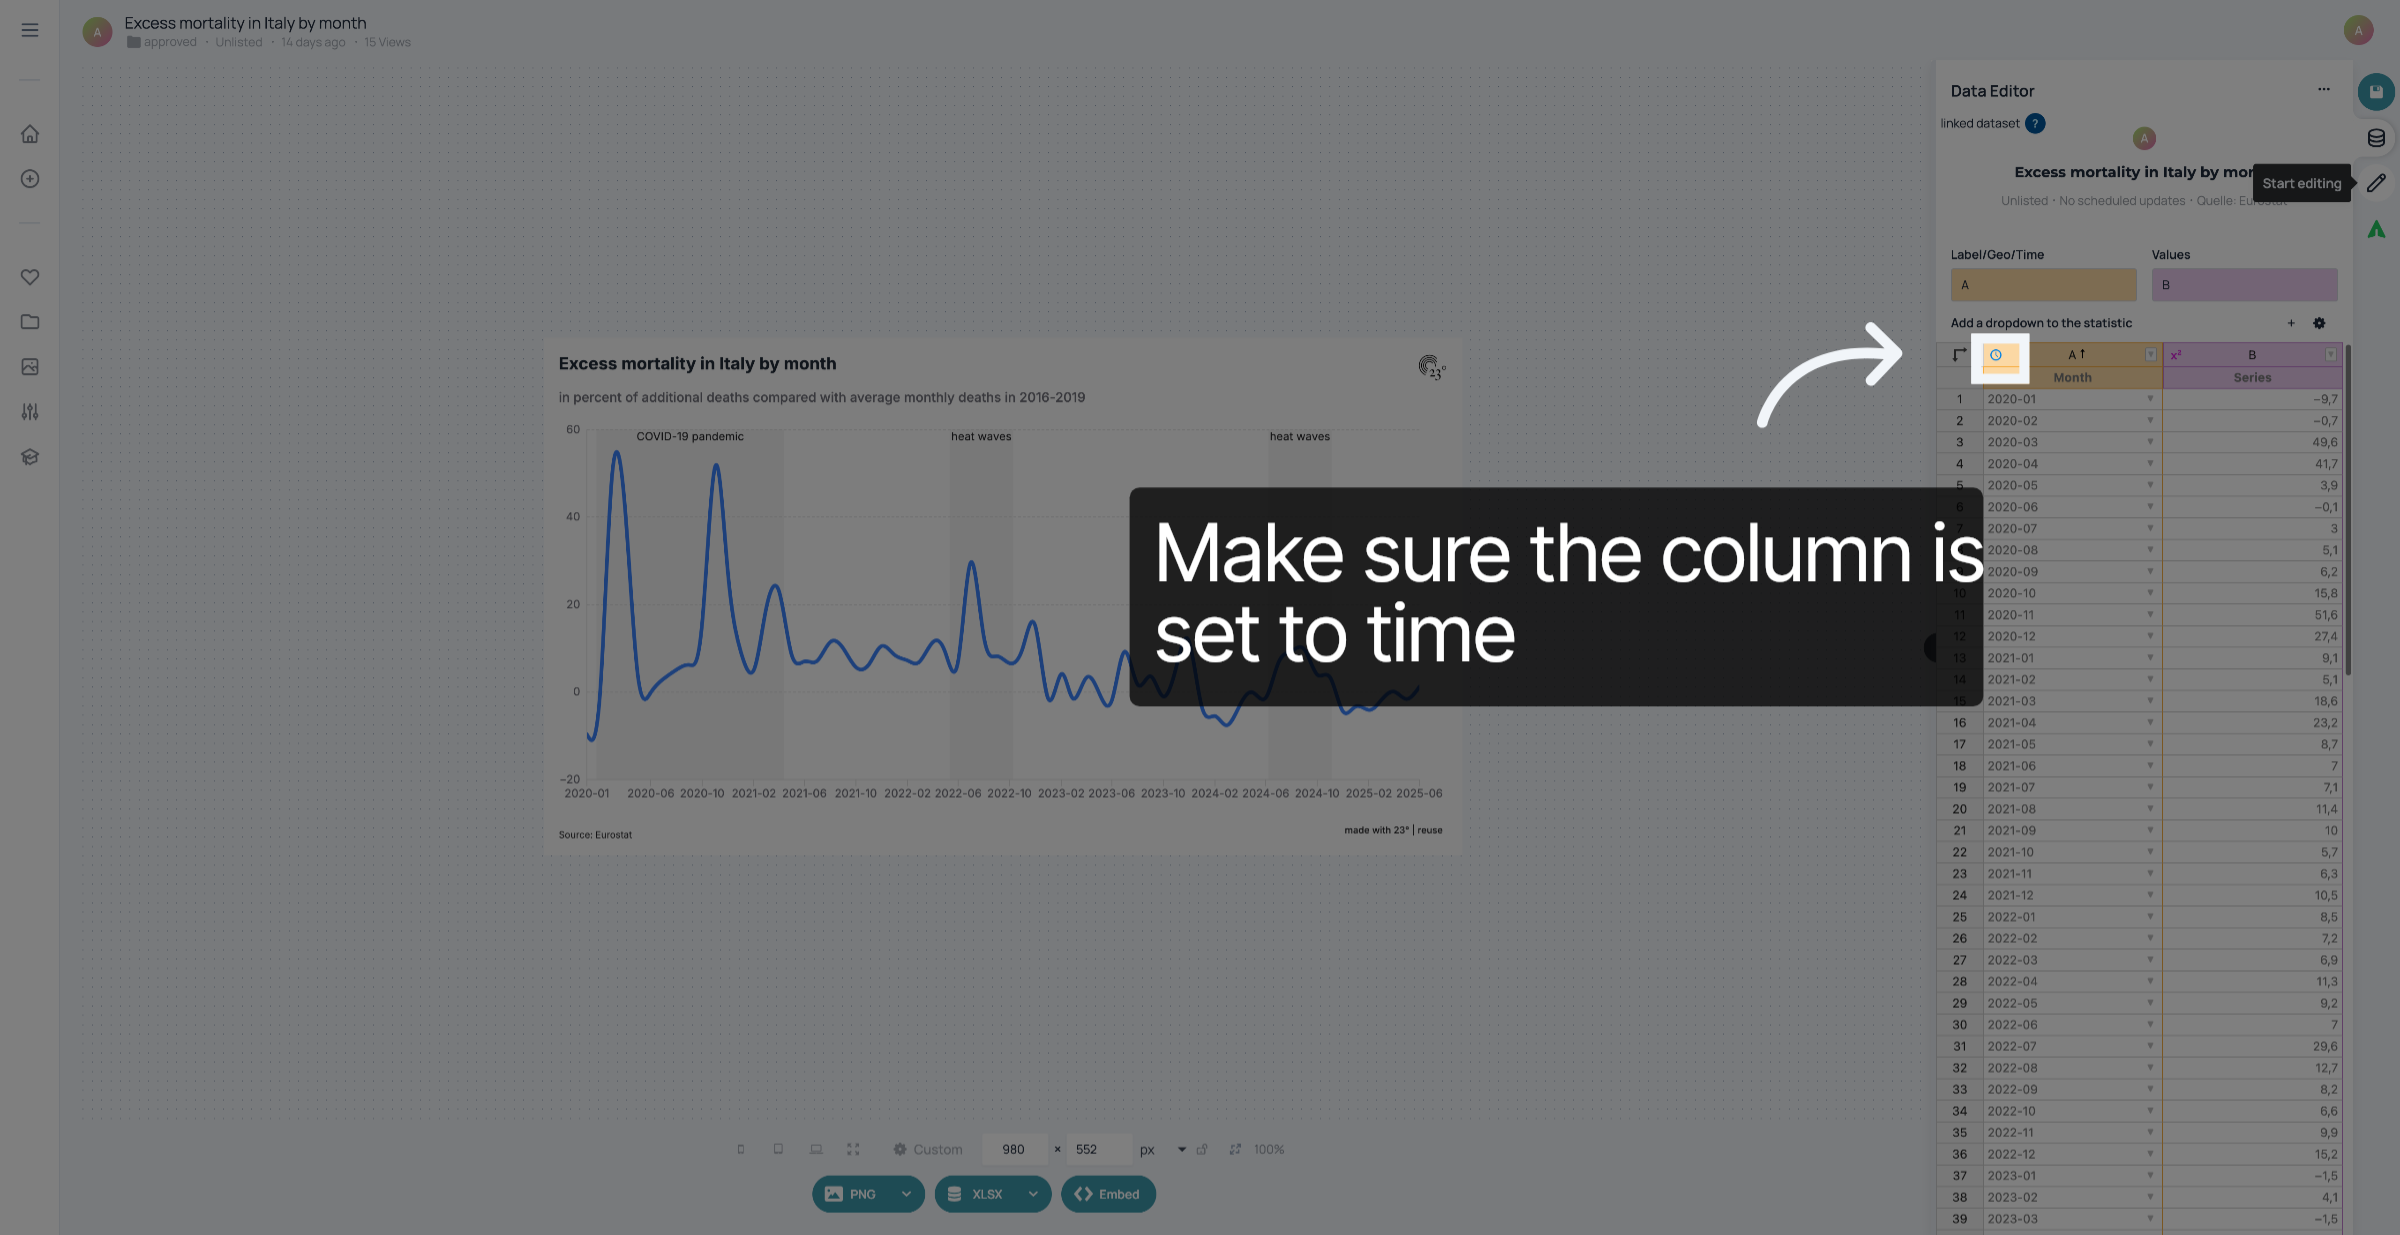
First of all, make sure the date column is set to Time. Time columns are displayed with a blue clock symbol at the top. If your date column is set to a value or text column instead, you can click on the symbol and switch to Time.
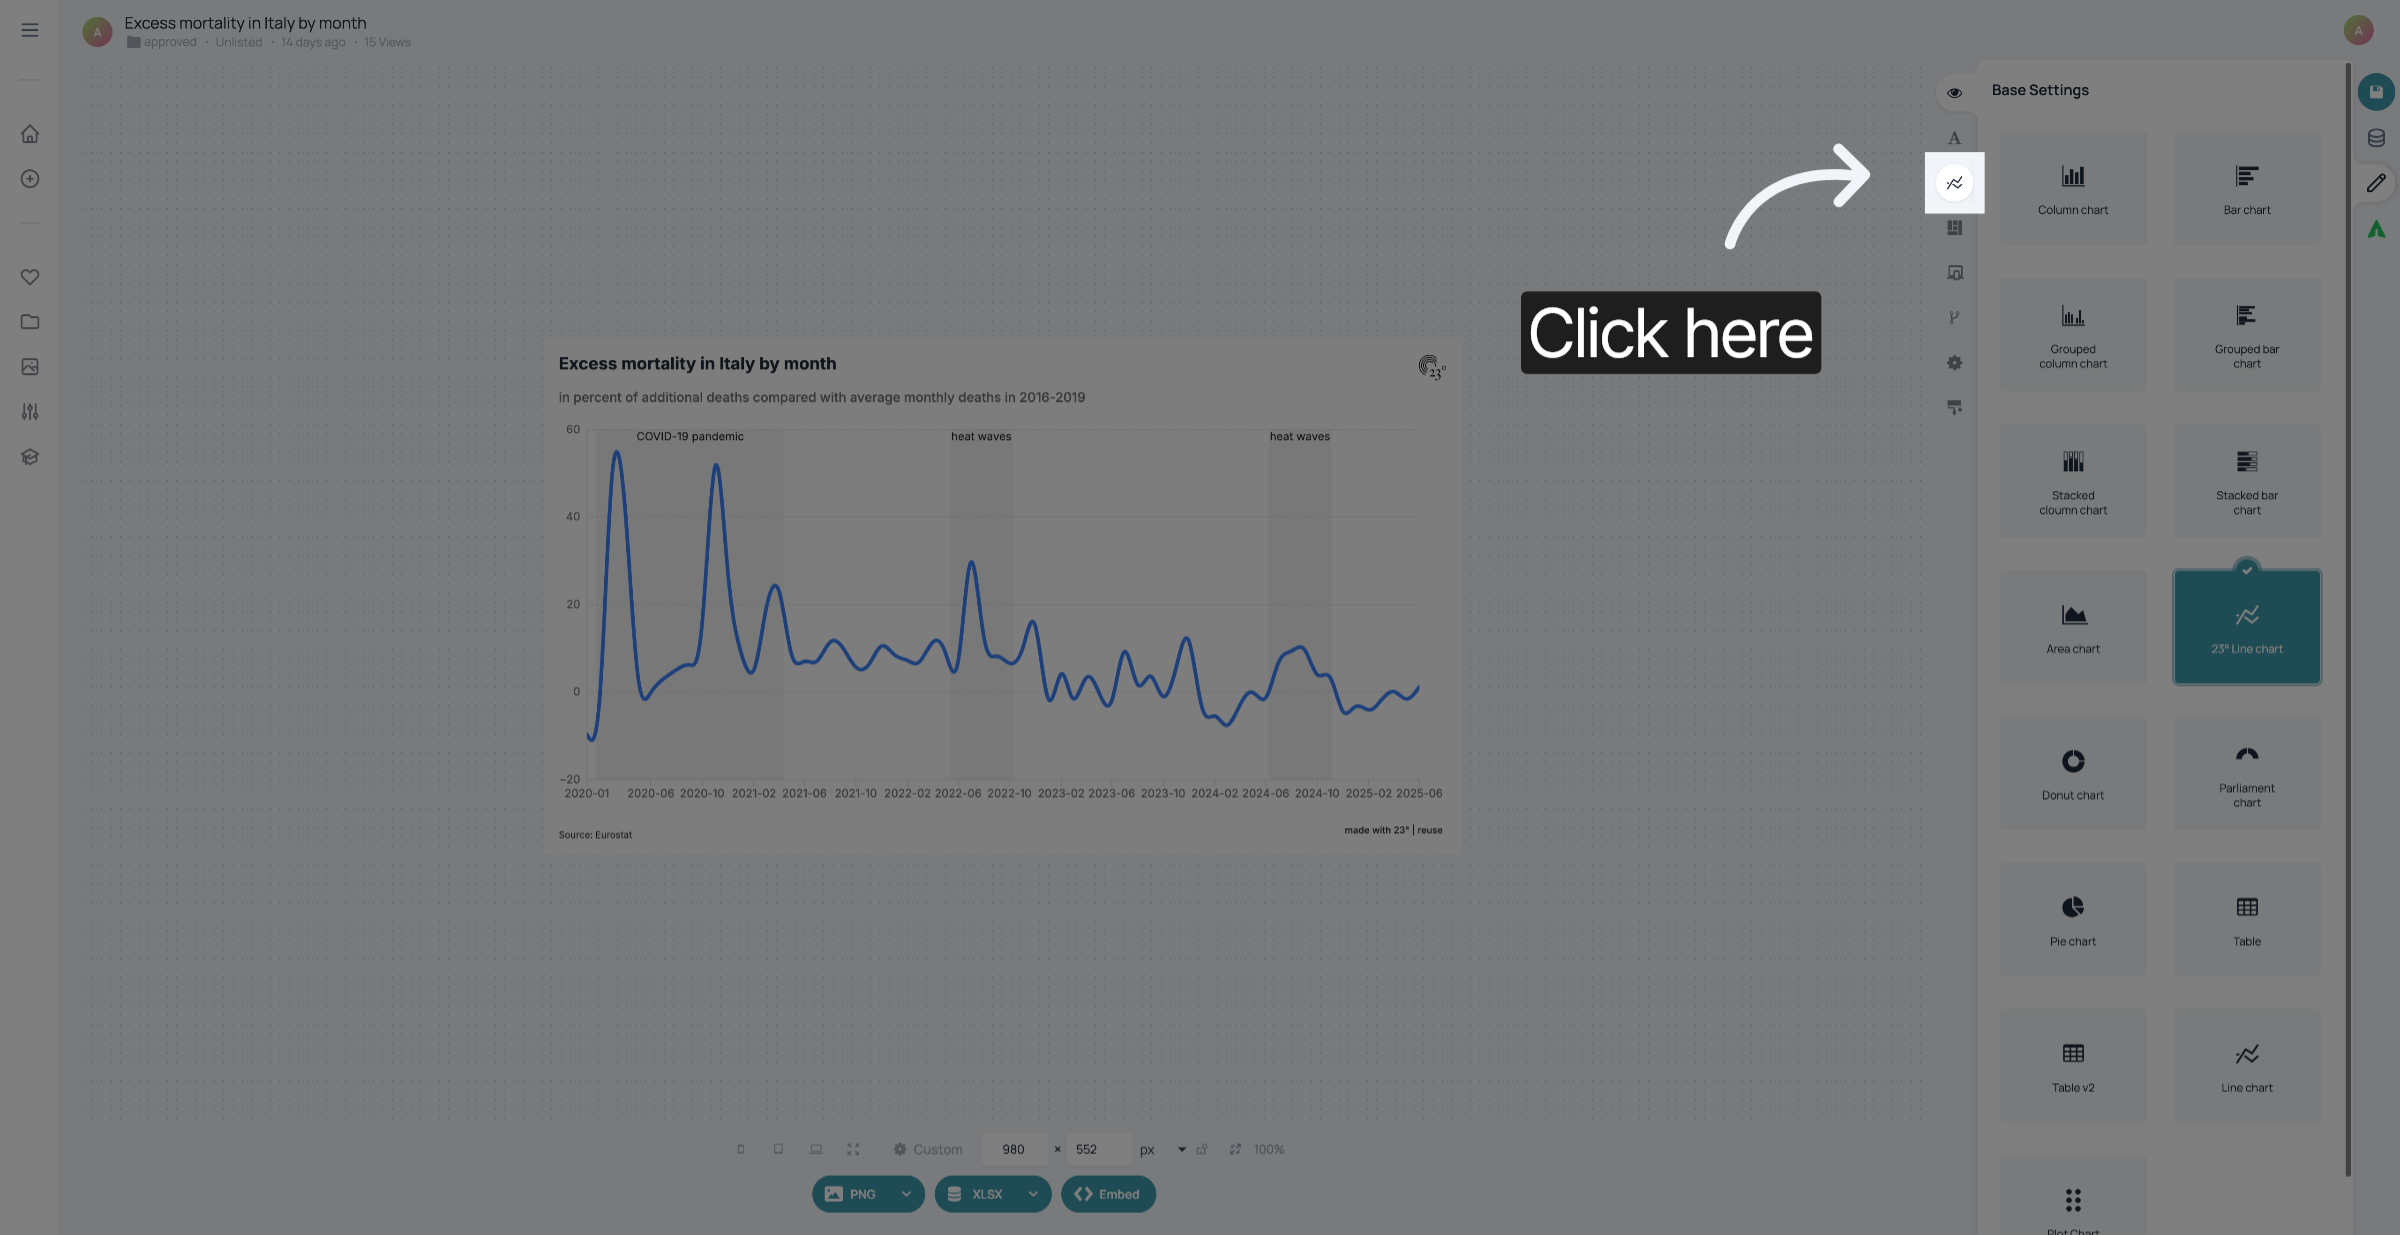
2. Go to Chart Editor
Click here to go to the chart editor.
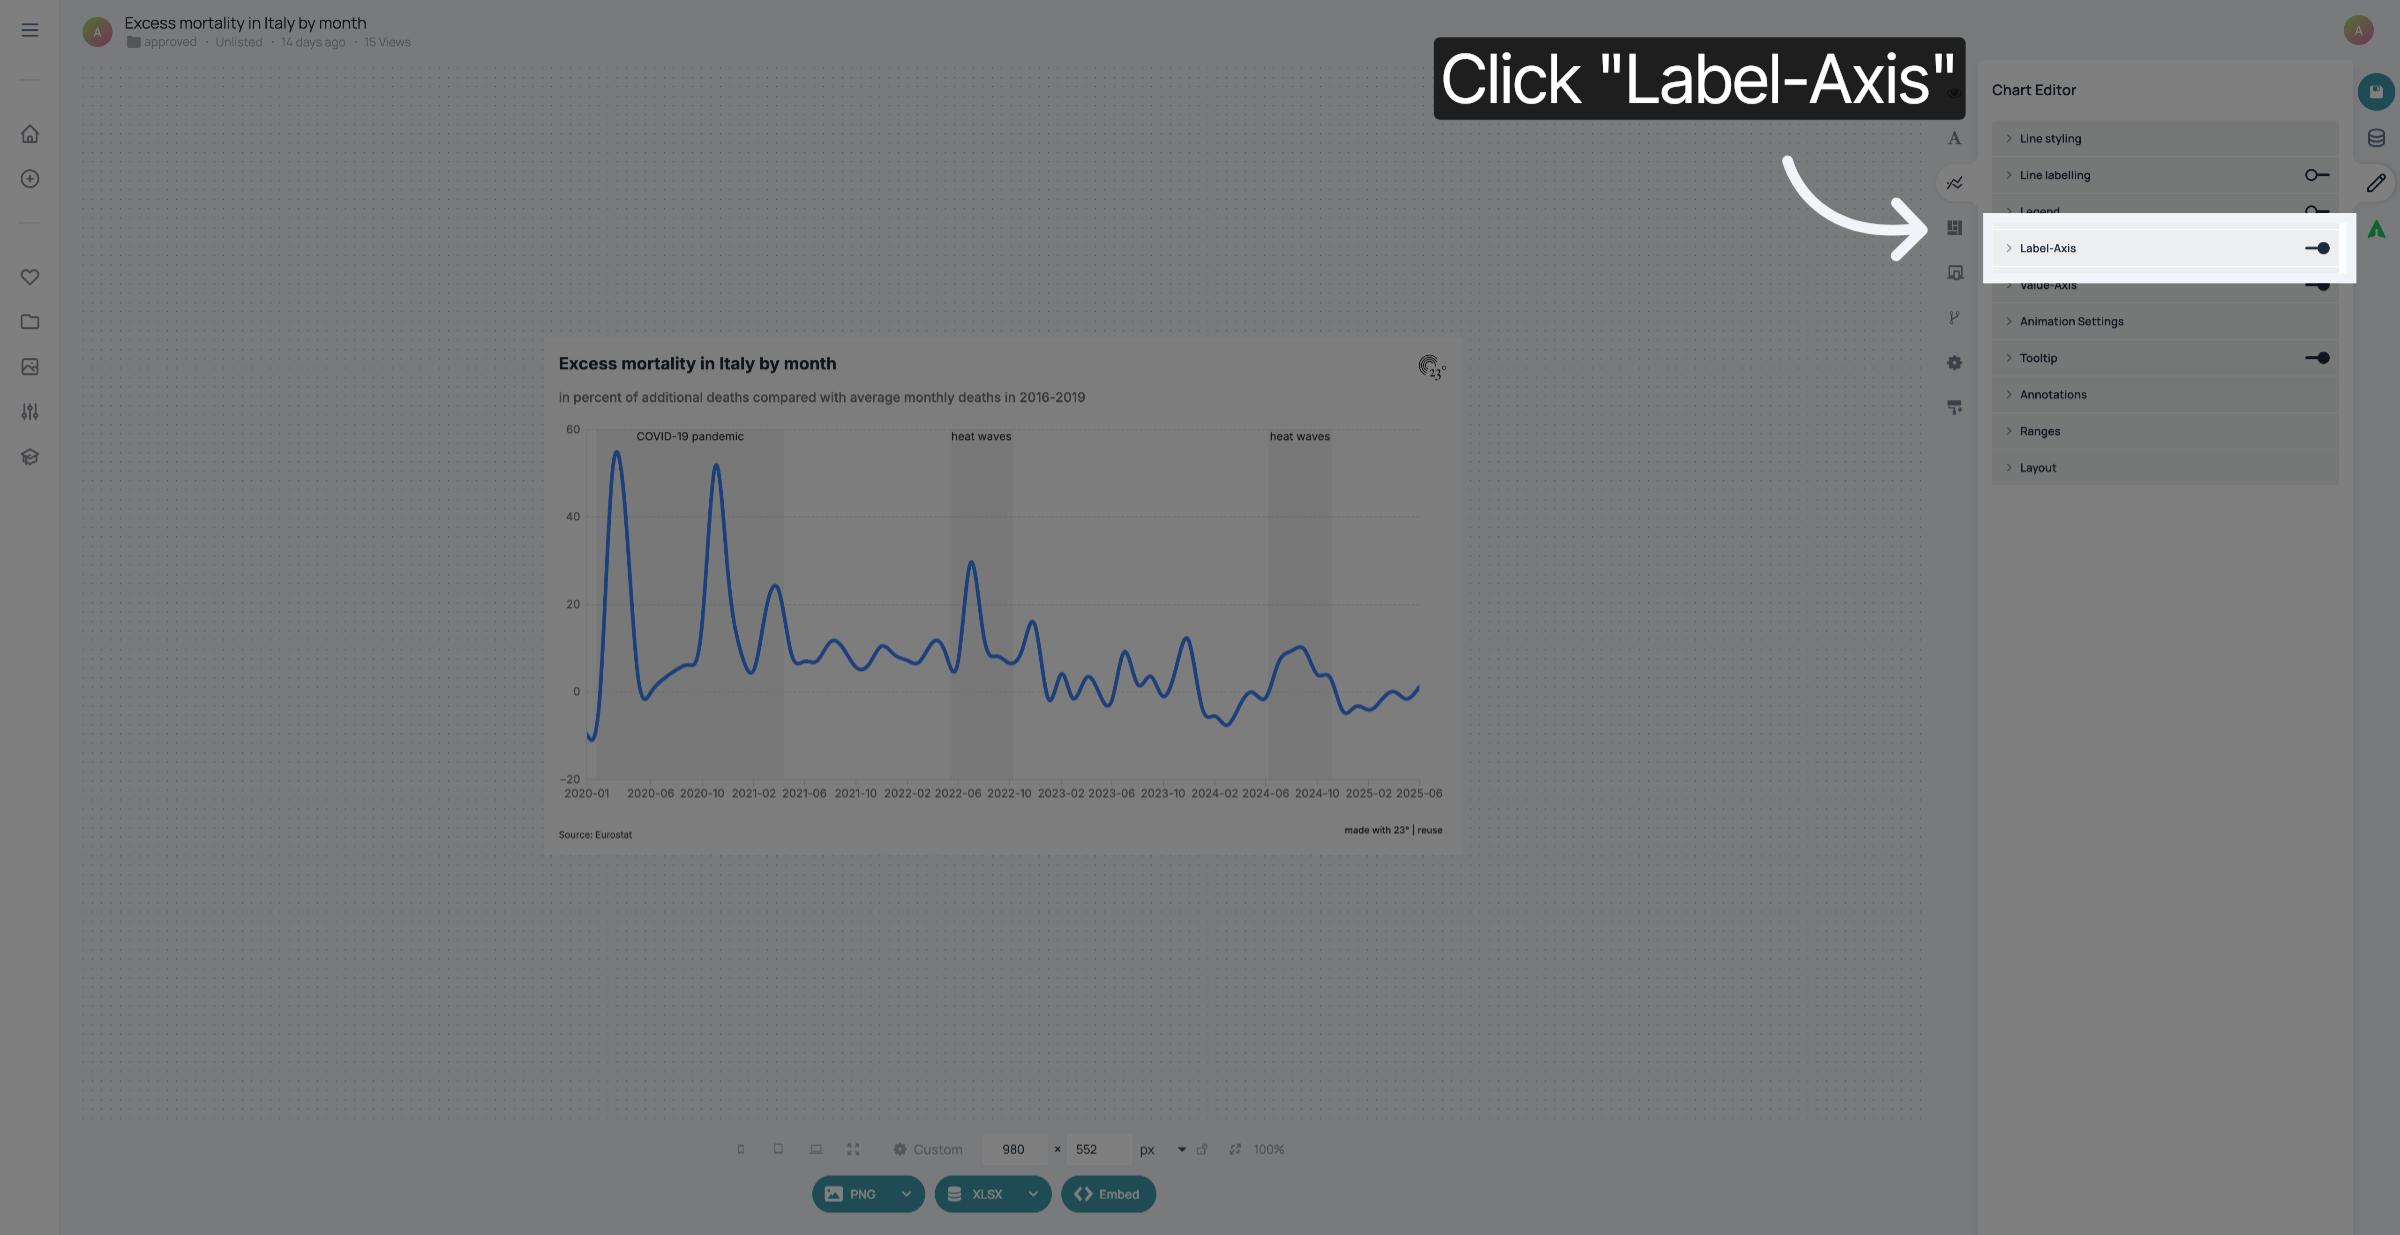
3. Click "Label-Axis"
Click "Label-Axis" to change the display of the dates in the label axis of your chart.
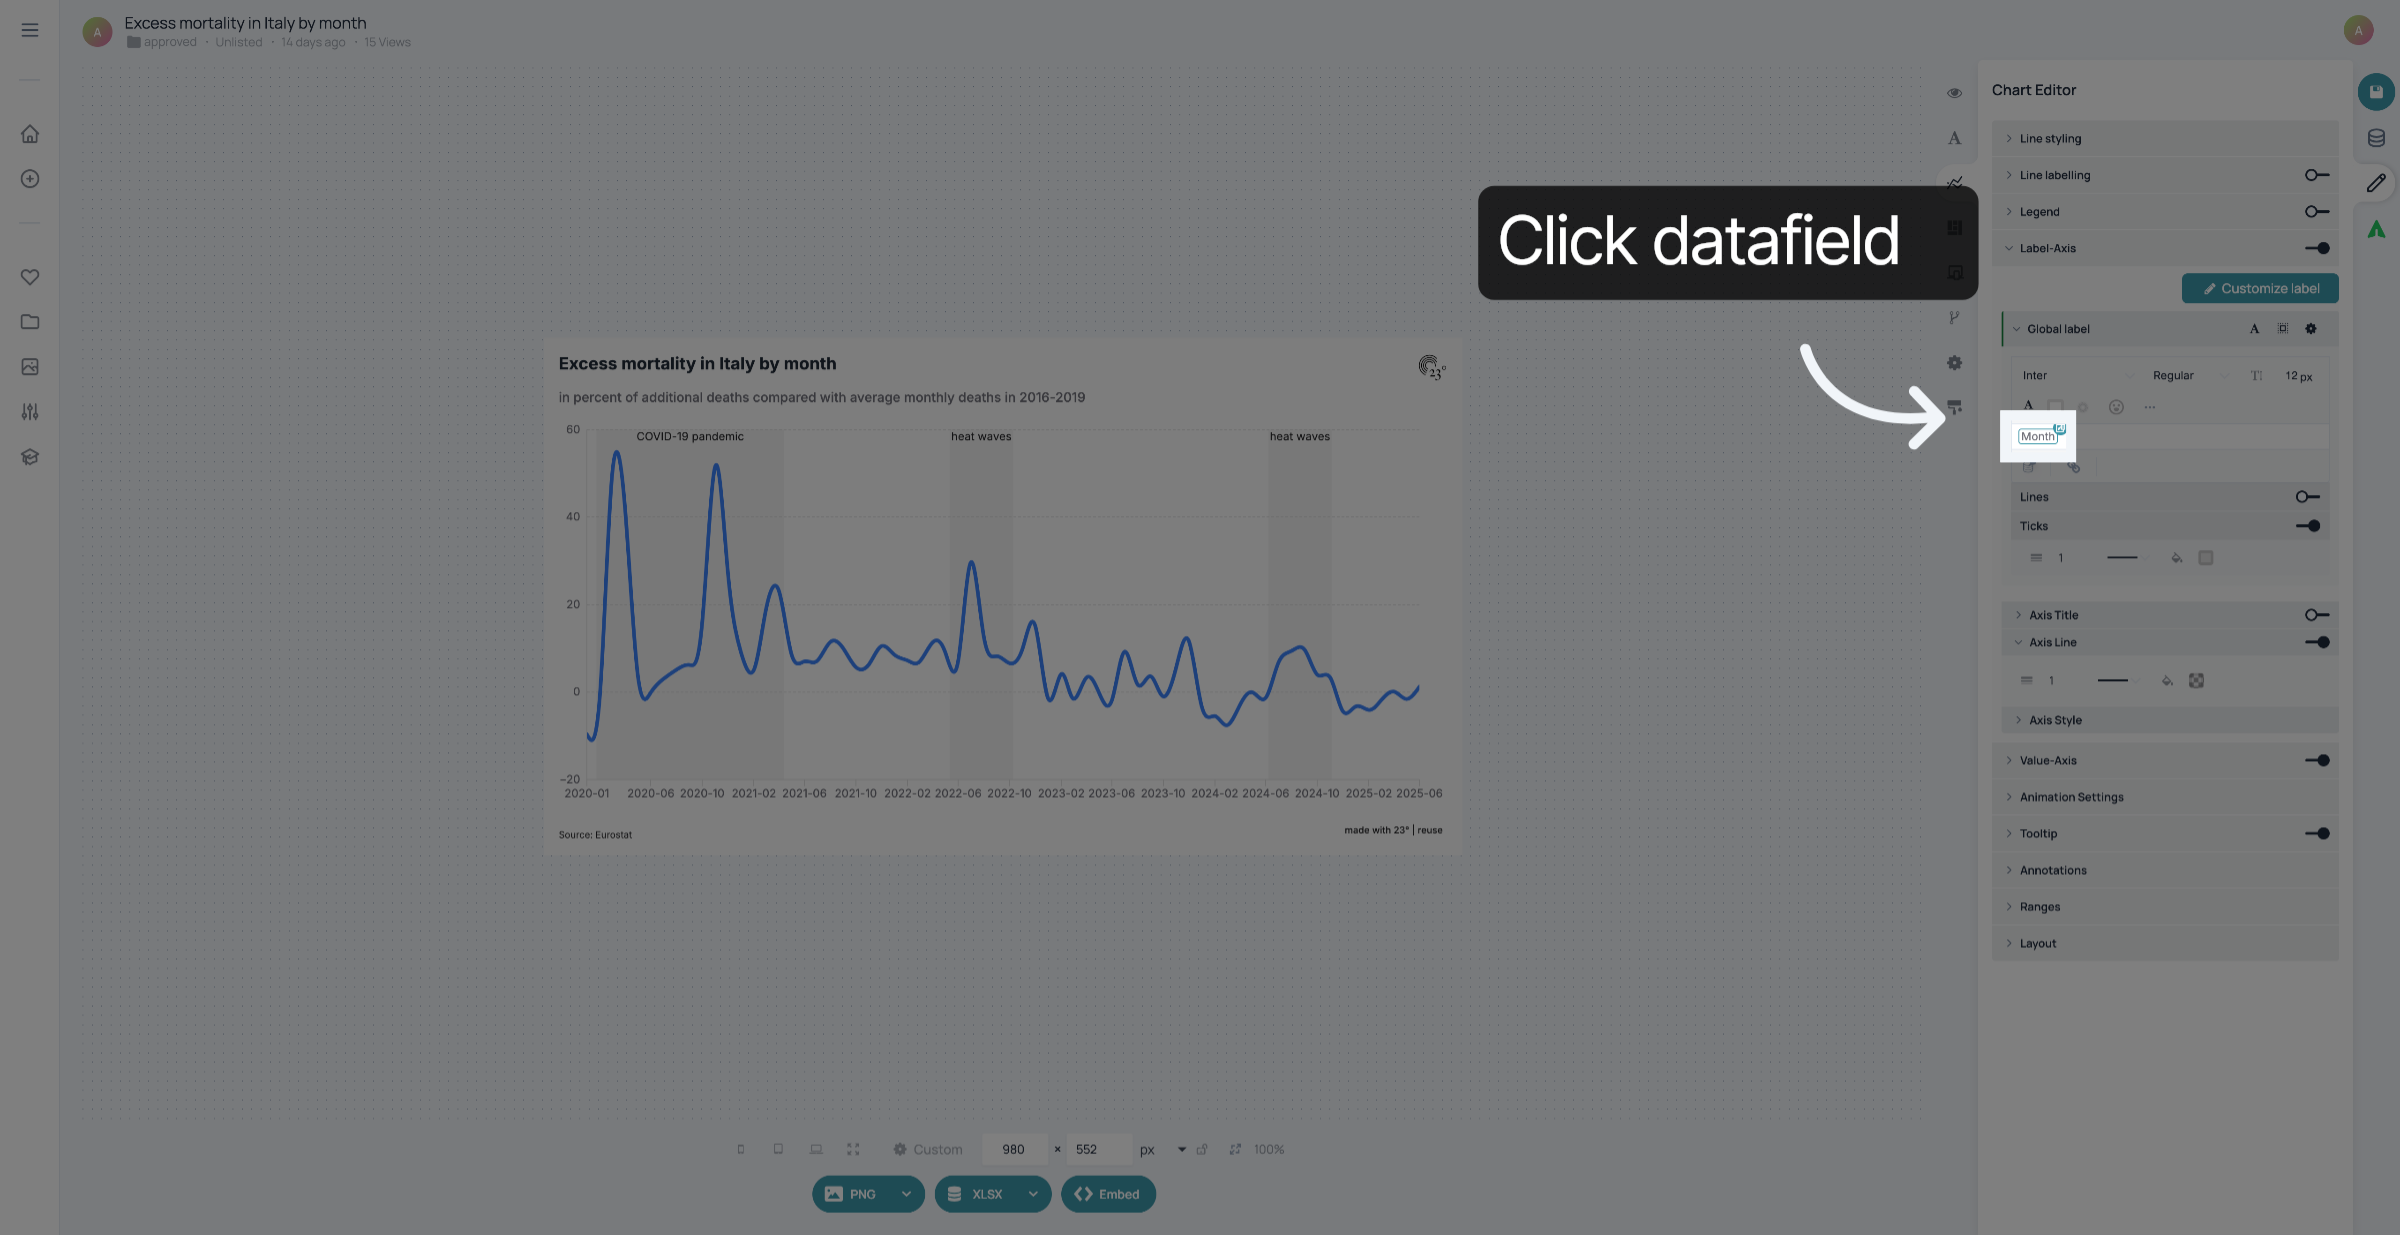
4. Click data field
Click the datafield that's in the label axis.
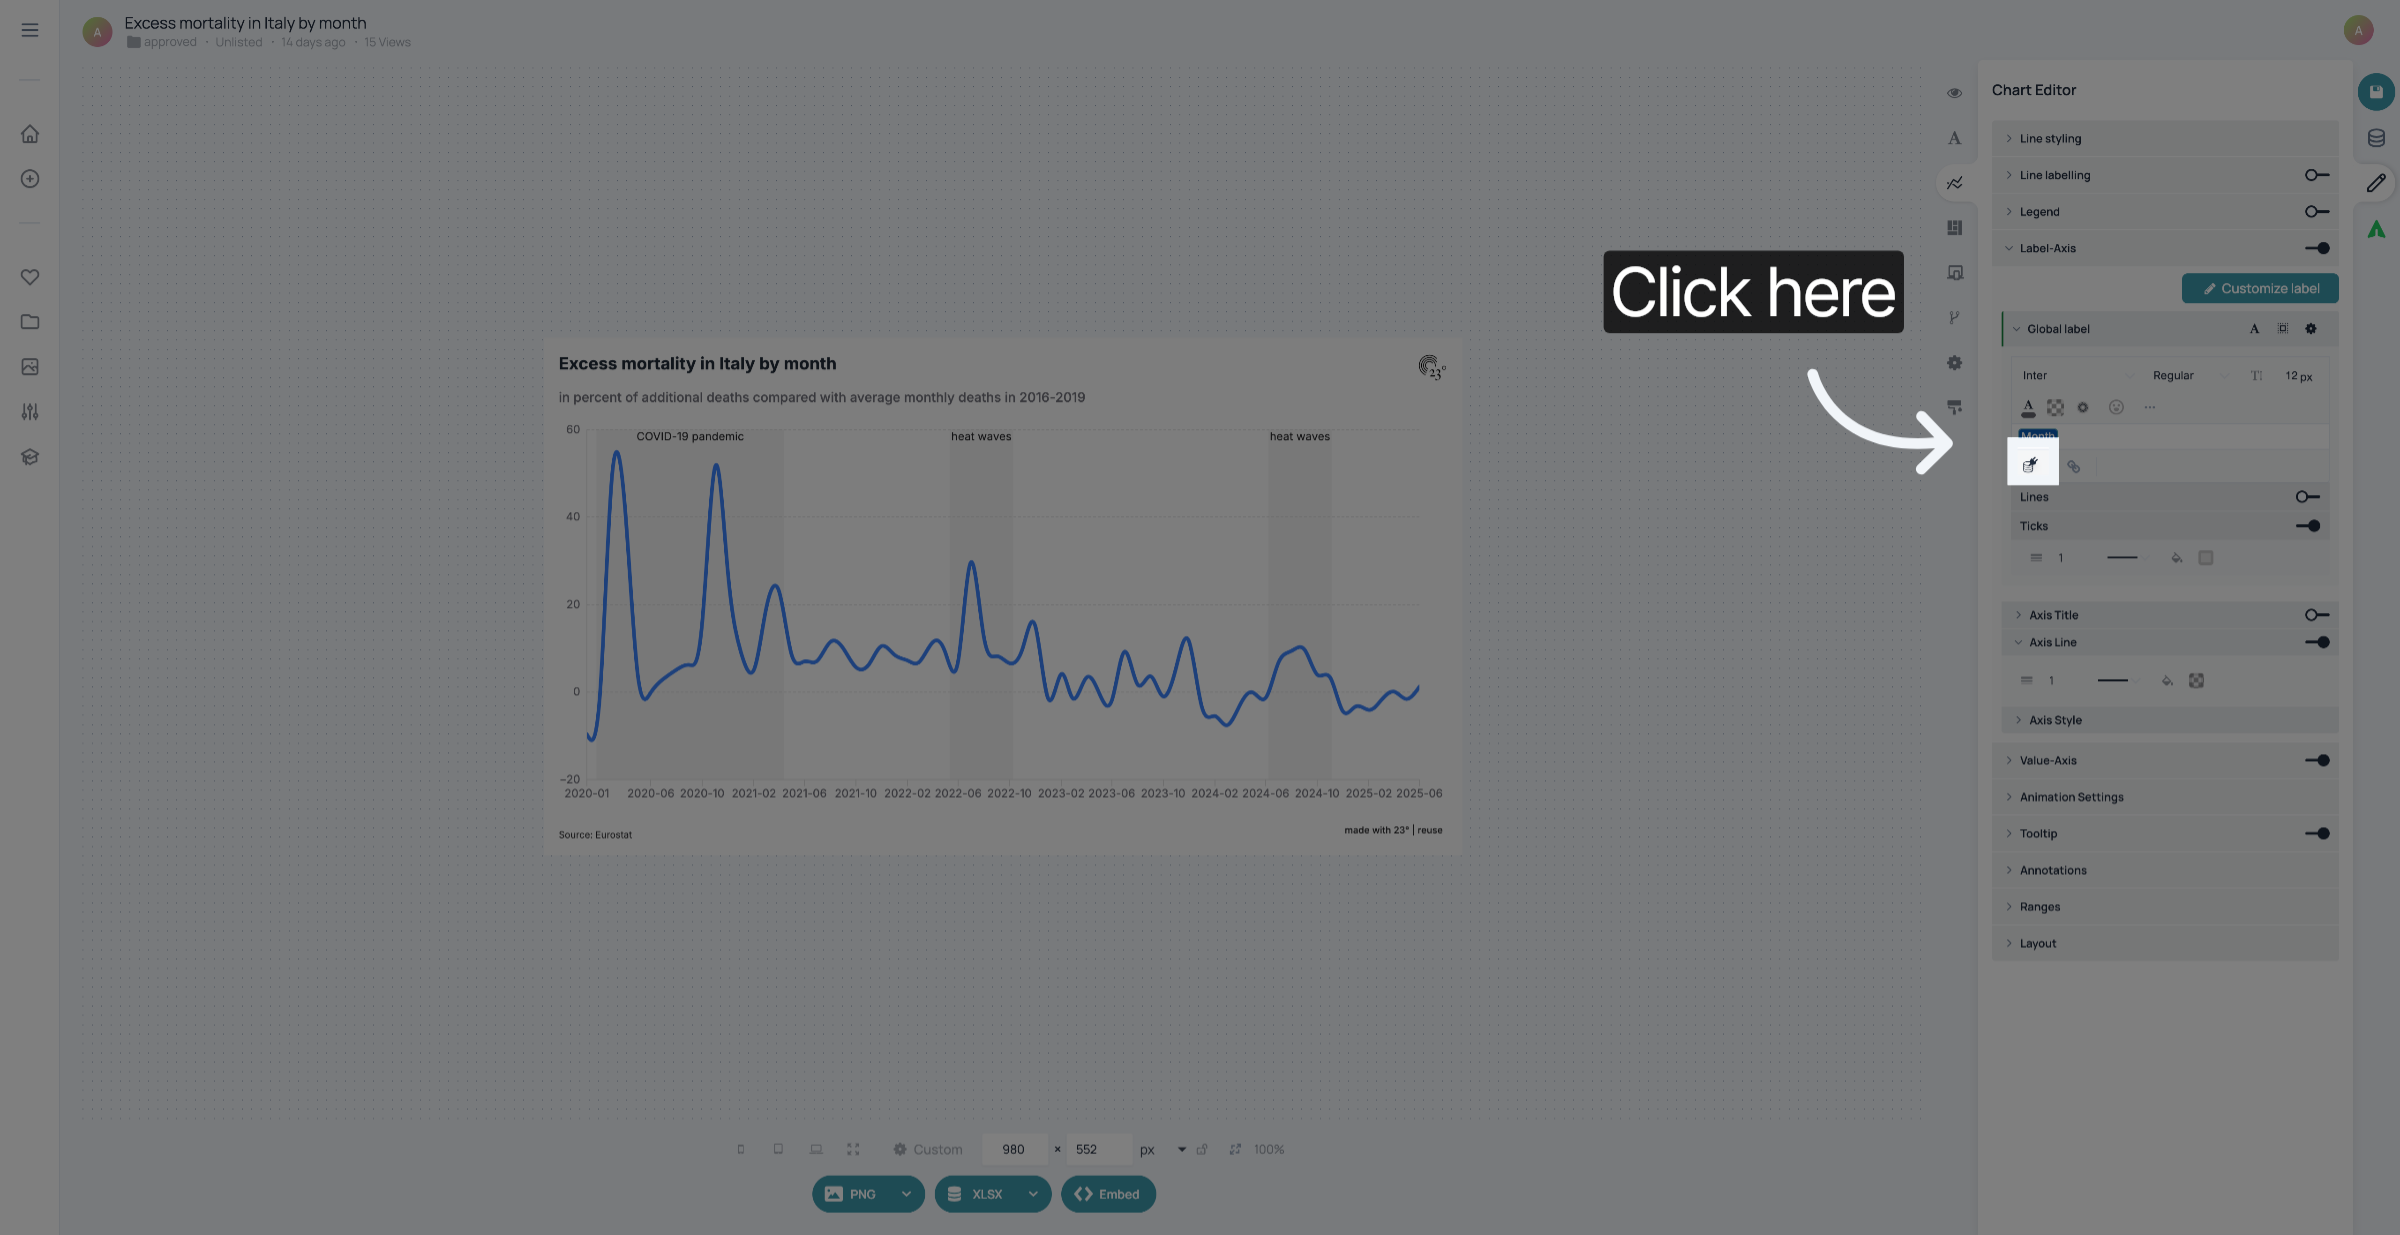
5. Click dataset symbol
Click the dataset symbol to open the display settings.
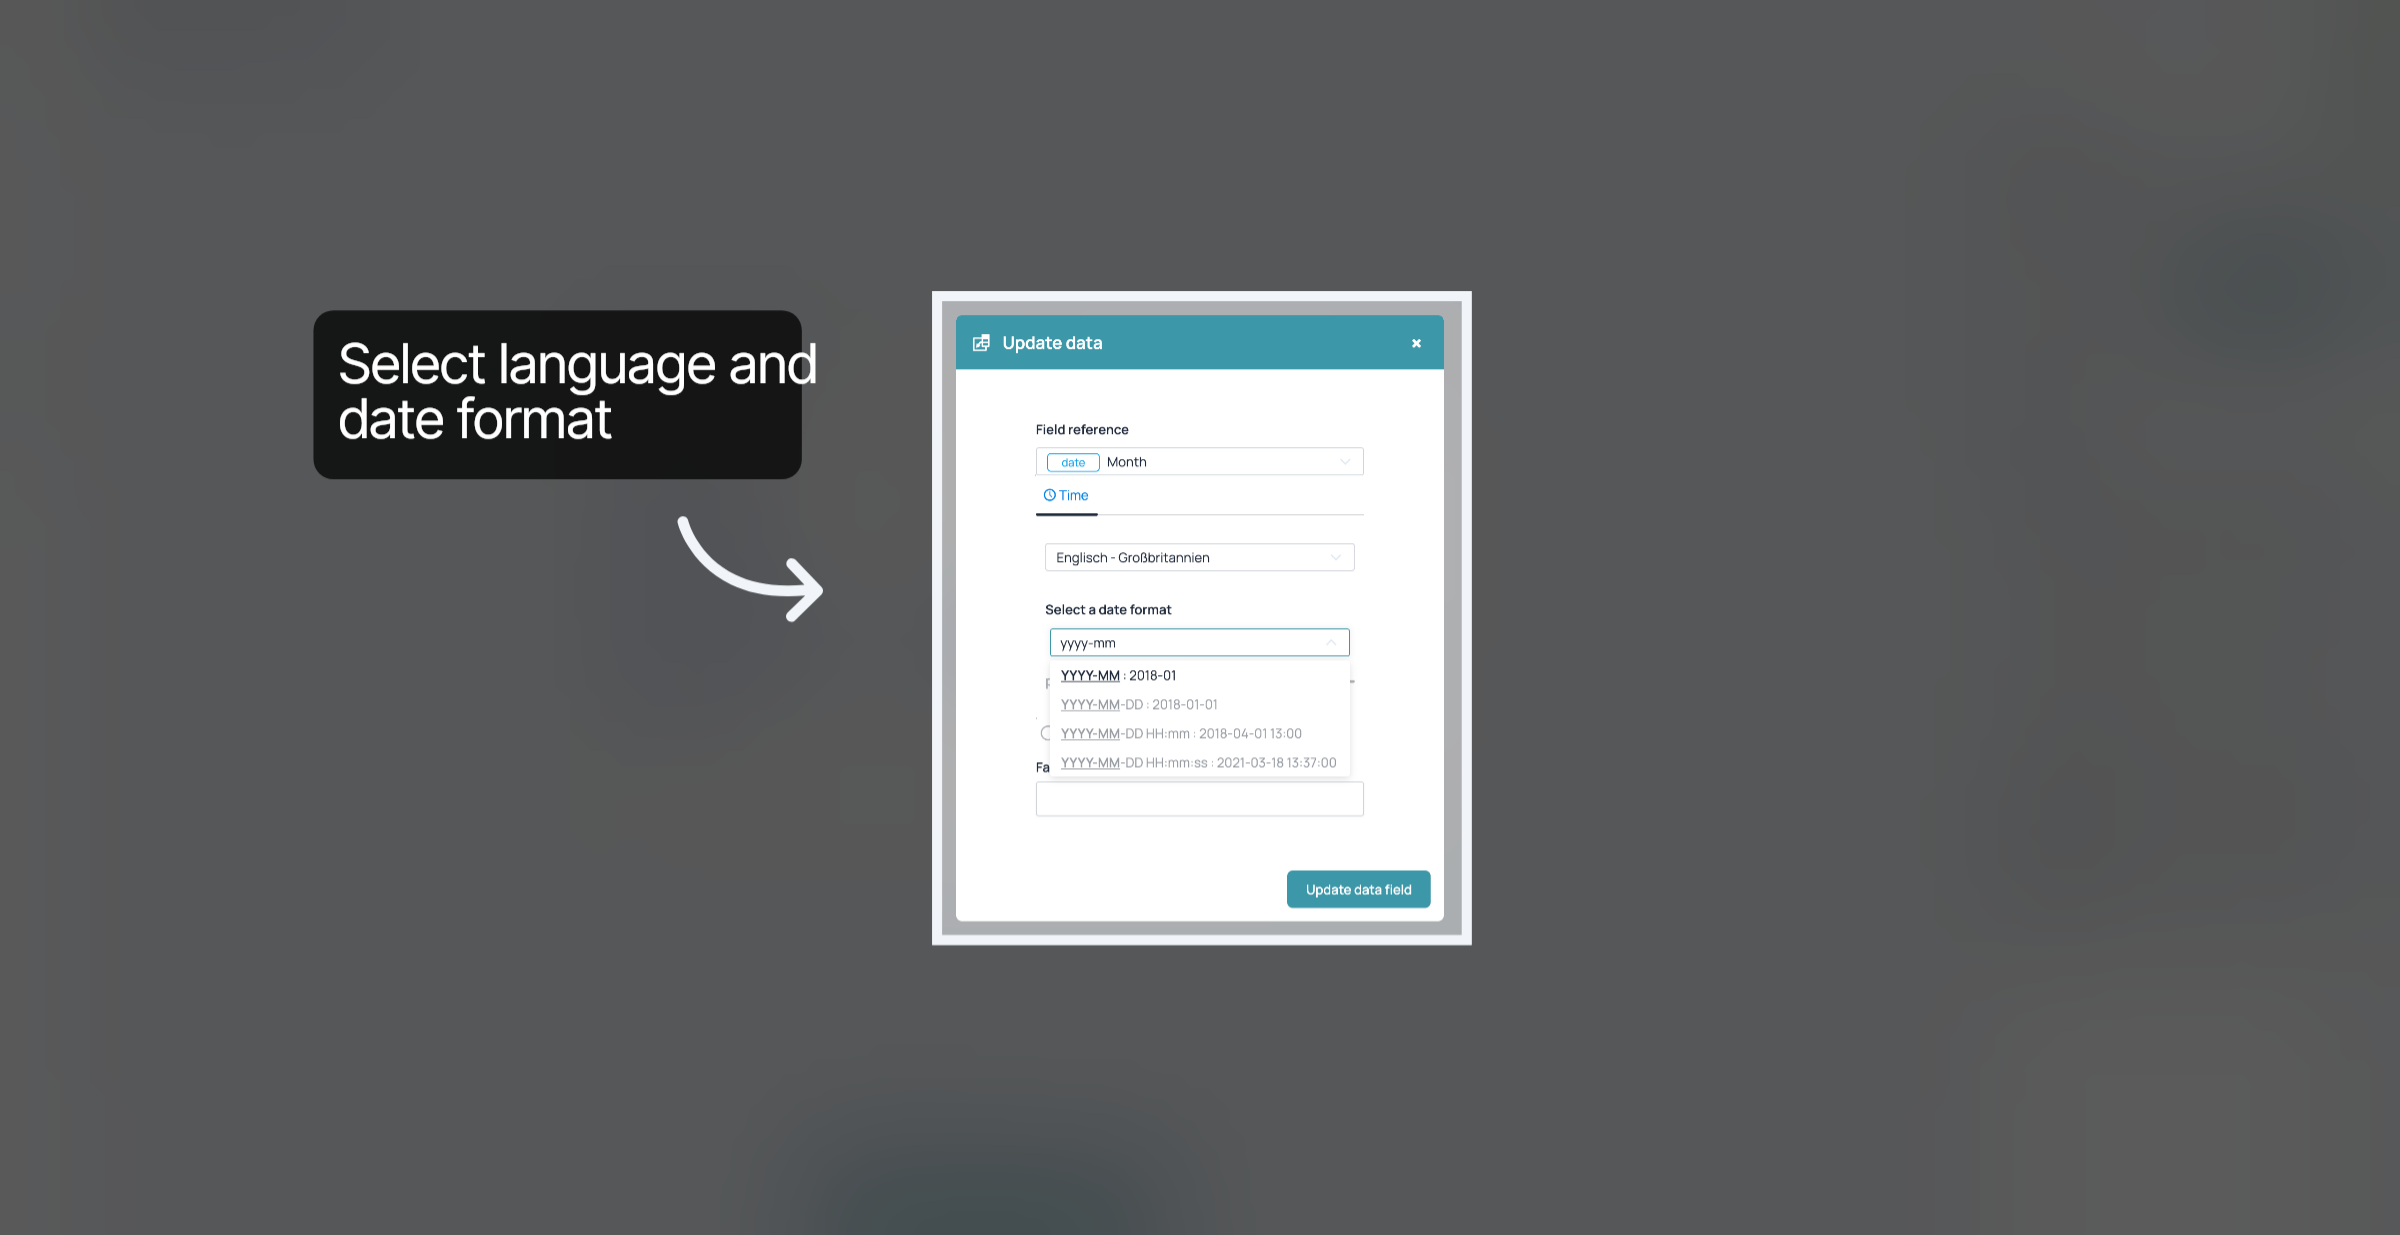
6. Select language and date format
Select the language and date format you want to use.
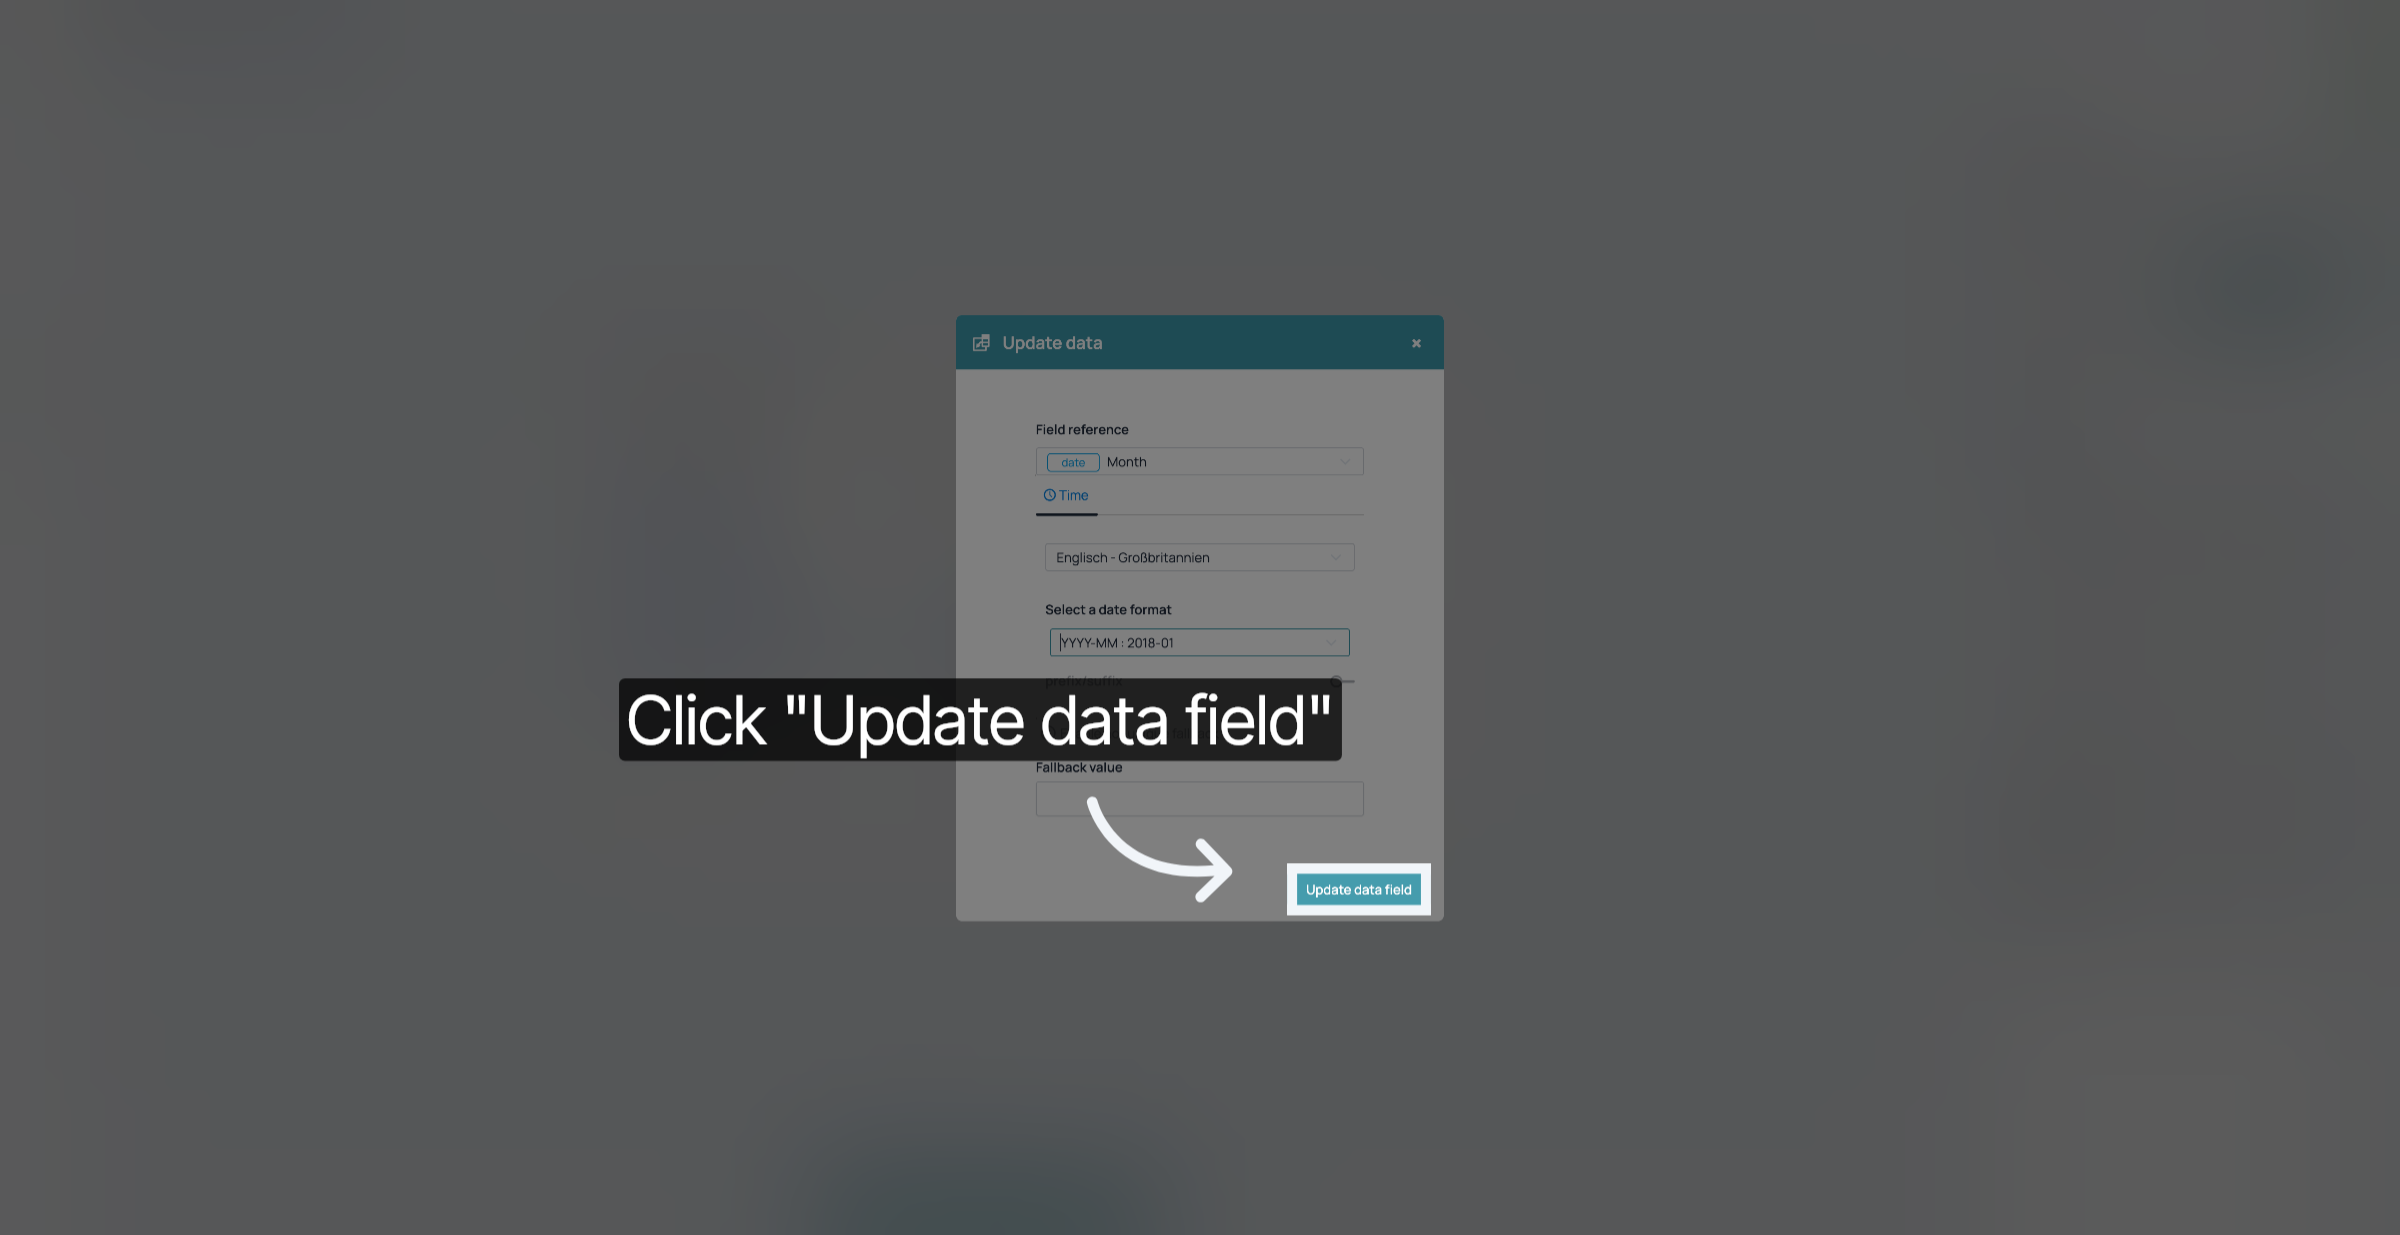
7. Update Data Field
Click "Update data field"
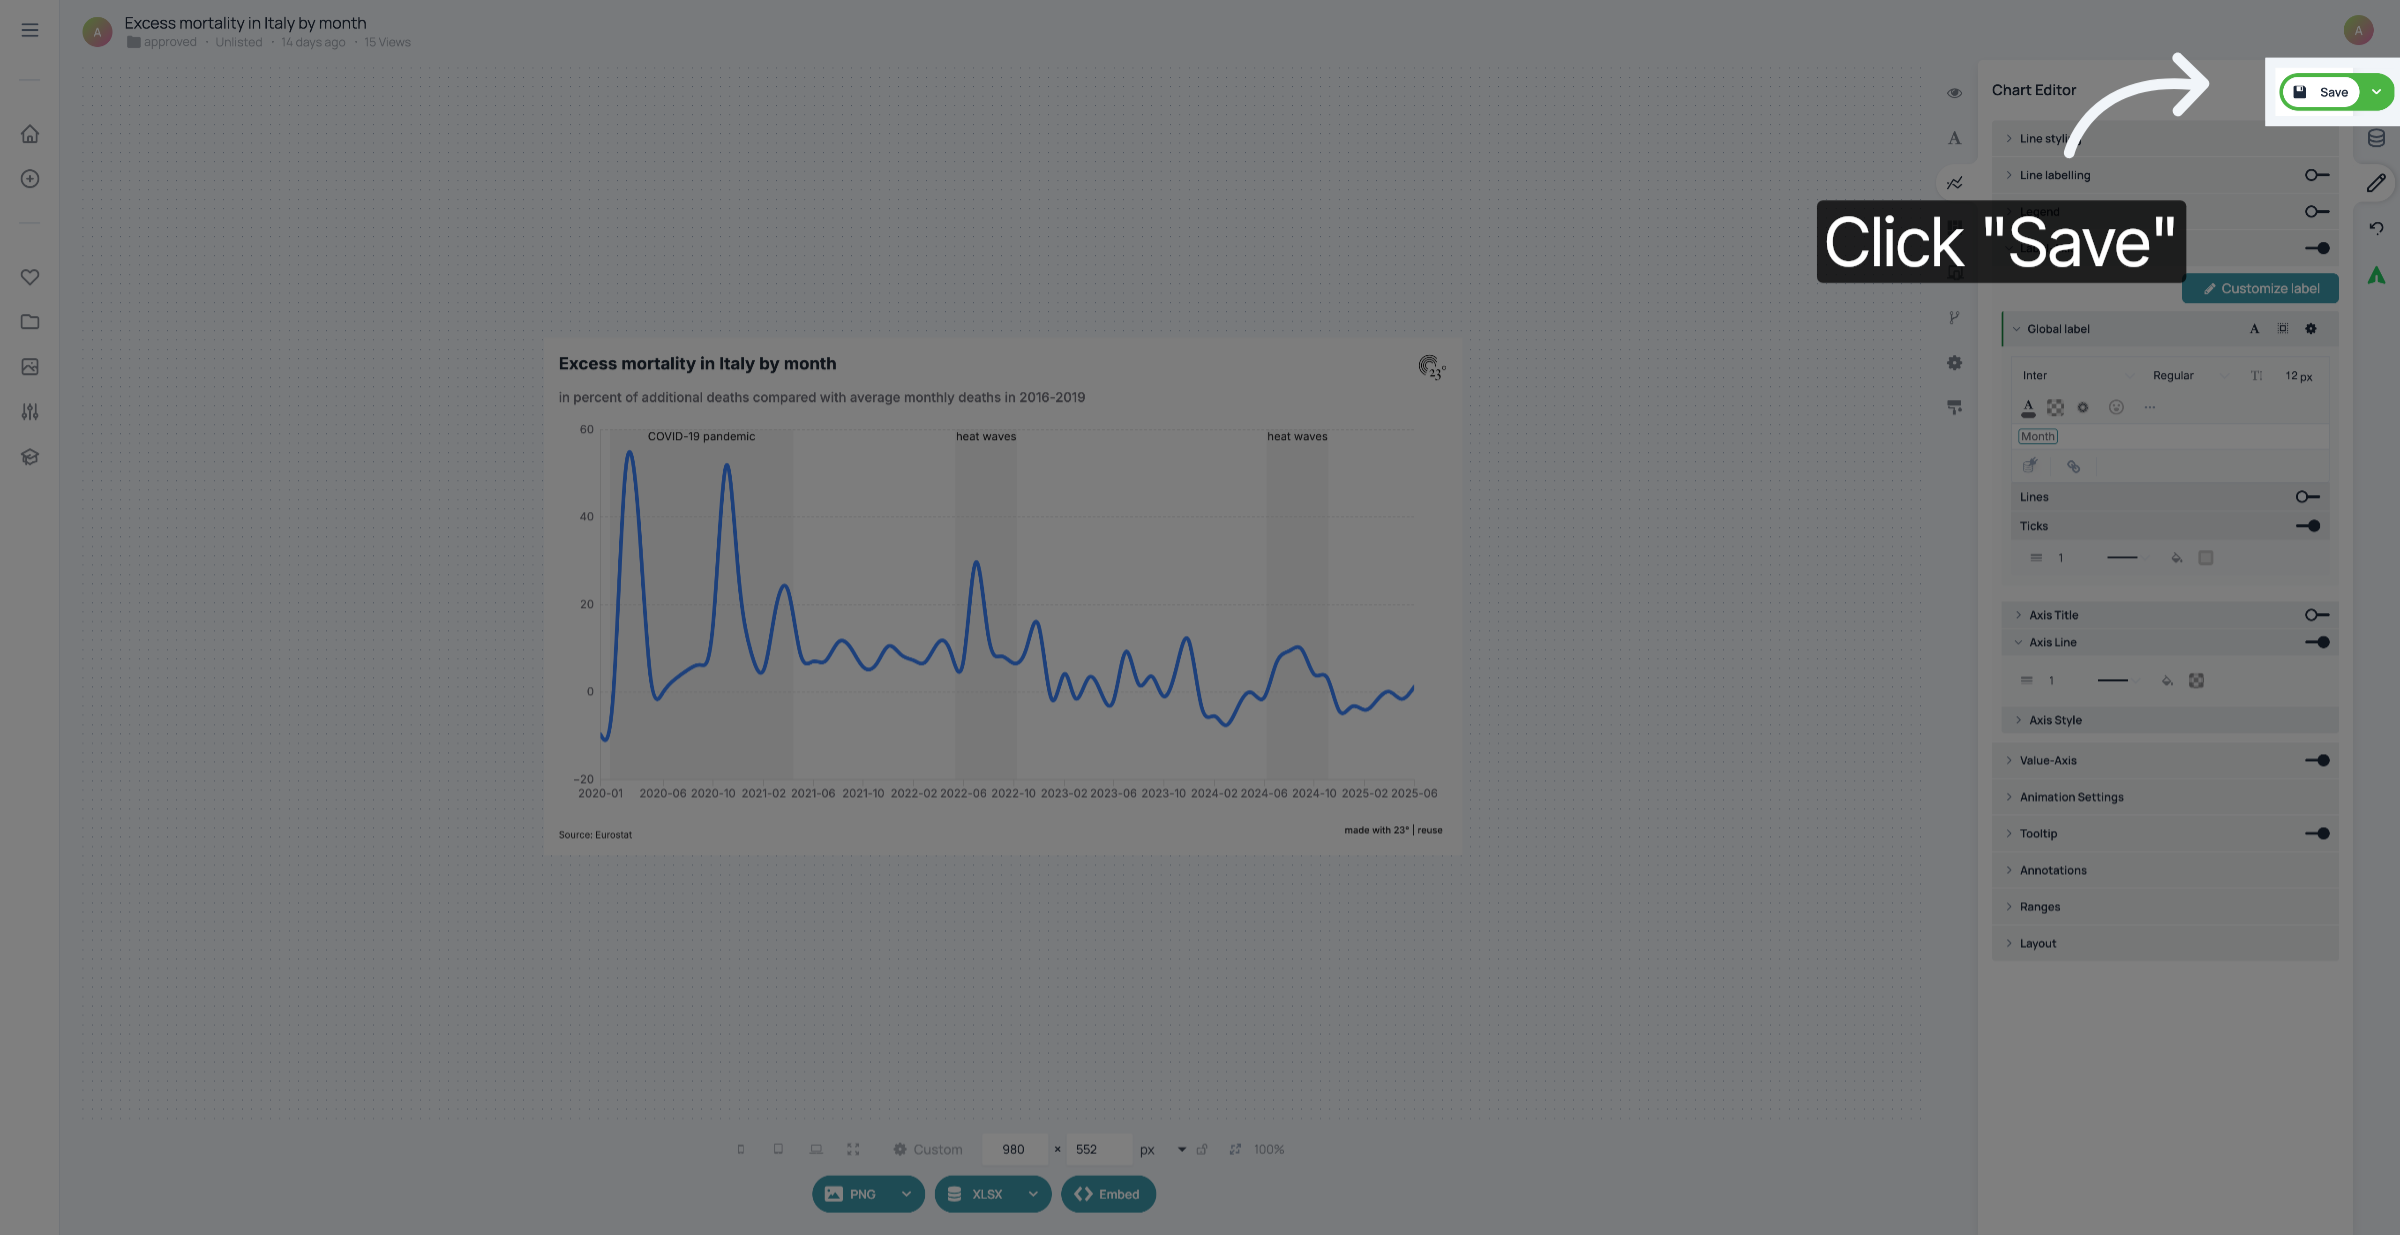
8. Save Changes
Don't forget to save your changes
You have successfully customized the display formats of time datafields.