Create a Dashboard
This tutorial shows you how to create a dashboard by combining two already existing visualisations.
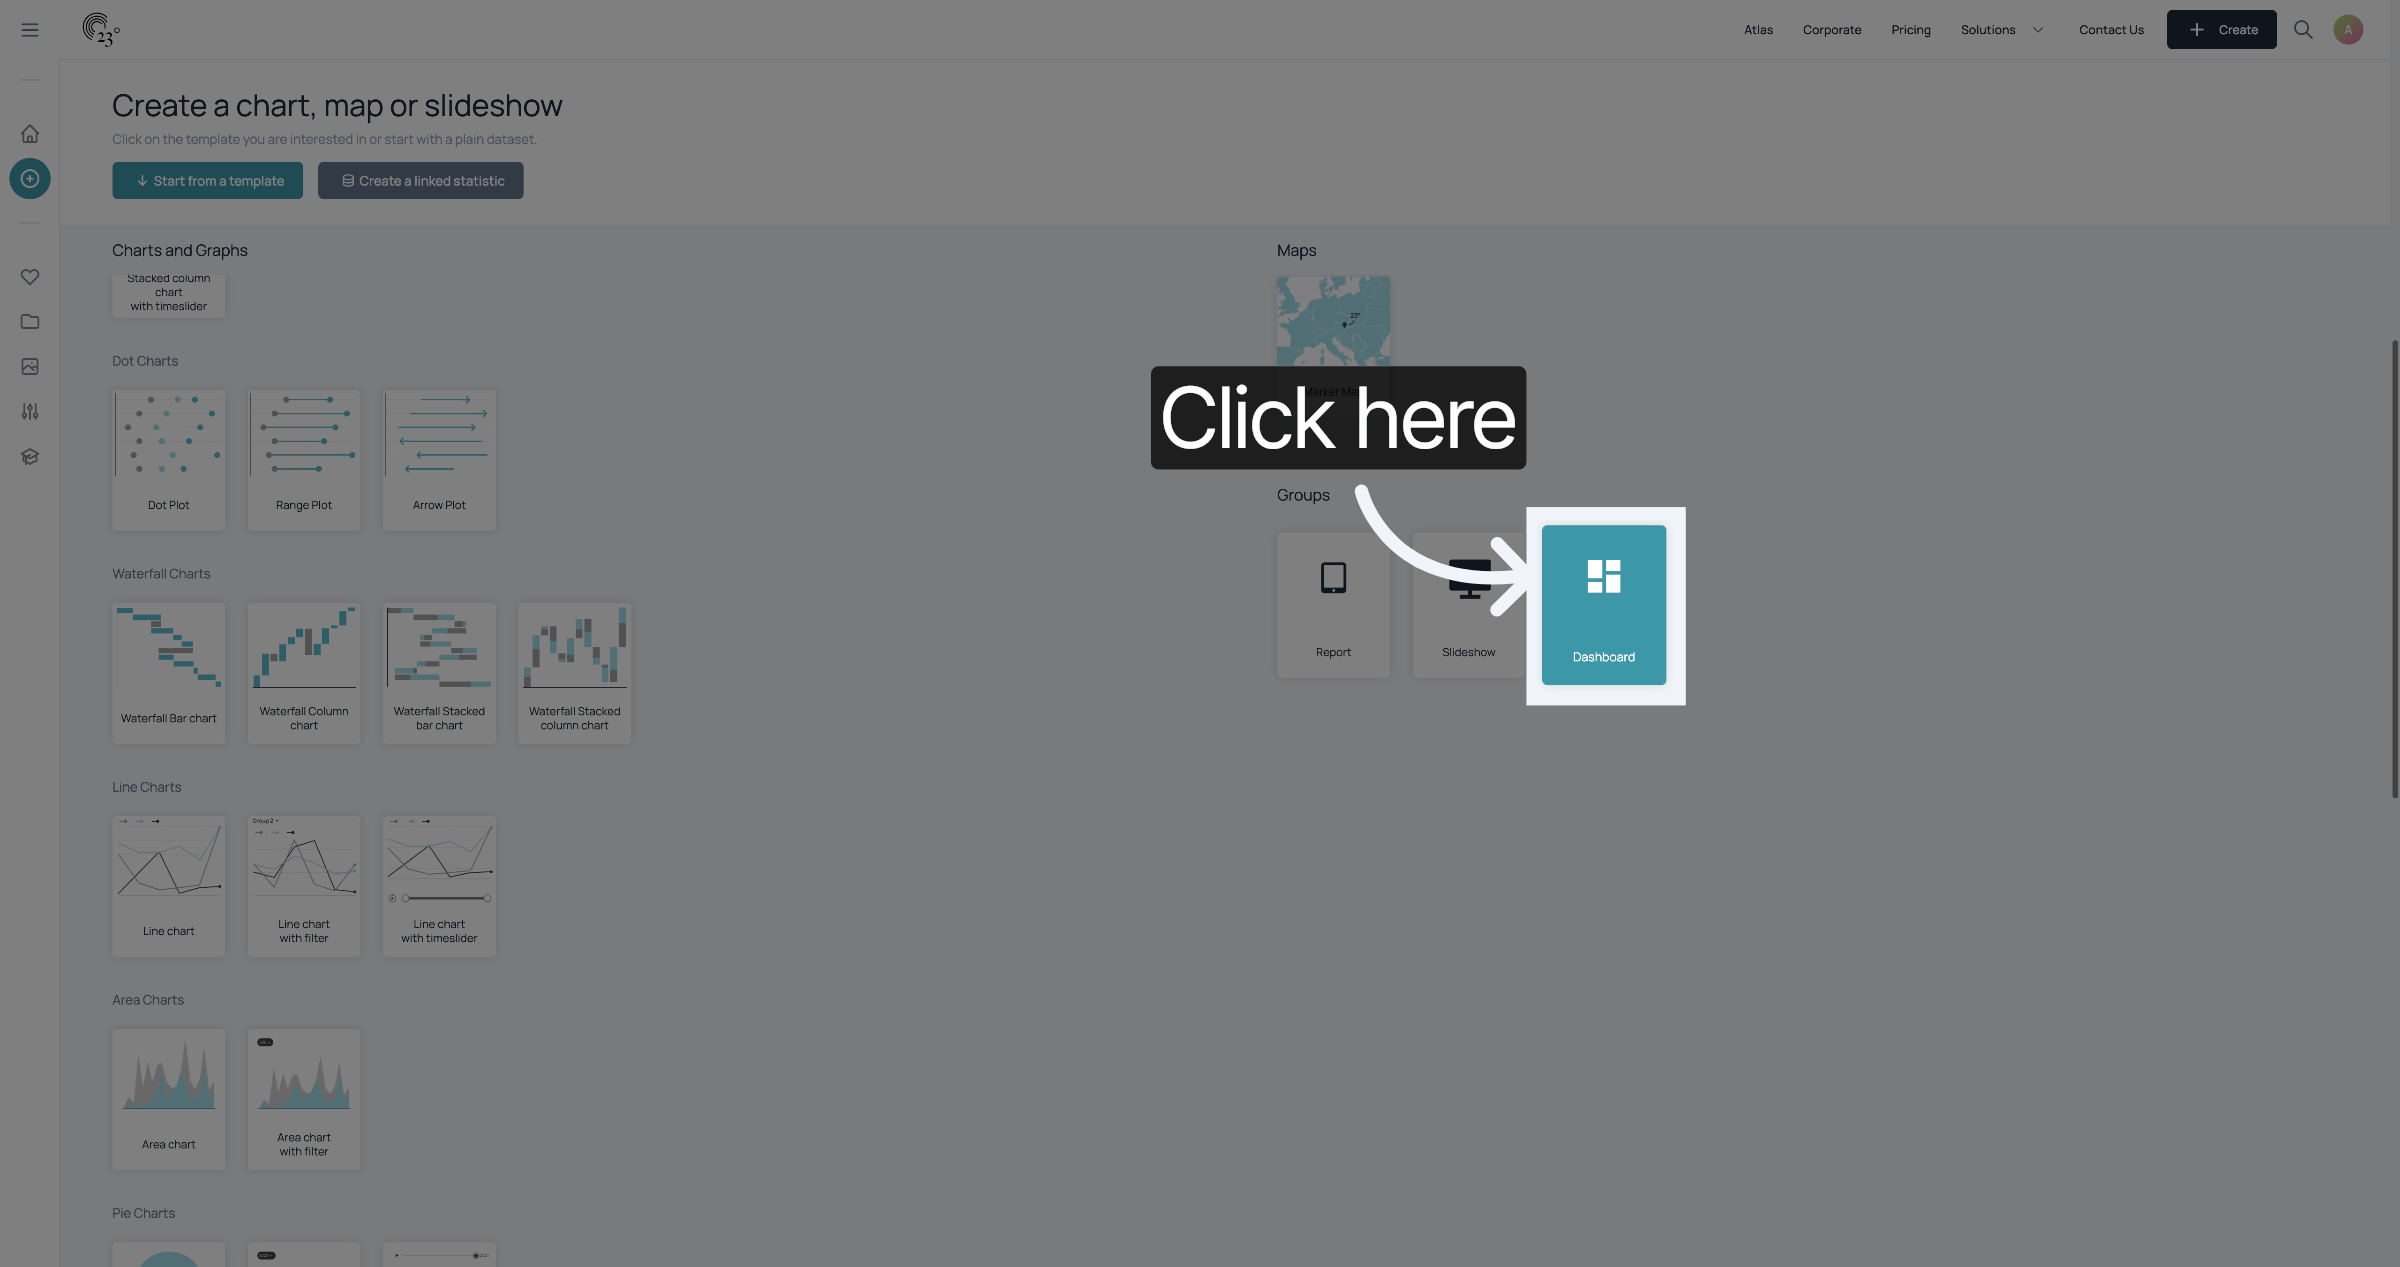
First, go to the creator page and click "Dashboard".
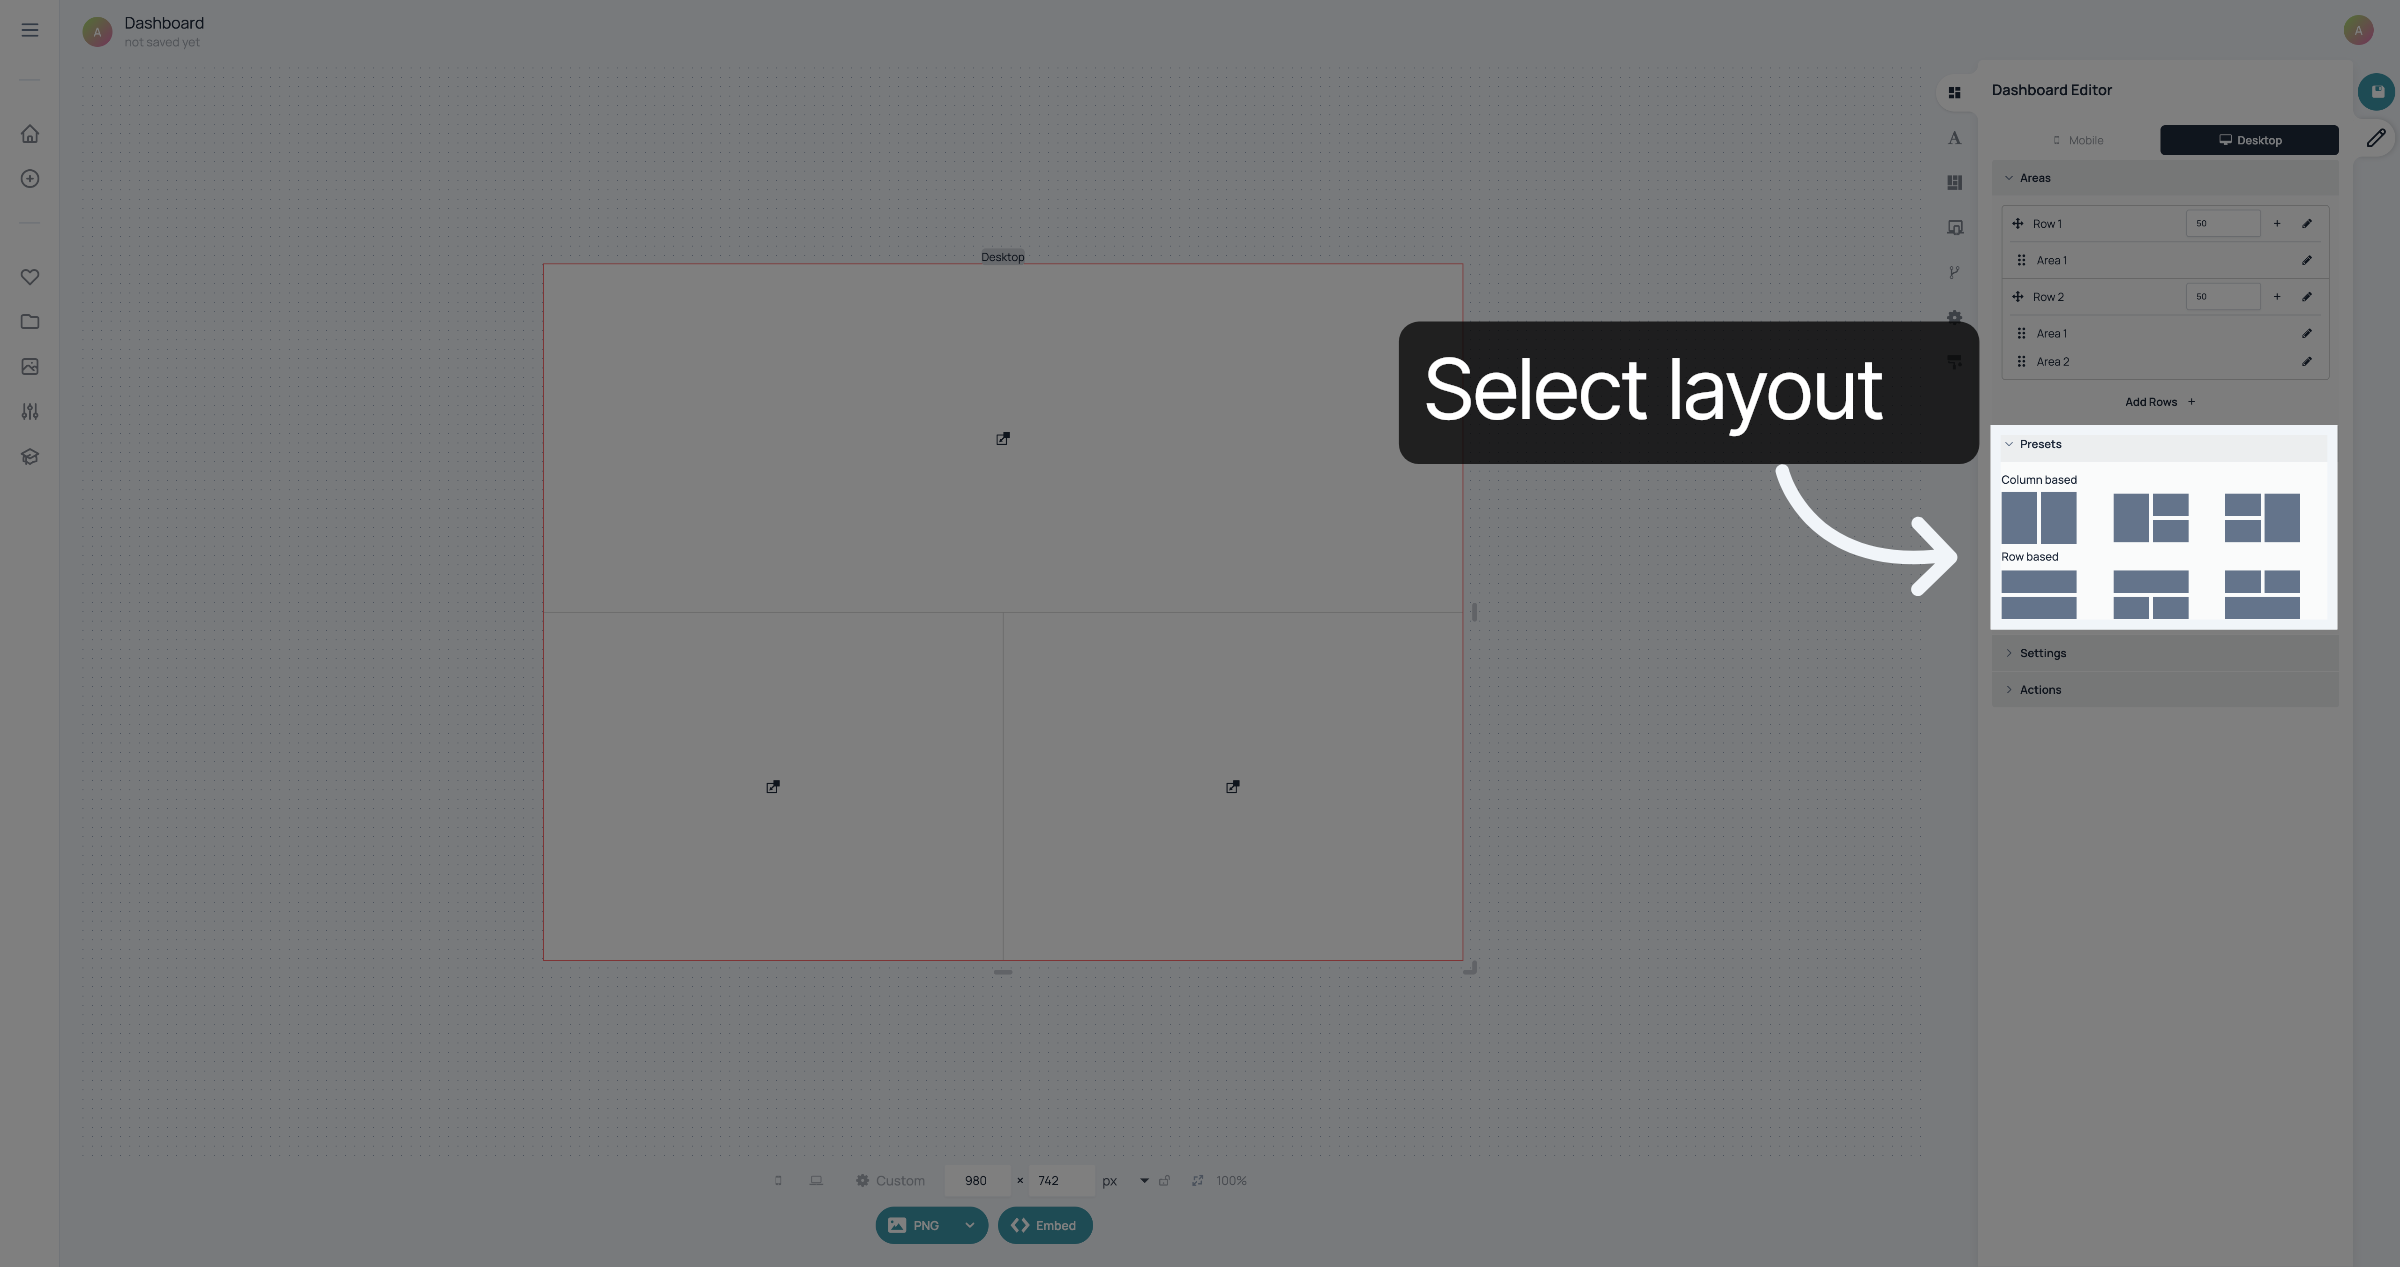
To customize the layout of your dashboard, you can use one of the presets.
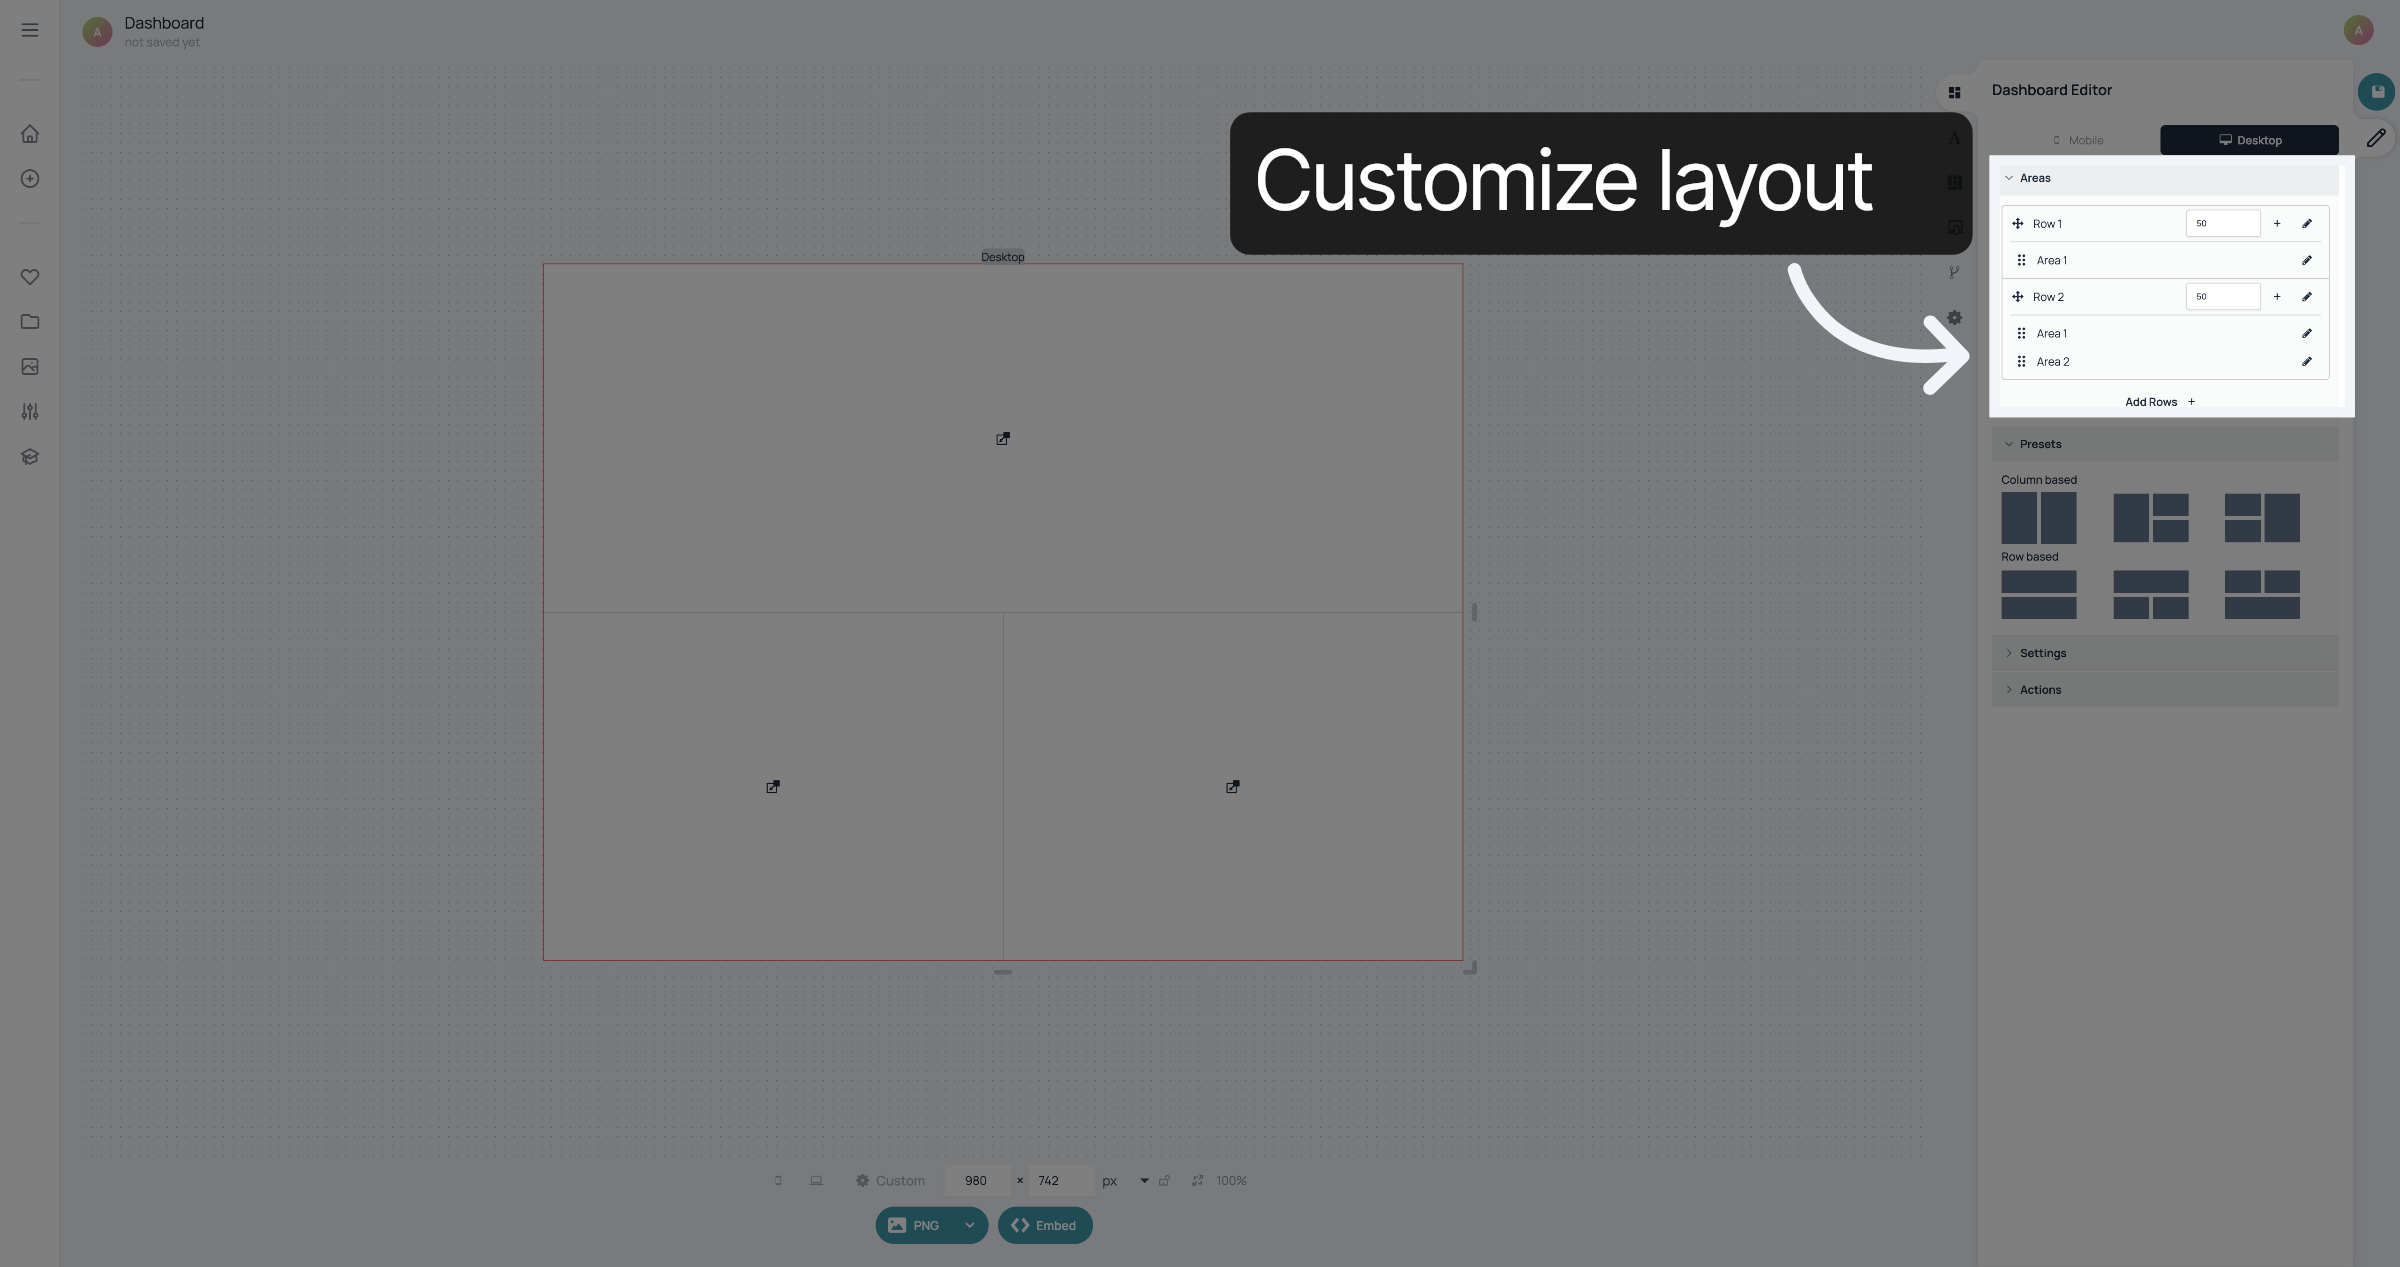
If you want to add more rows or columns to your layout, you can do that in "Areas"
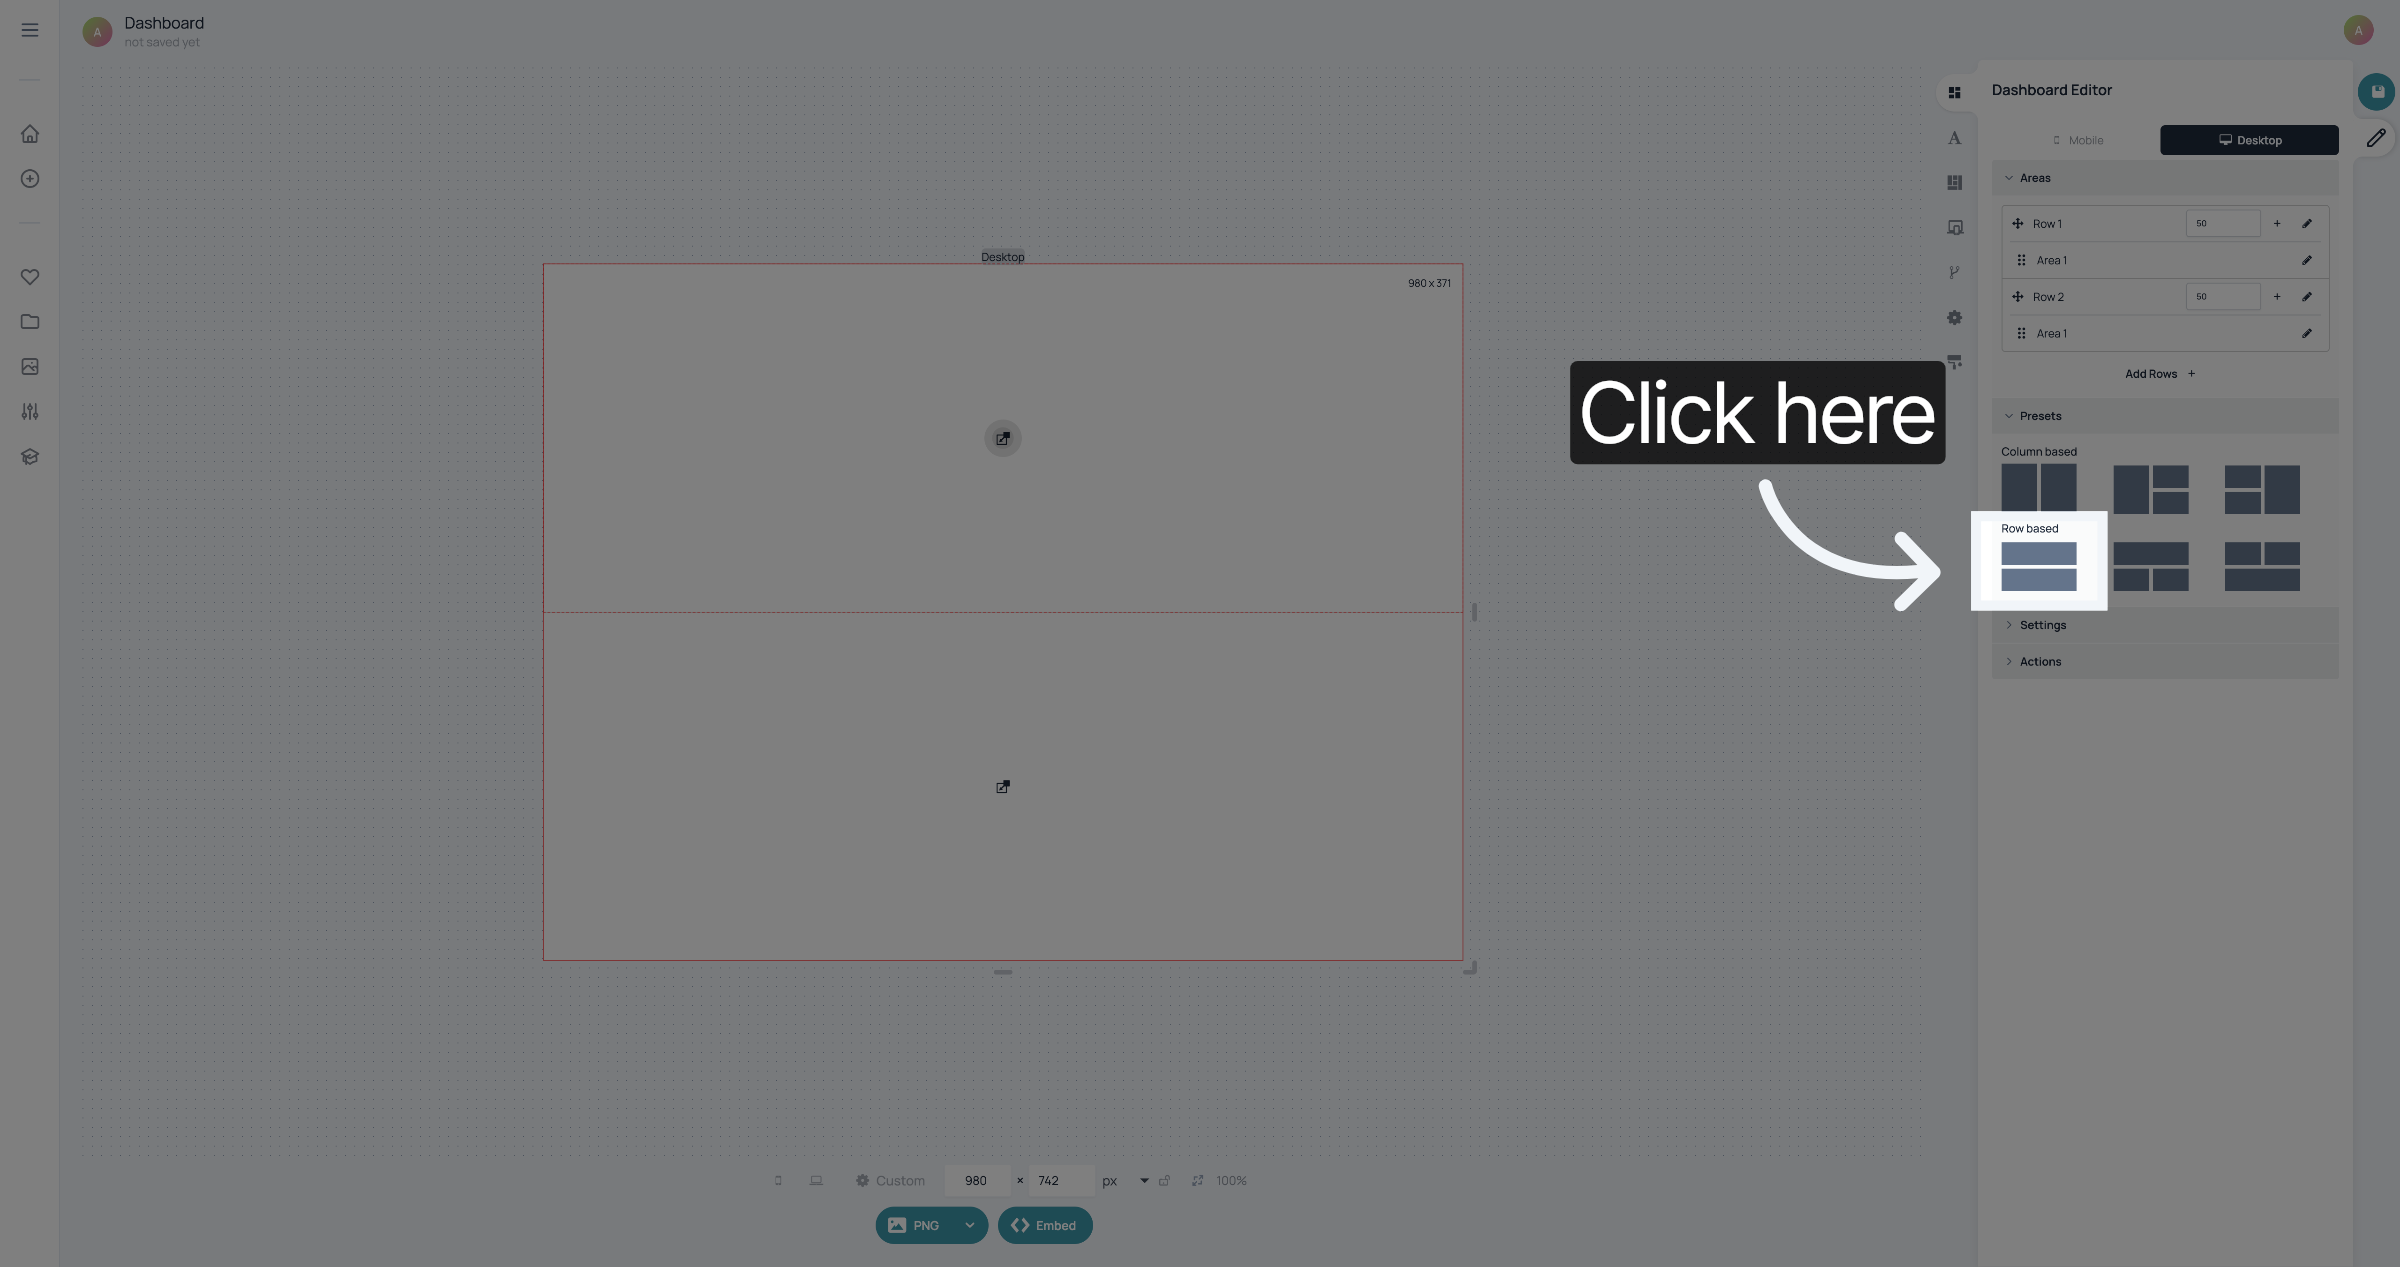
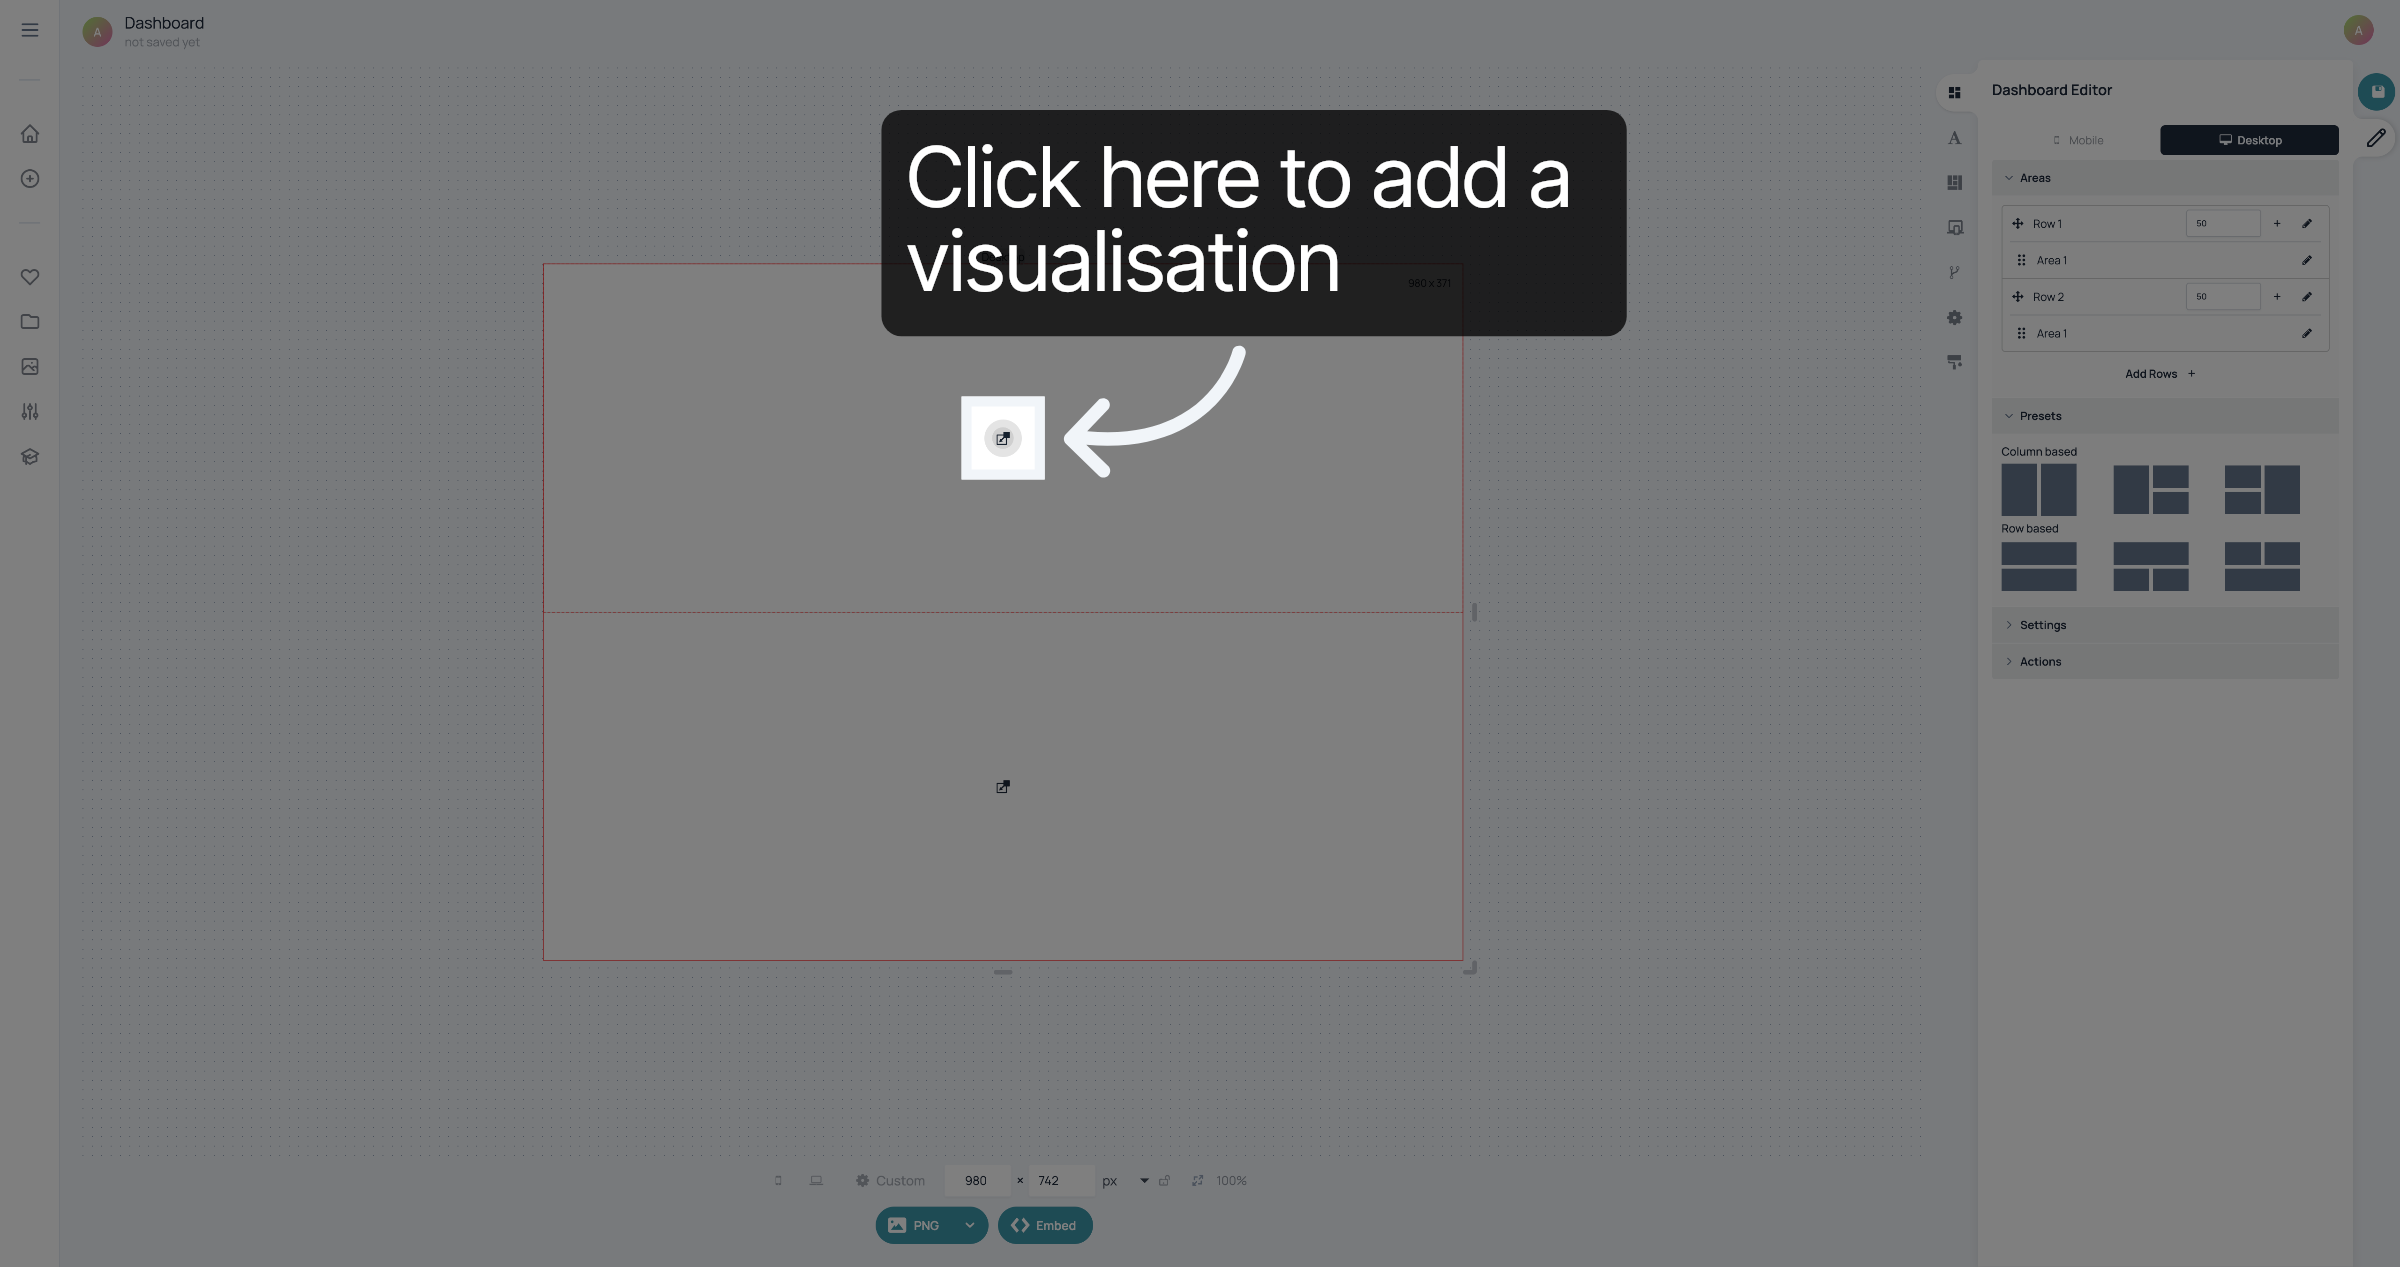
In this case, we are using a row based layout with two visualisations.
Click here to add the first visualisation.
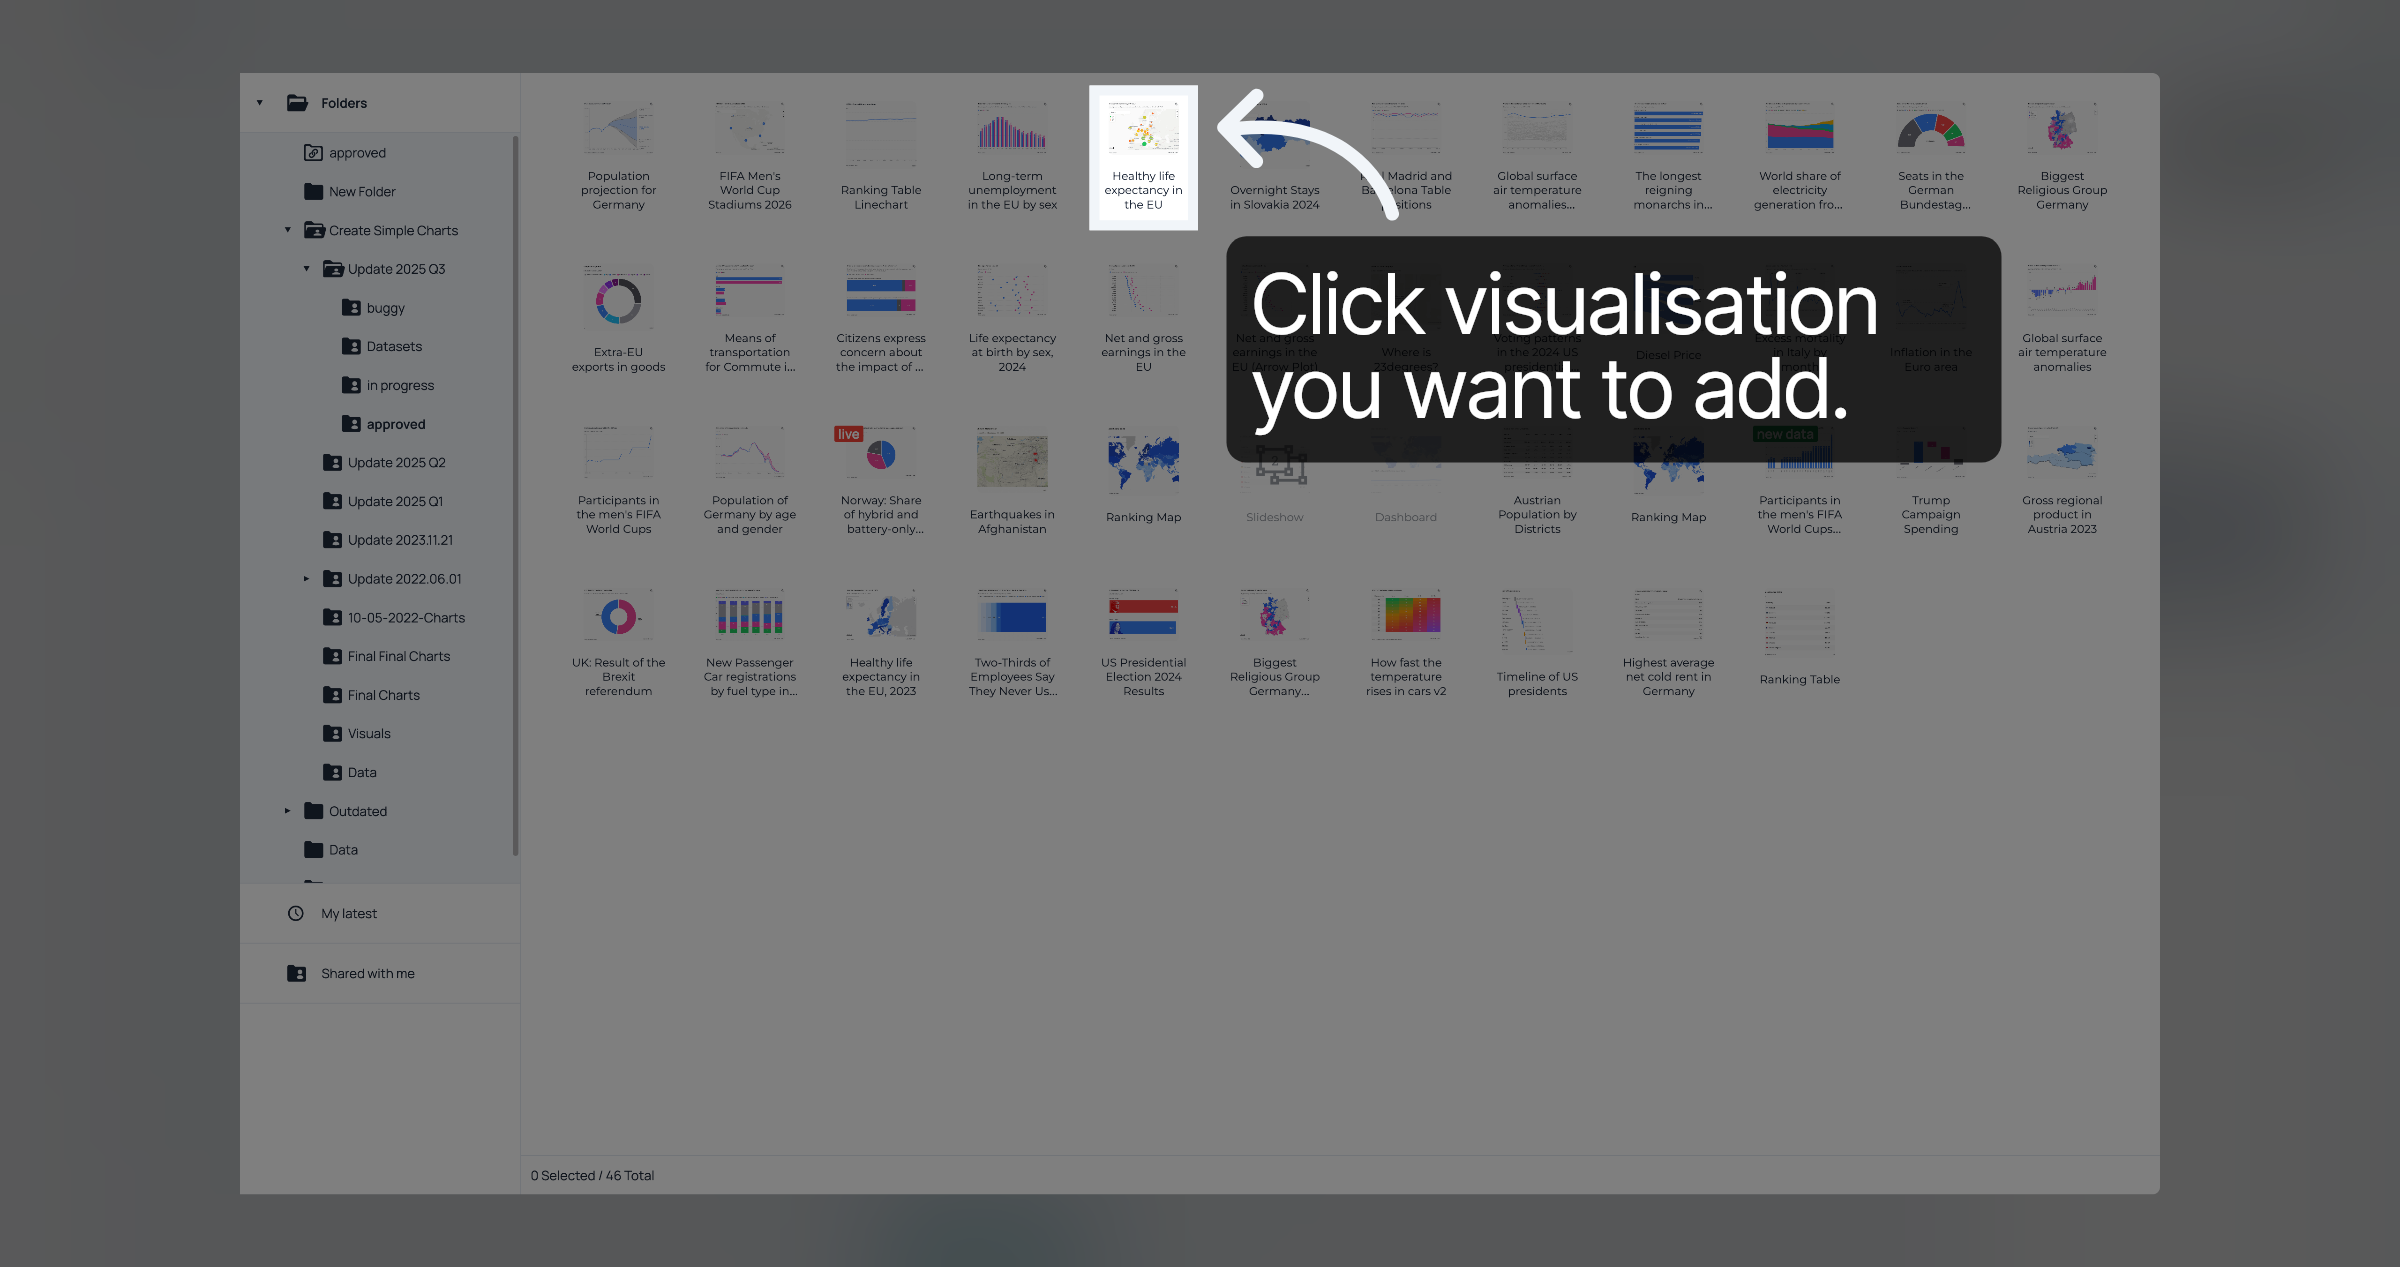
You will see your Folders. Find the visualisation you want to add and click it.
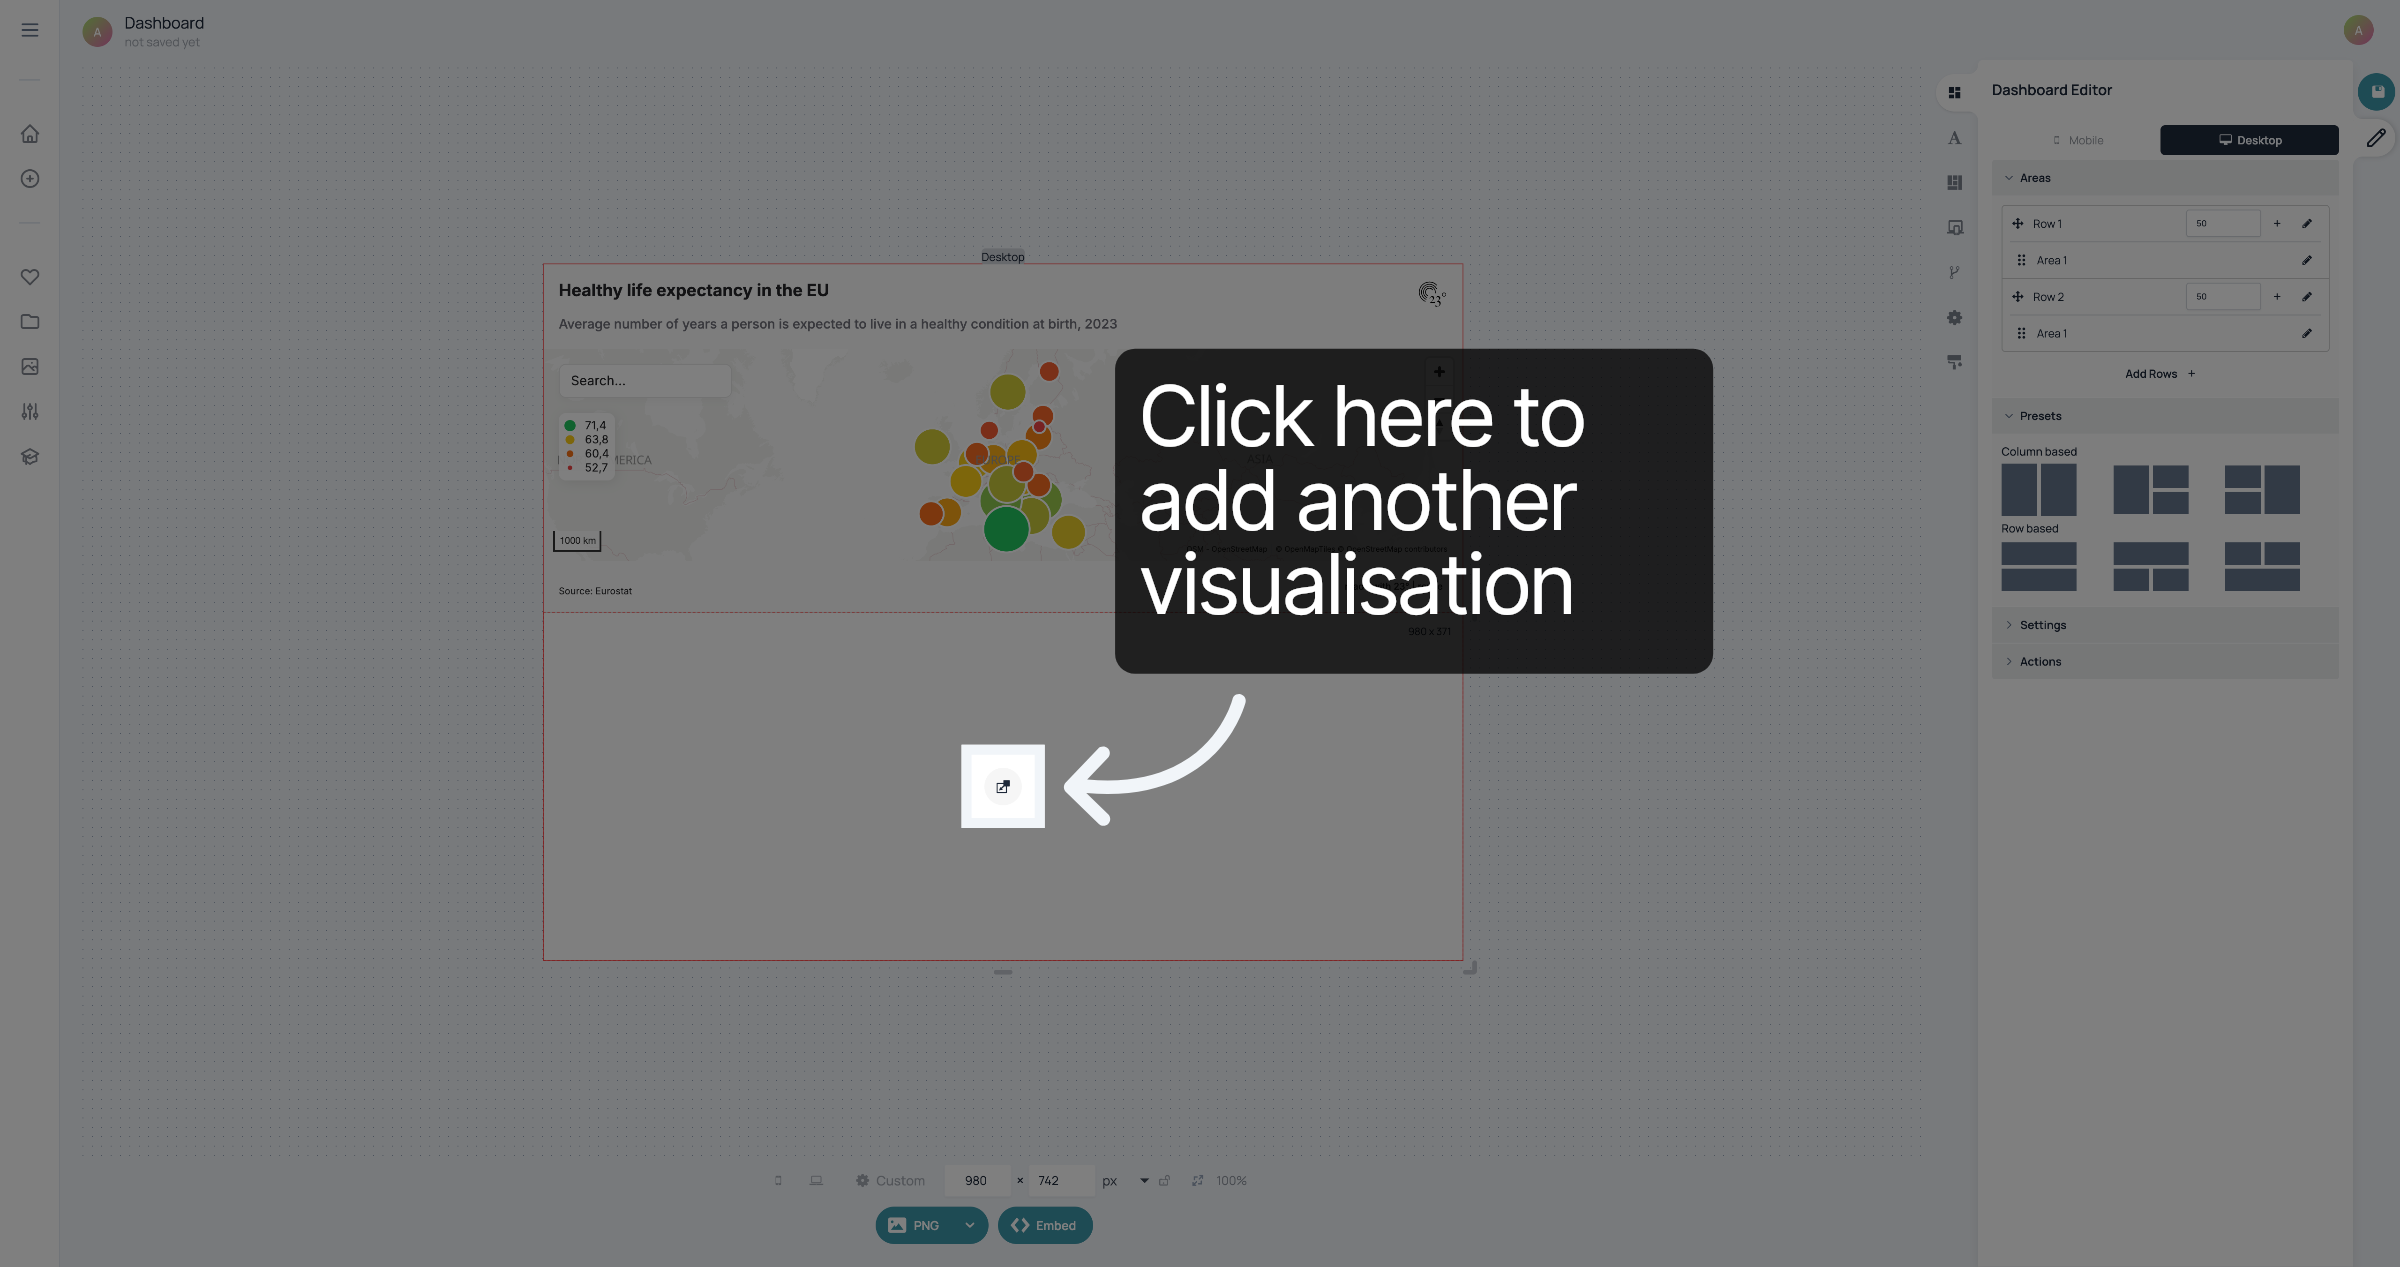
Click here to add the second visualisation.
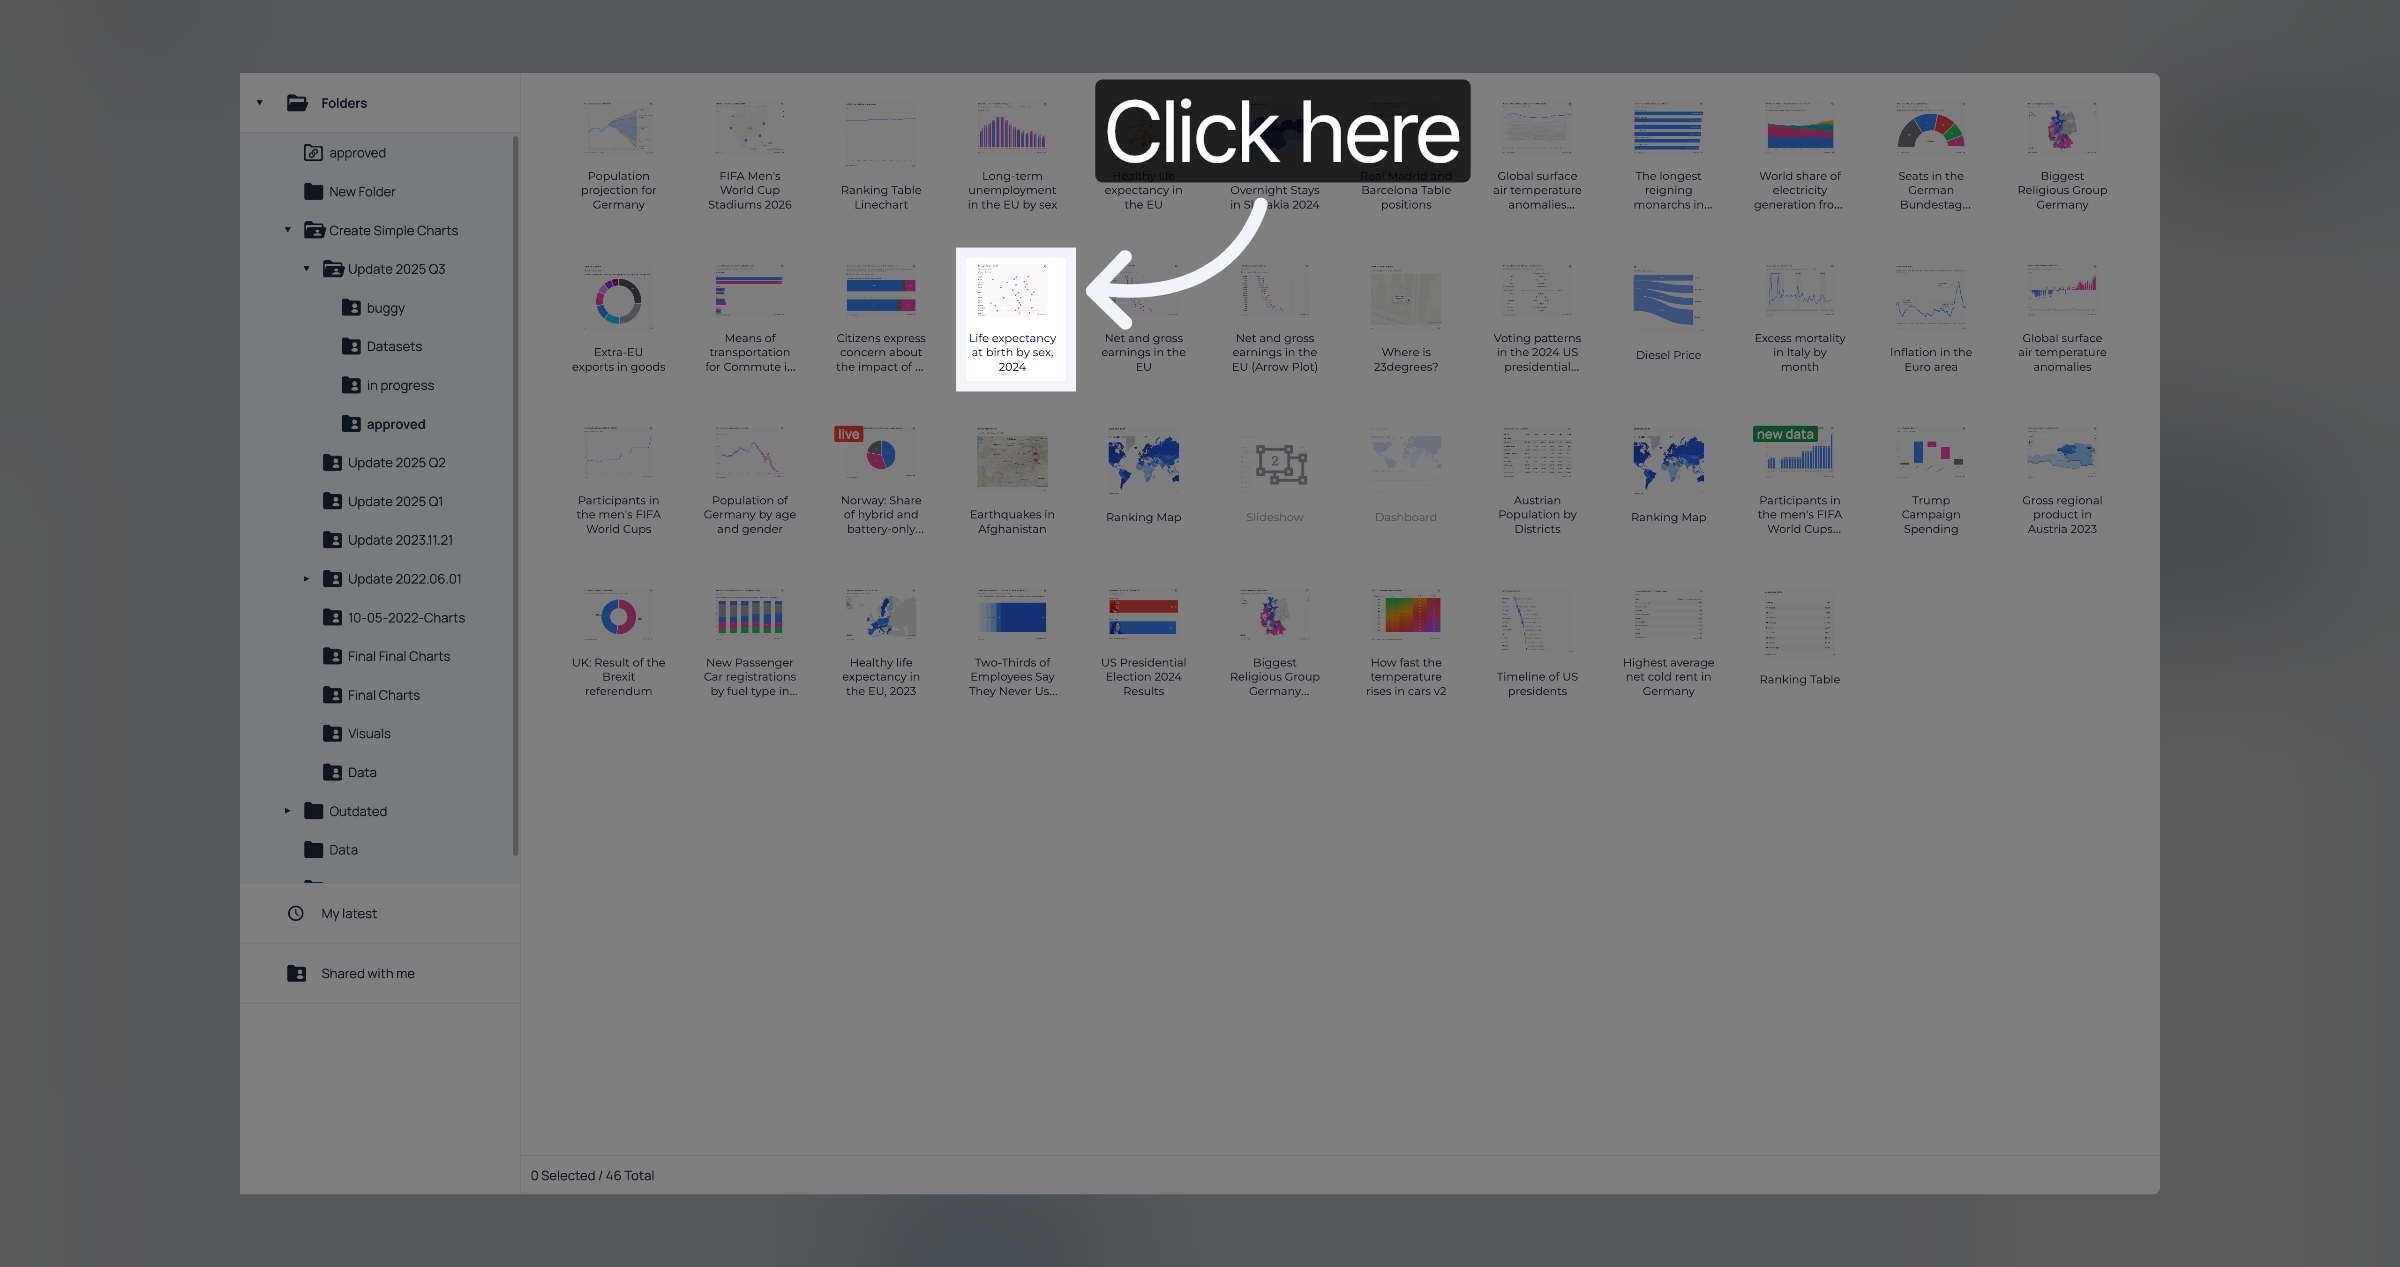
Select the second visualisation
To change the size of the dashboard, you can click and pull the handles on the edges of the dashboard.
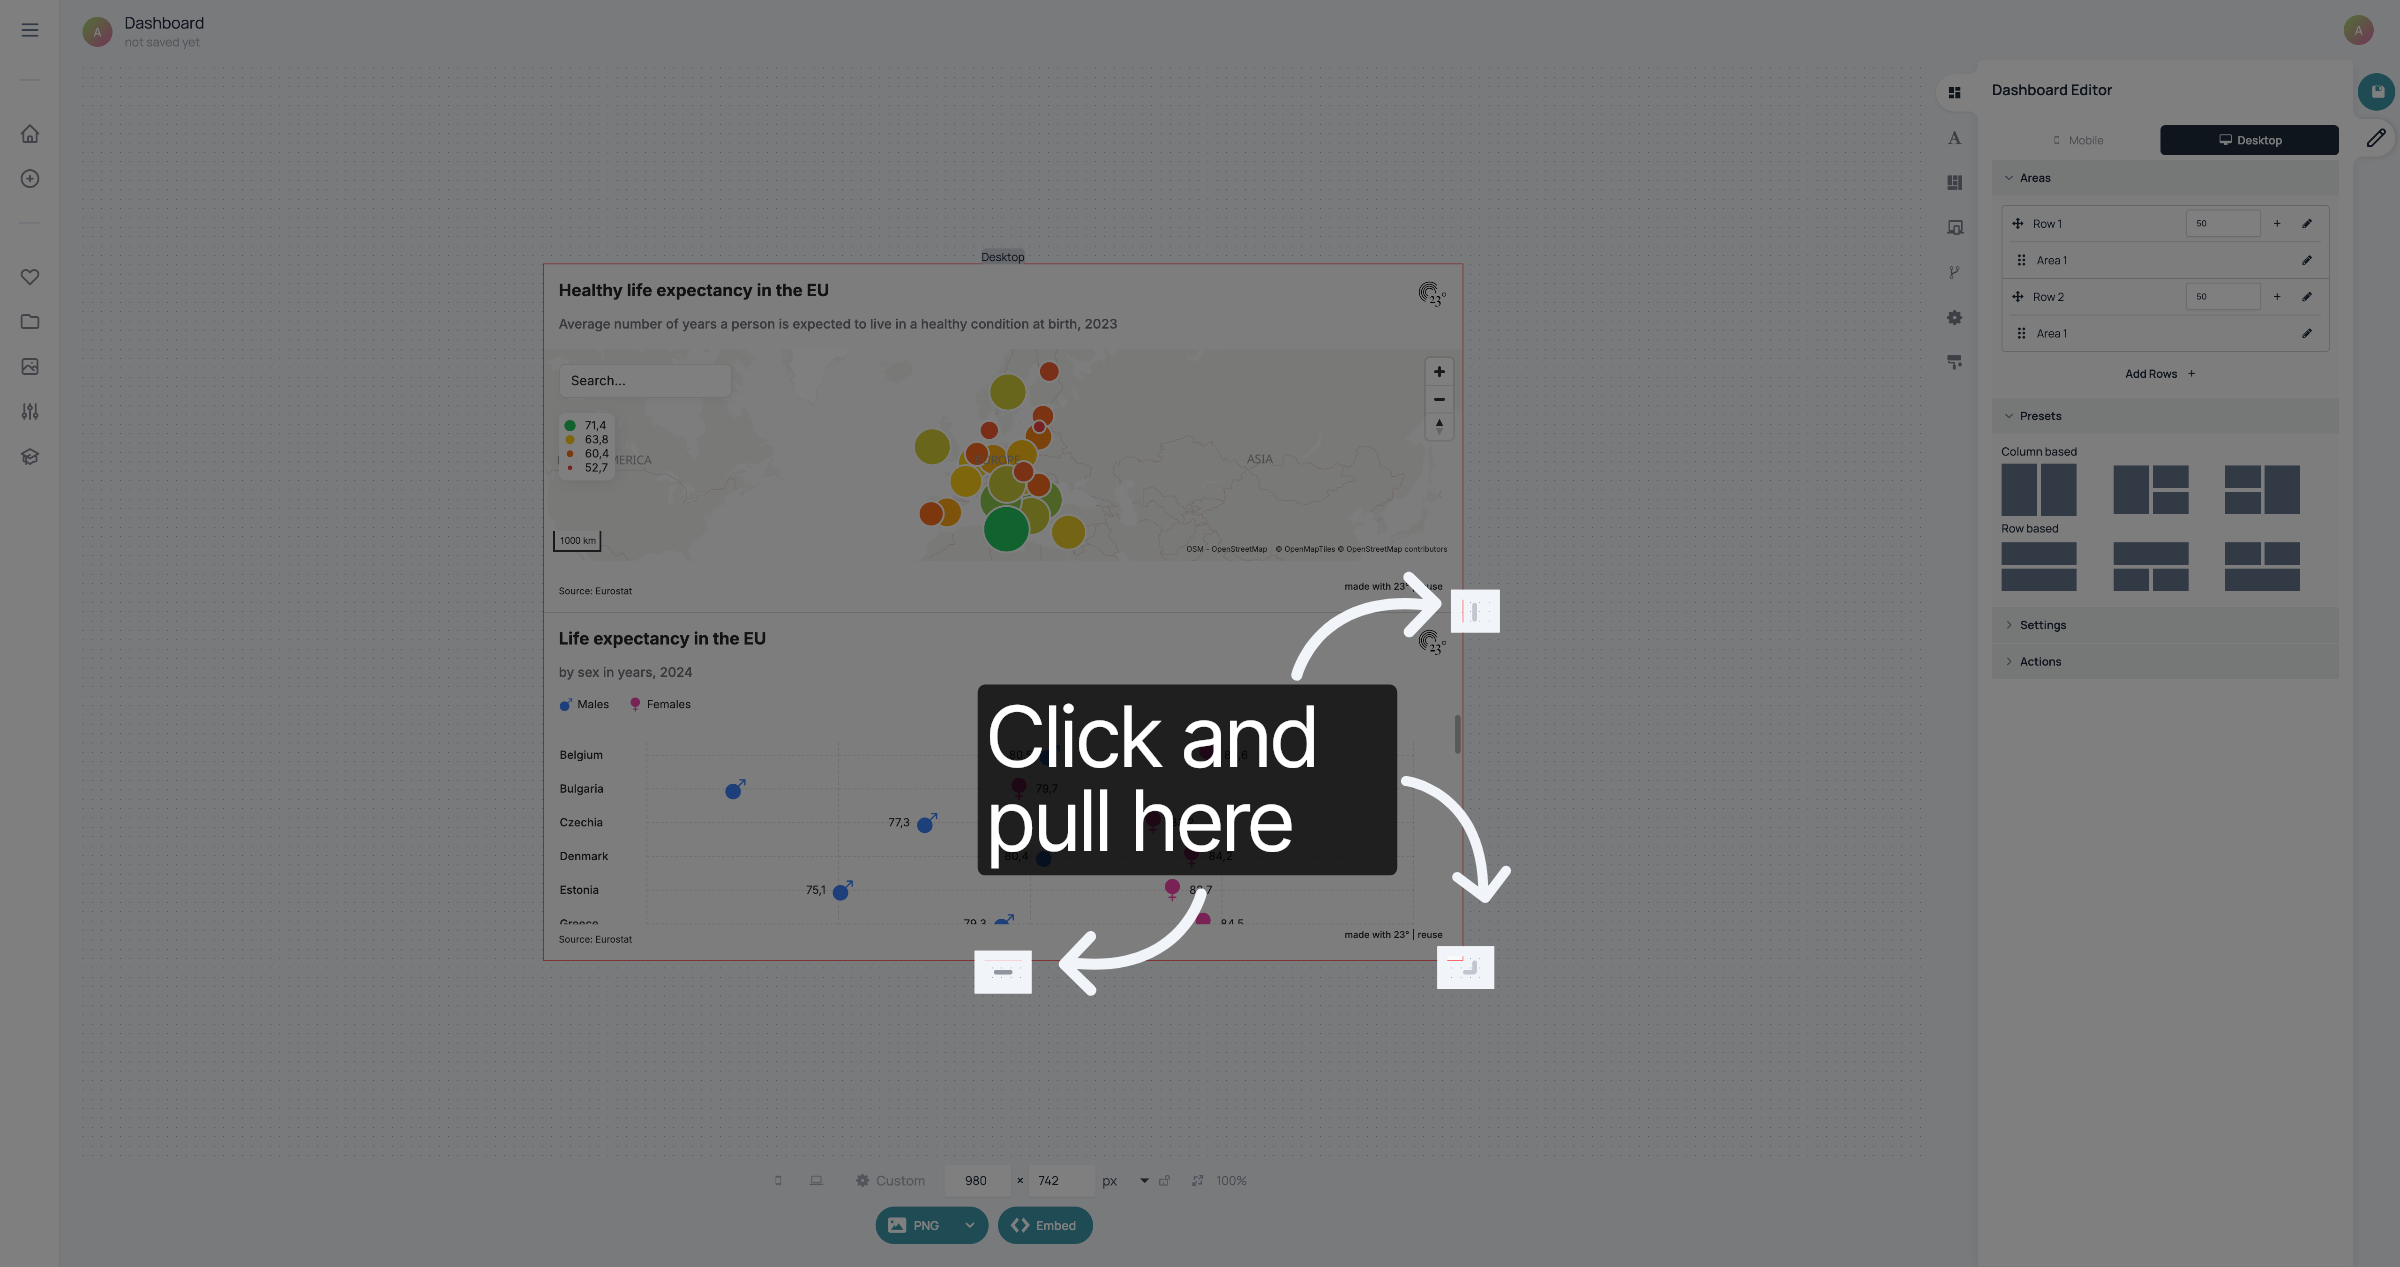
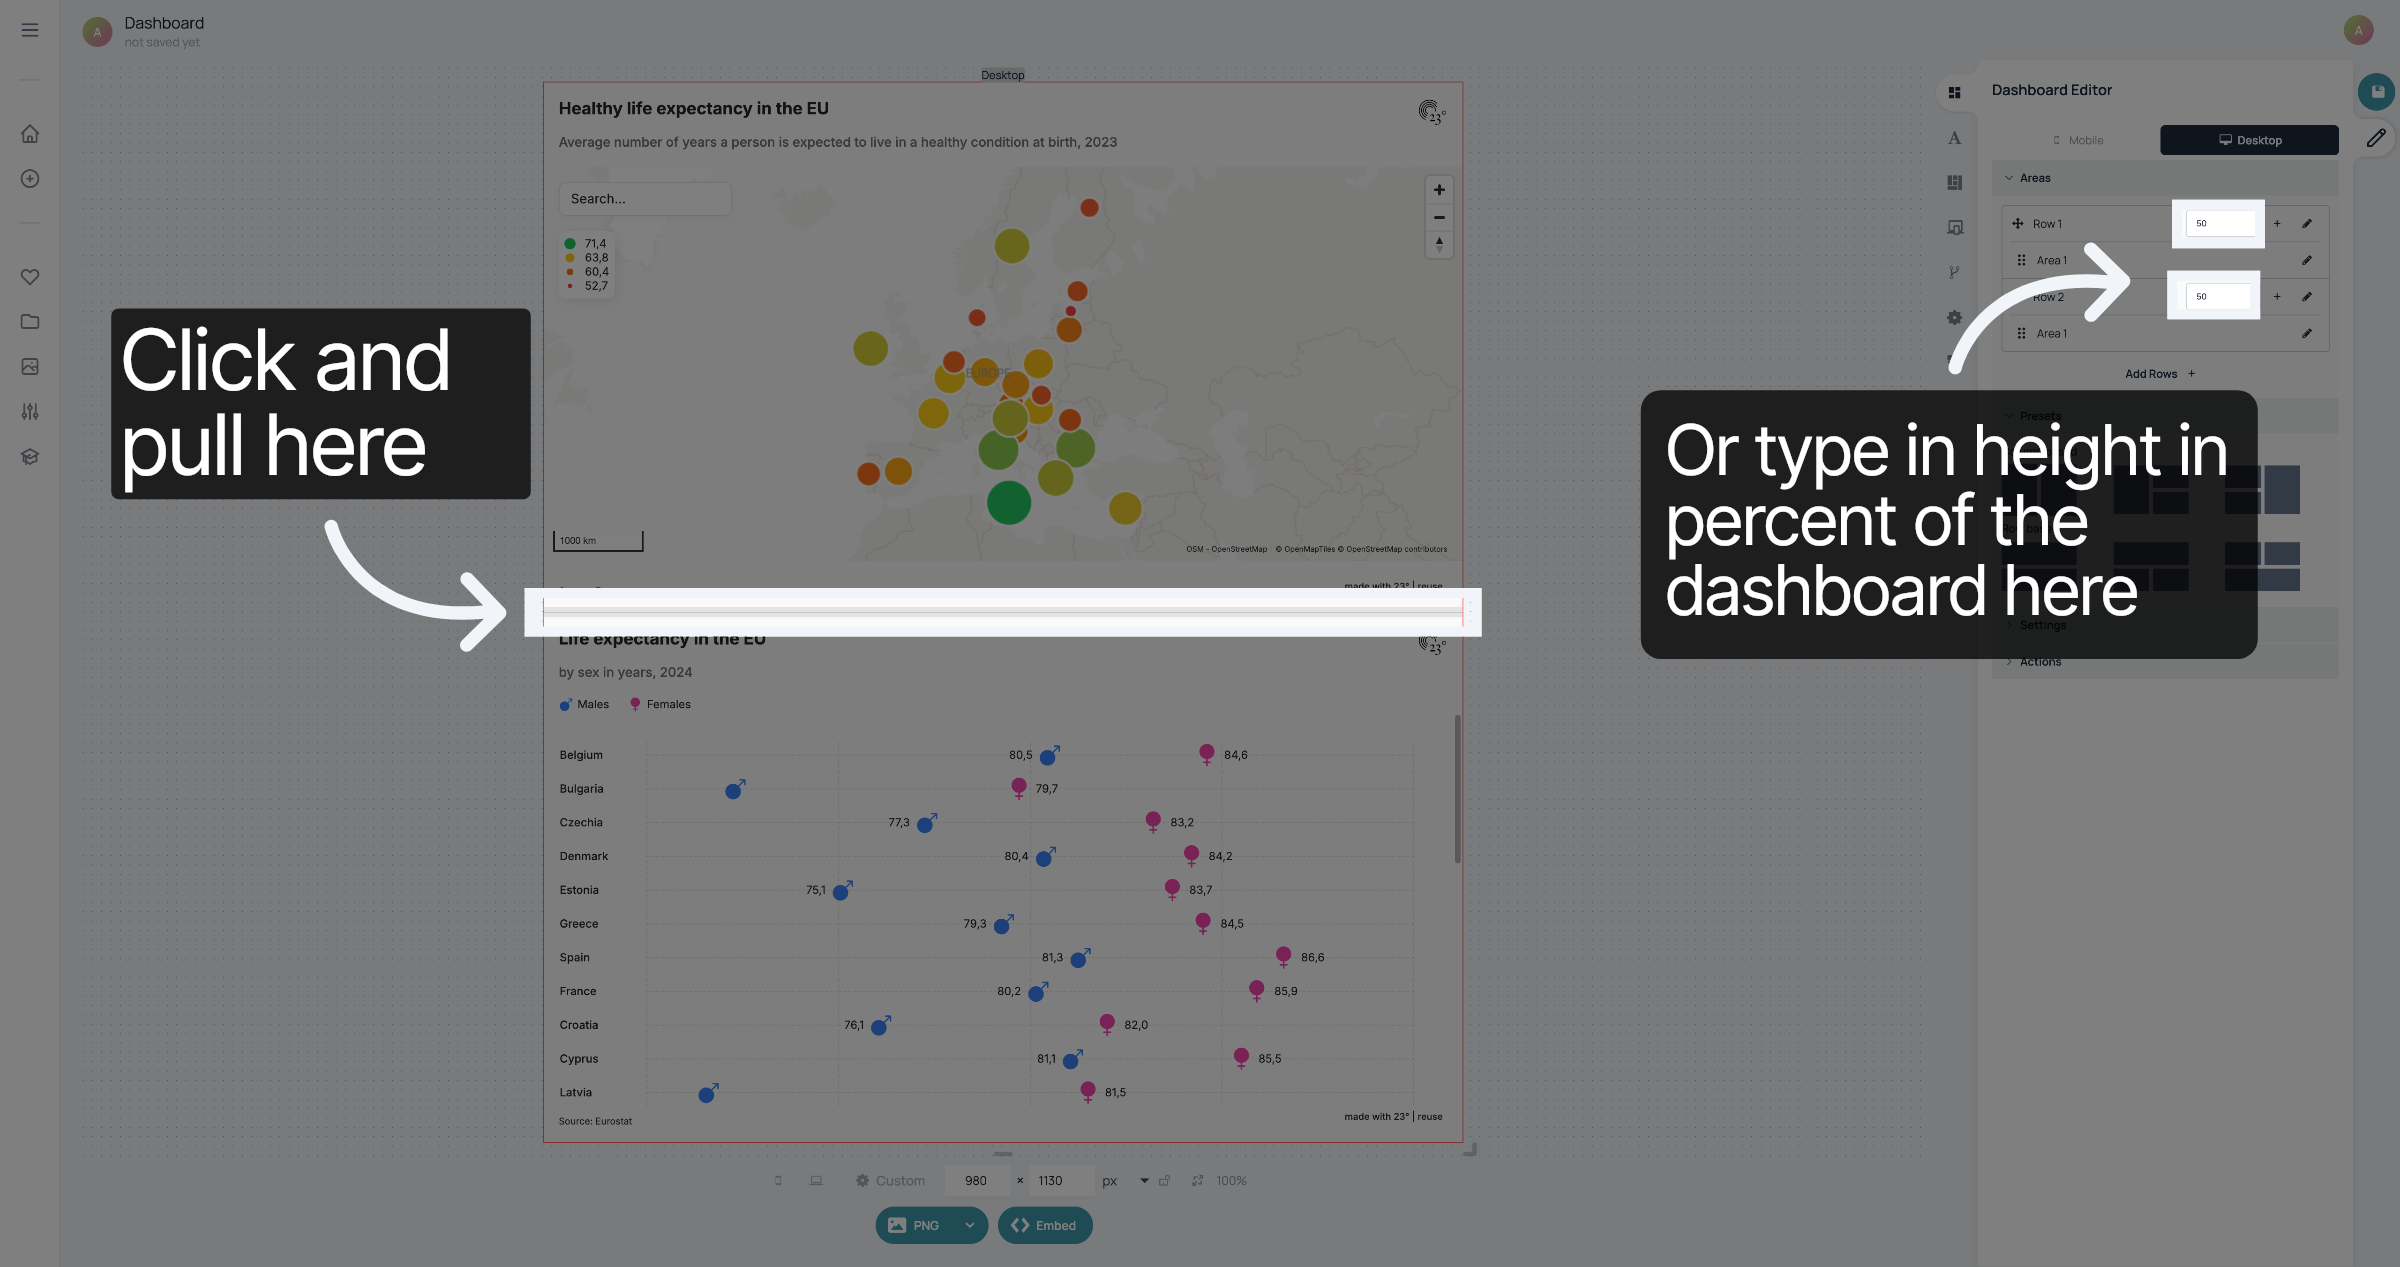
To change the ratio of the visualisations in the dashboard you can click and pull on the border between the visualisations. Alternatively, you can go to the rows in "Areas" and type in the height each visualisation should take up. The numbers are the percentage of the dashboard.
Don't forget to save your changes.
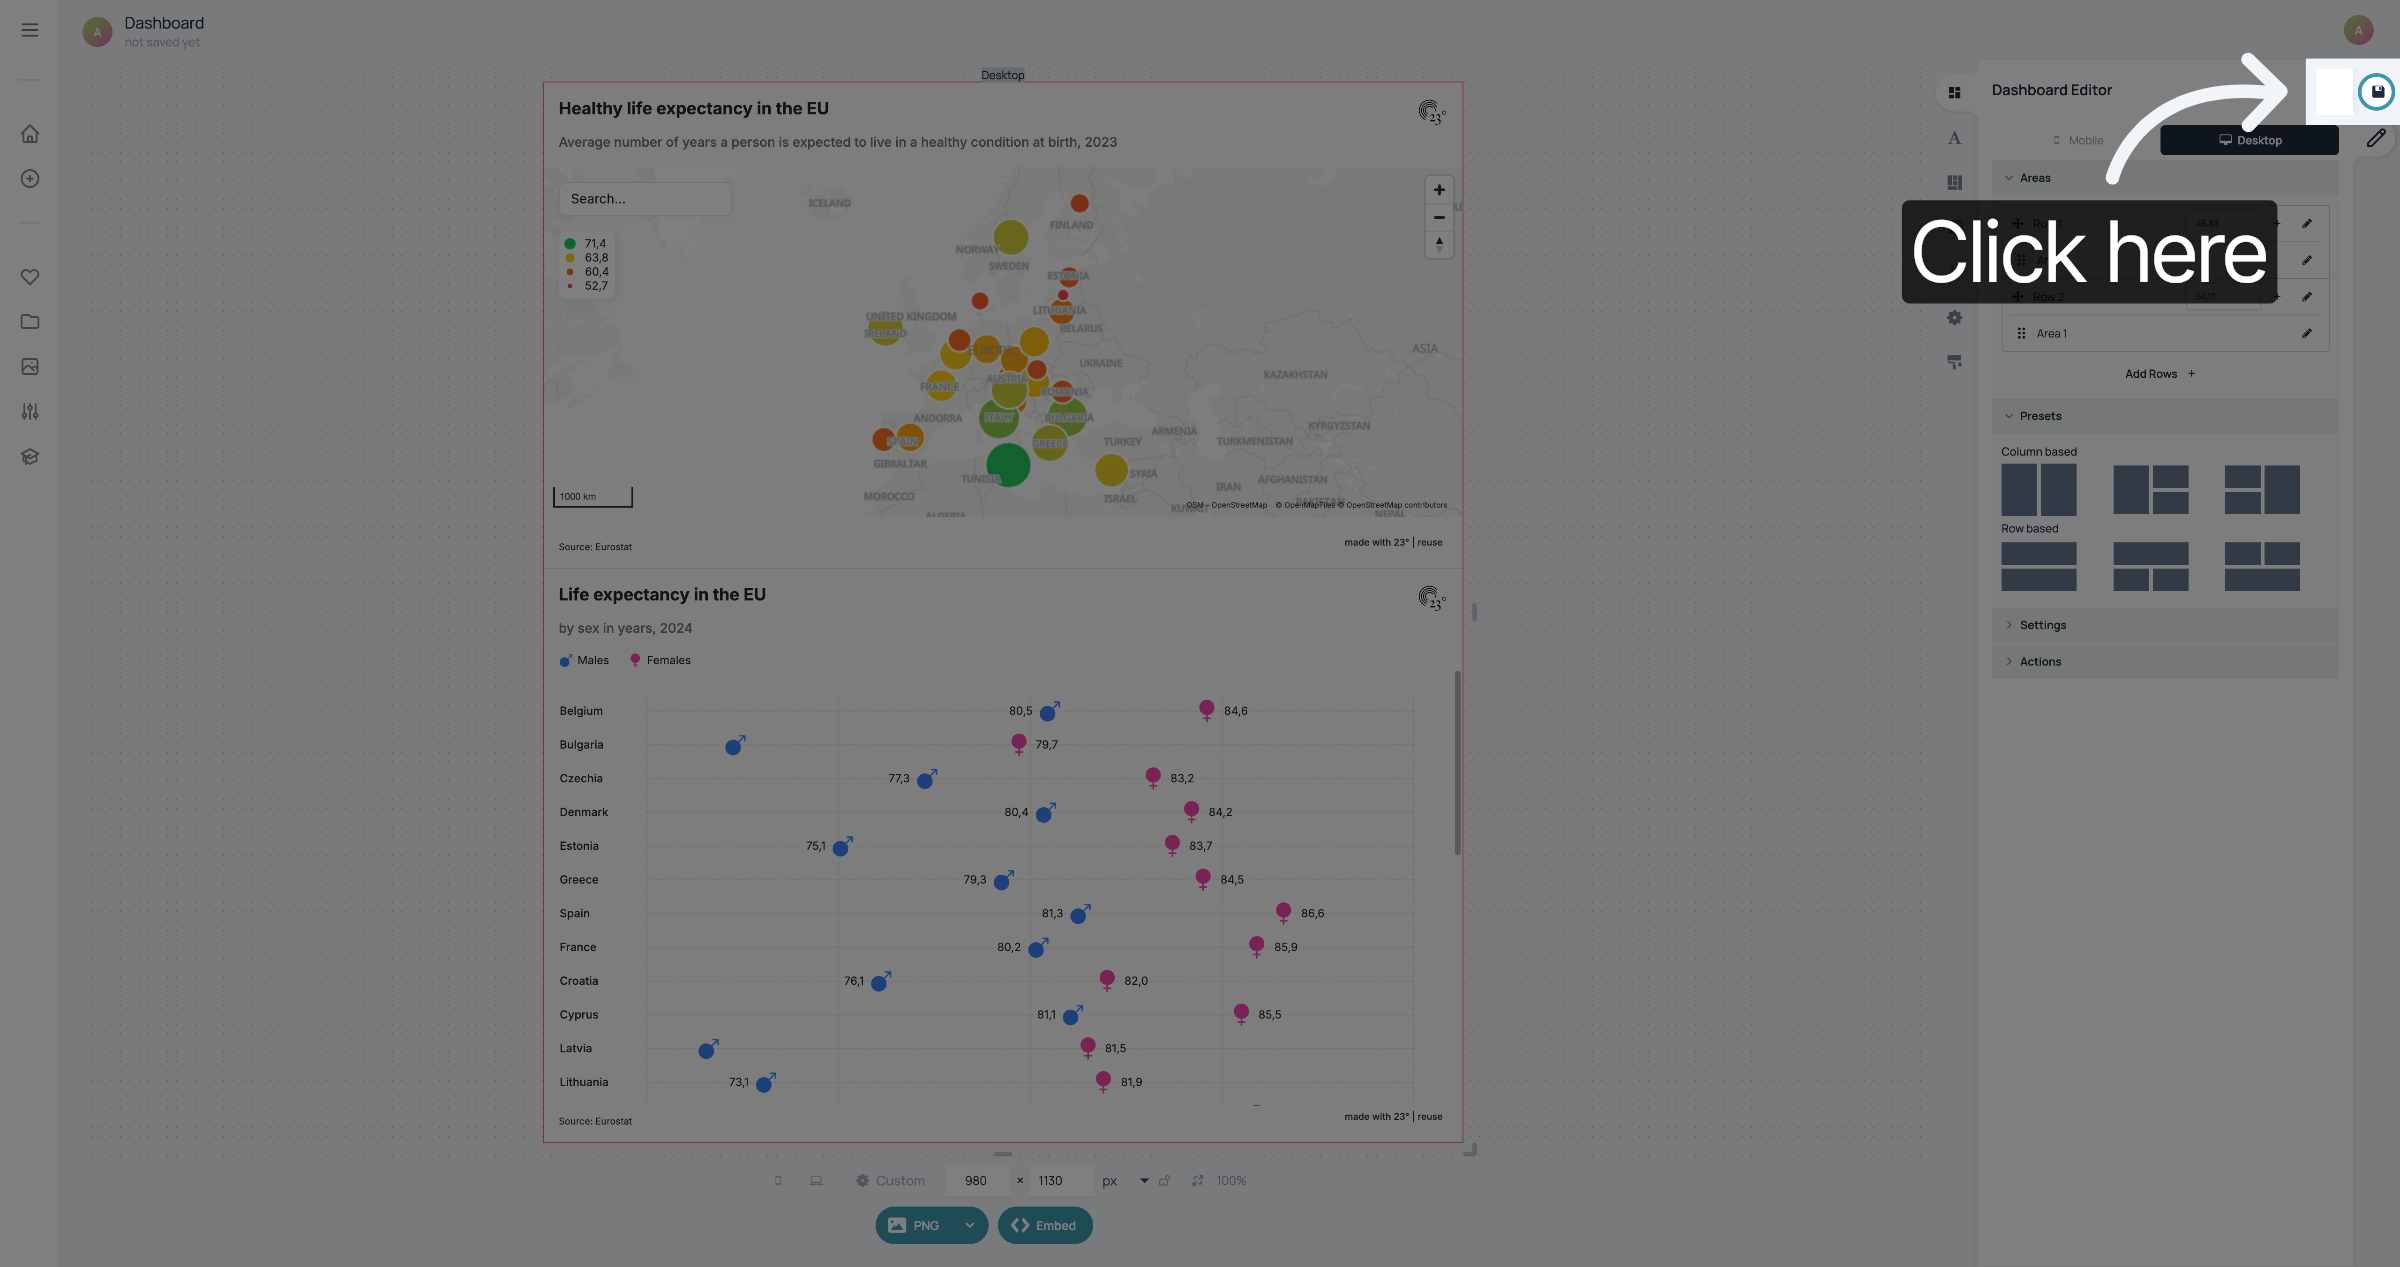
You have successfully created a dashboard.