How to use Dashboard actions
This tutorial explains how to configure actions in a dashboard to connect the visualisations within it.
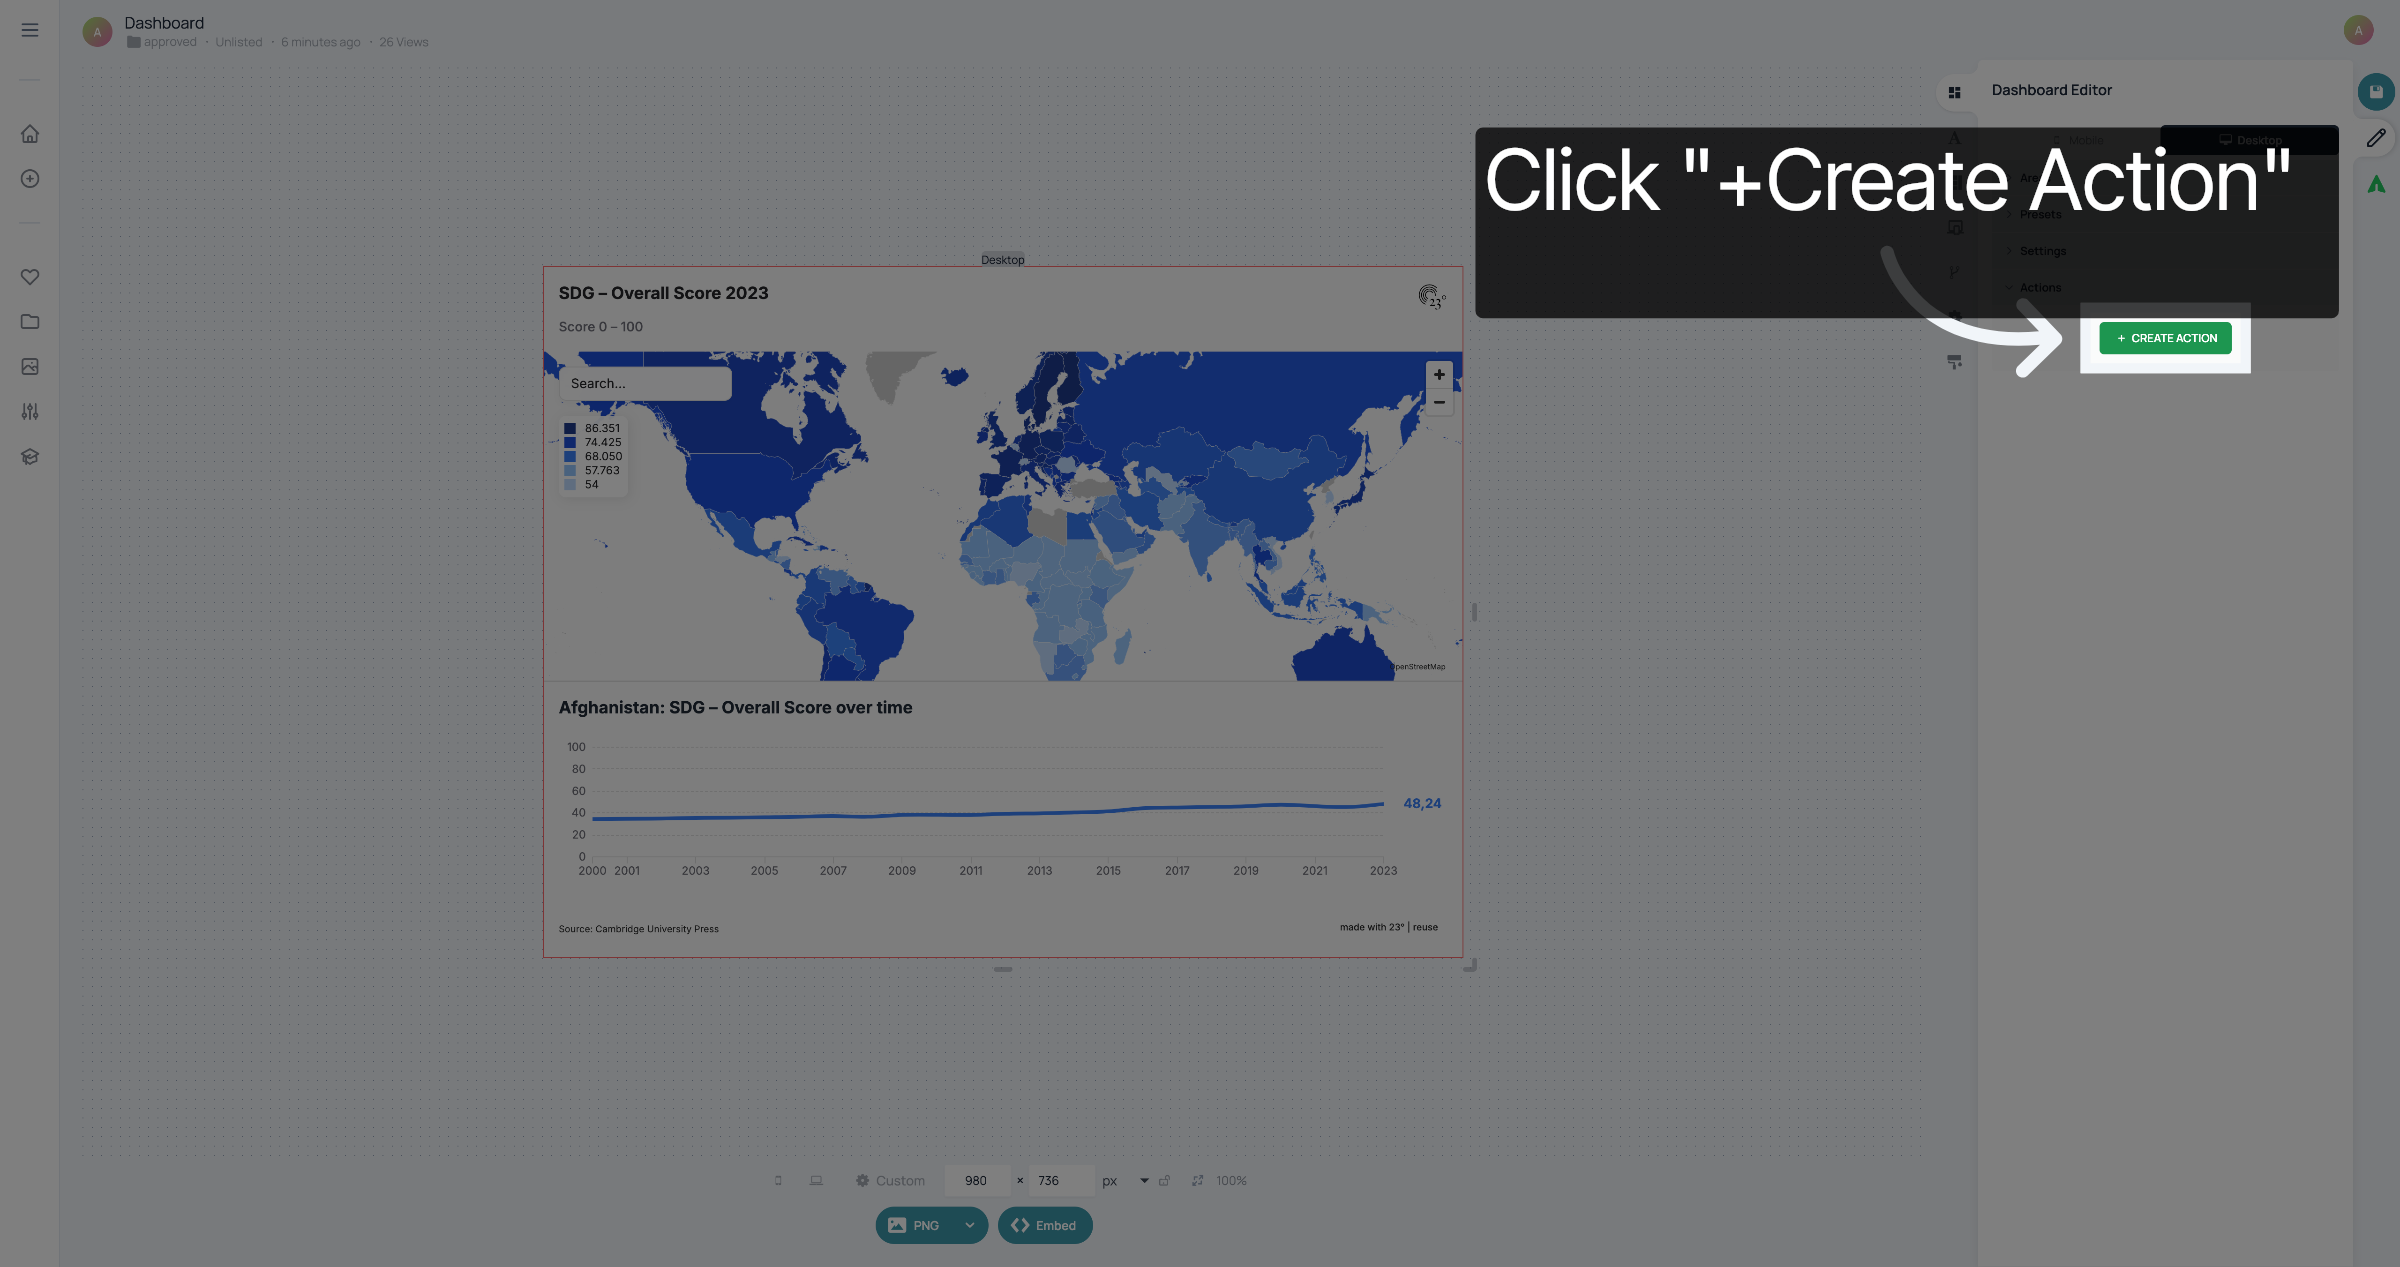
Open your dashboard and click "+Create Action".
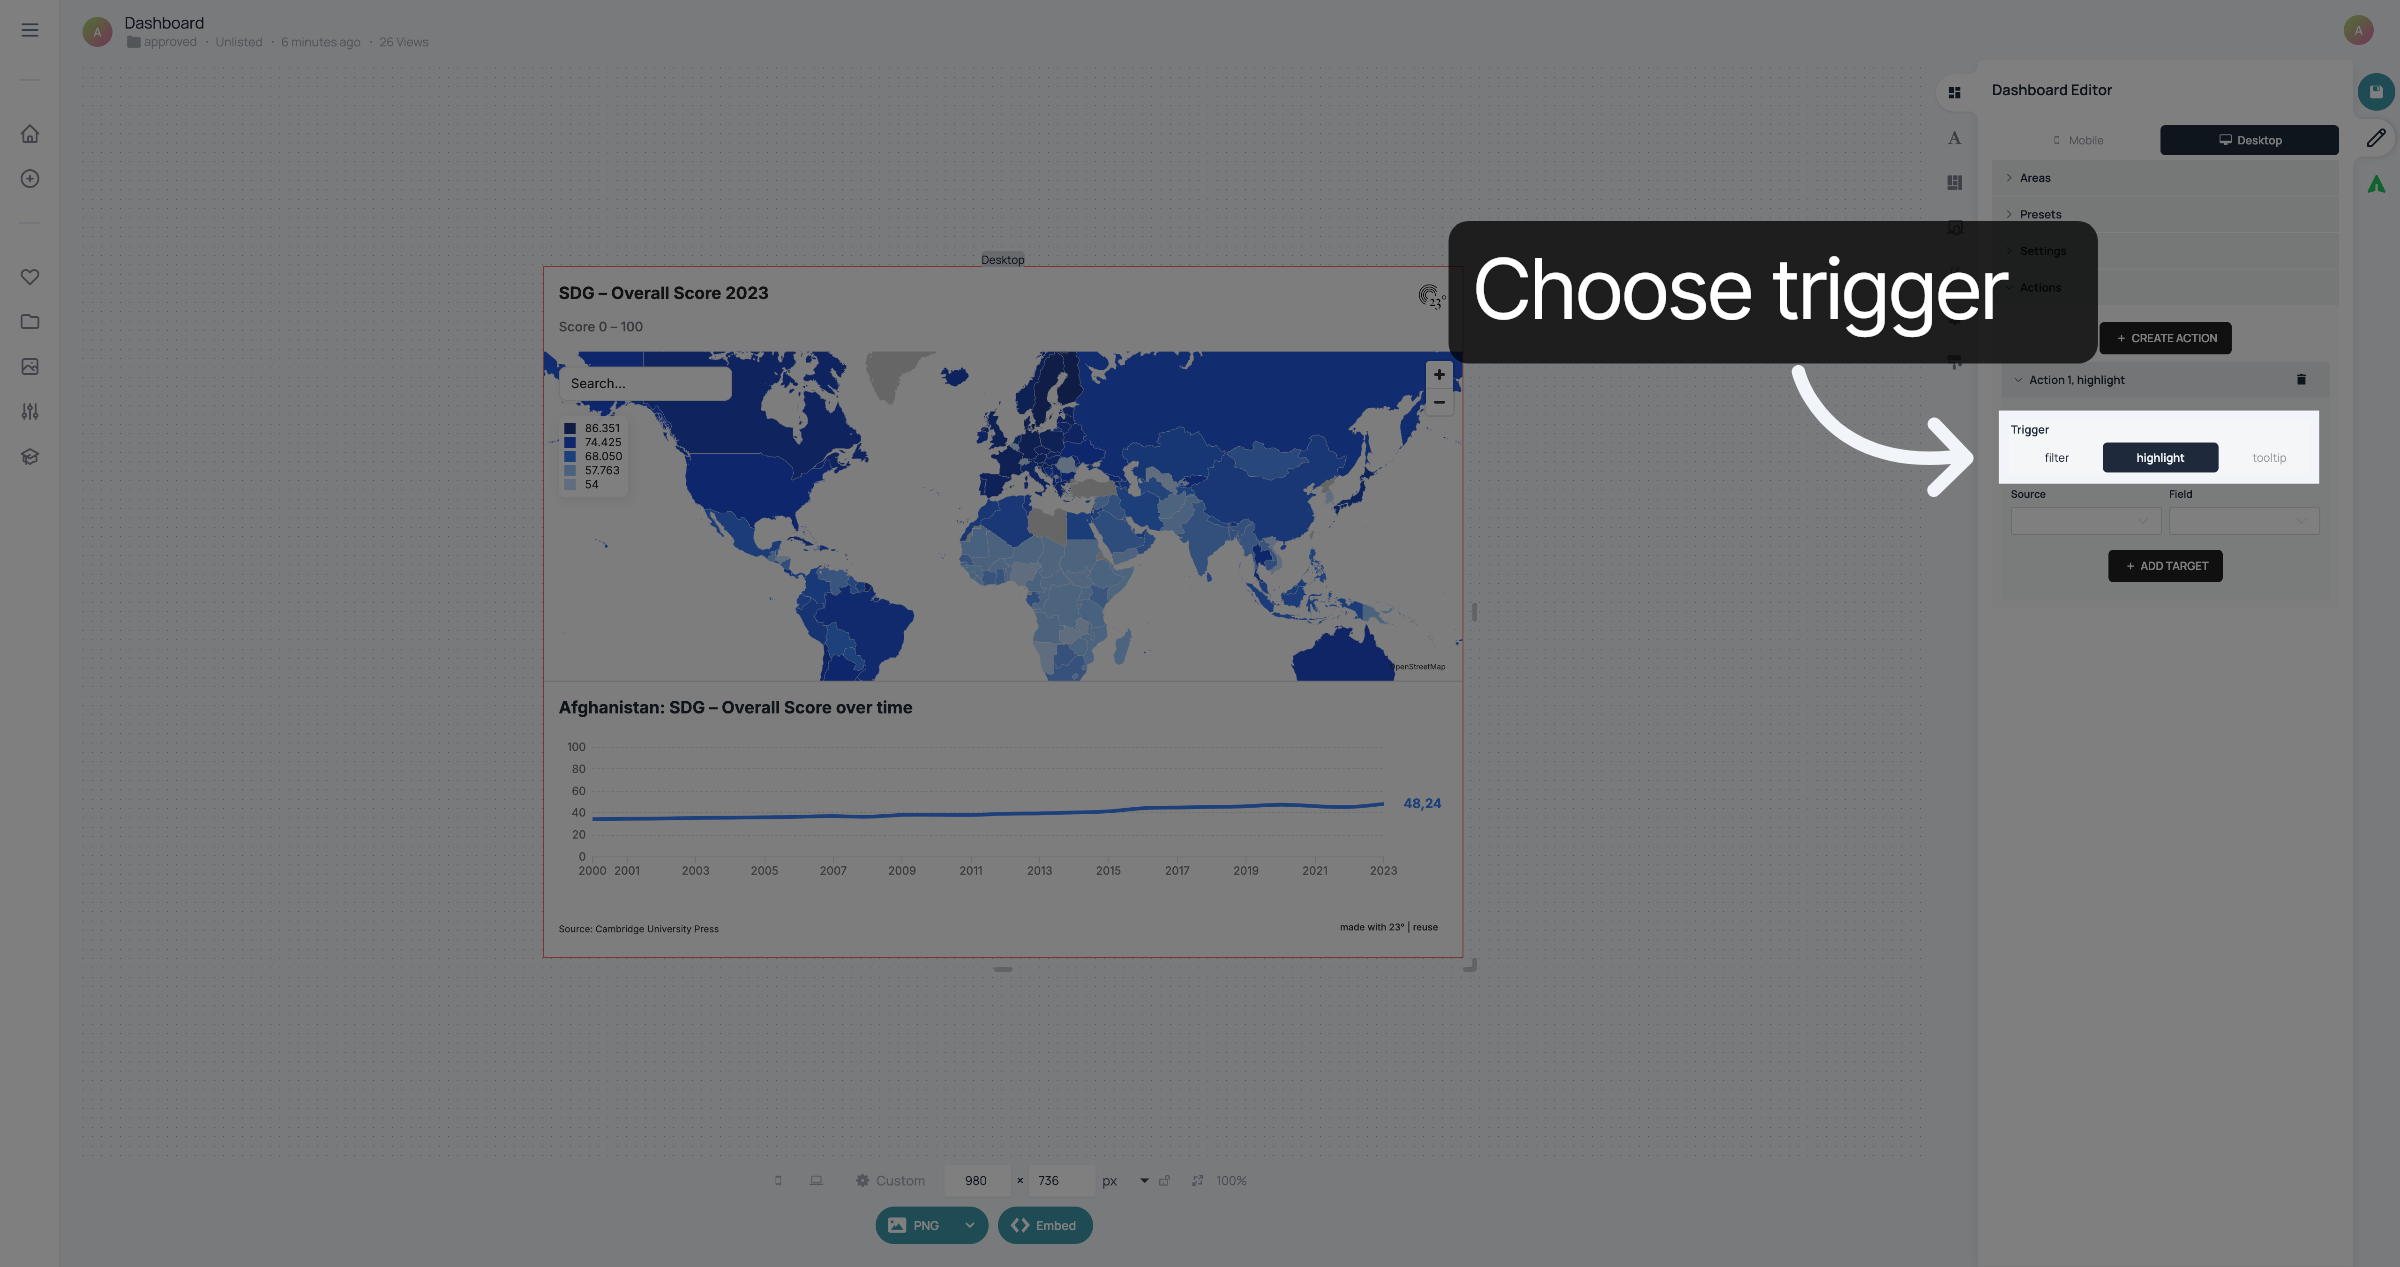
Choose a trigger. The trigger decides which type of interaction with the visualisation triggers the action. "Filter" can be used if there is a filter in your visualisation. "Highlight" can be used on maps. When your map has a hover tooltip and the user hovers over it, it triggers the action. "Tooltip" means that as soon as the tooltip is triggered on click, the action takes place. In this case, we used "highlight".
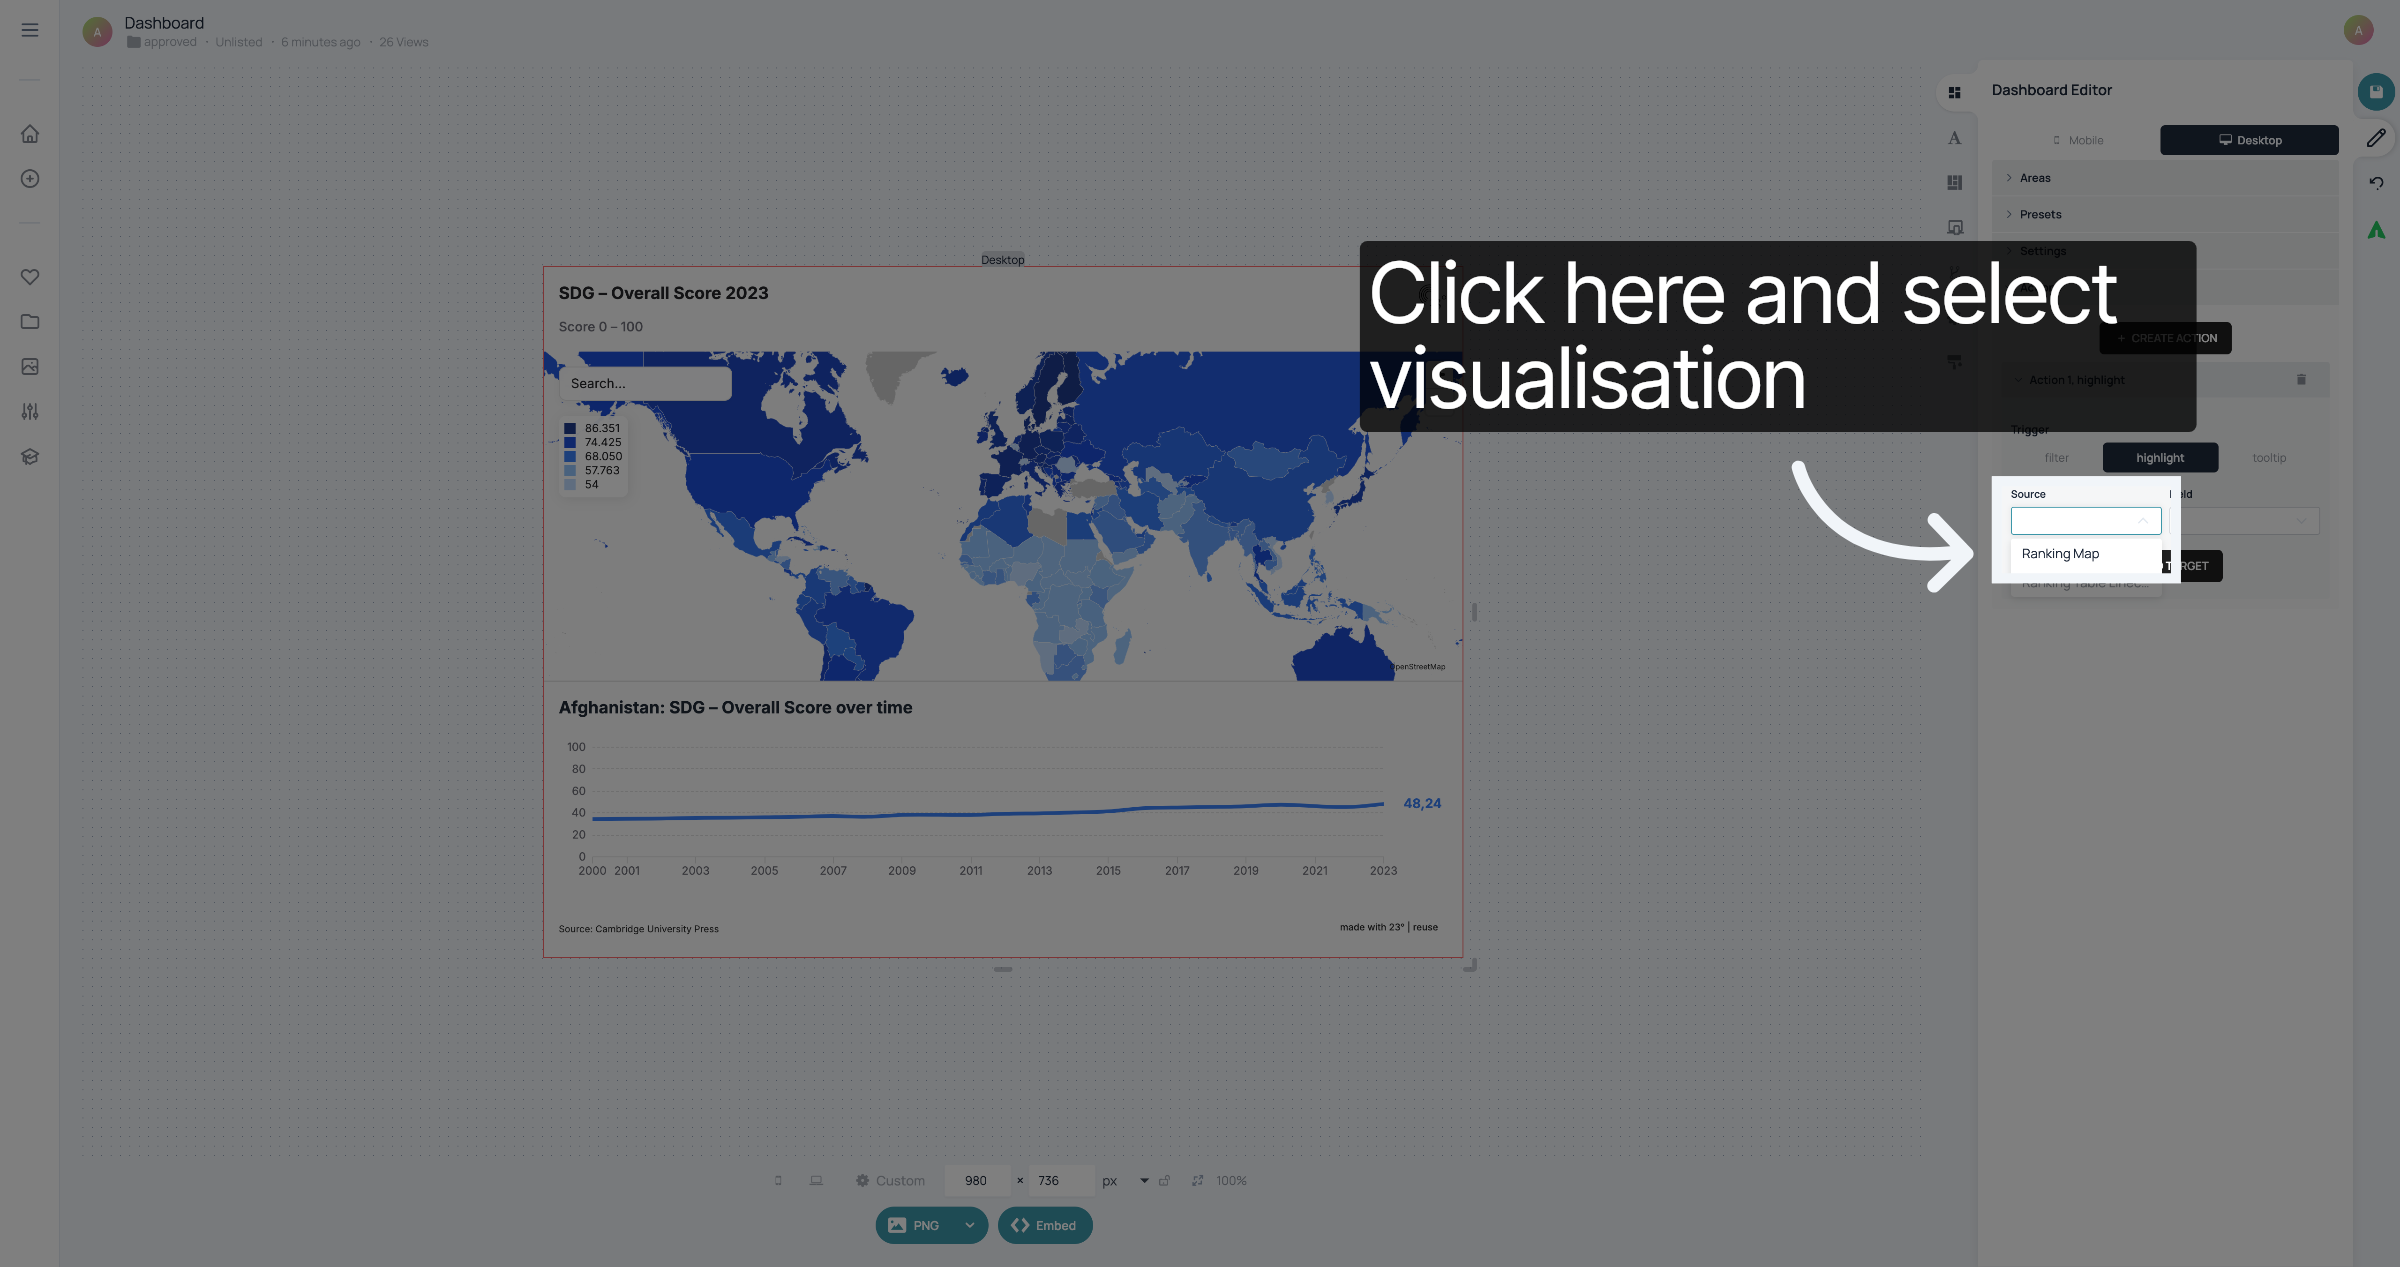
Click here to select the visualisation in which the user will be able to trigger the action.
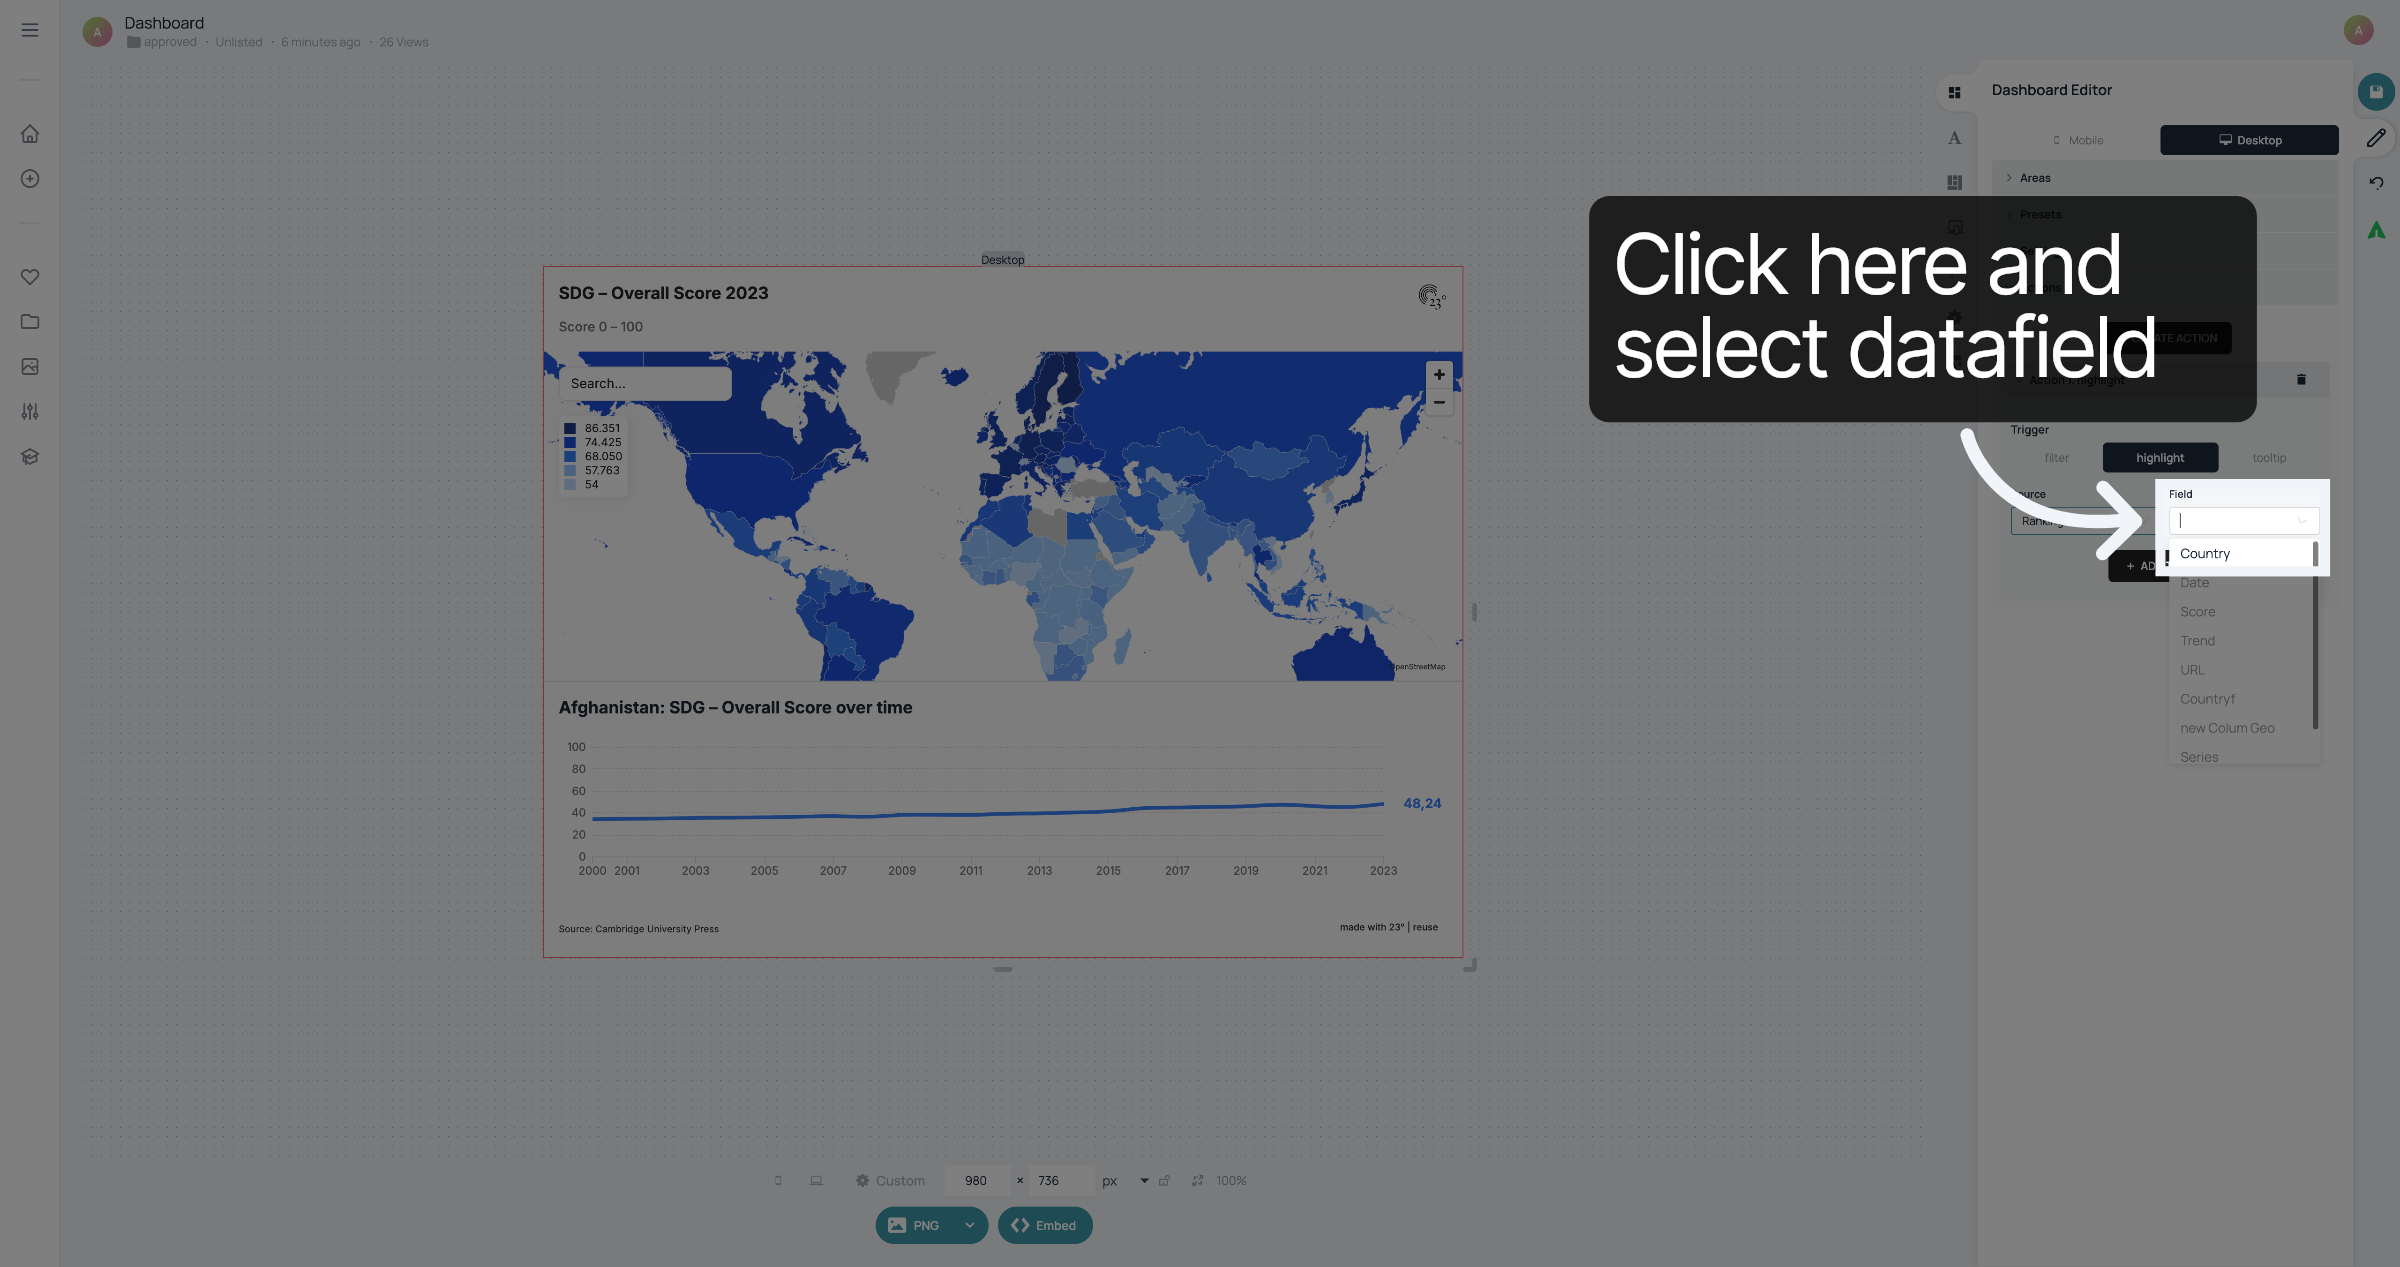
Next, select the column title of the data field which will be filtered, highlighted or will have a tooltip. In this case it's Country.
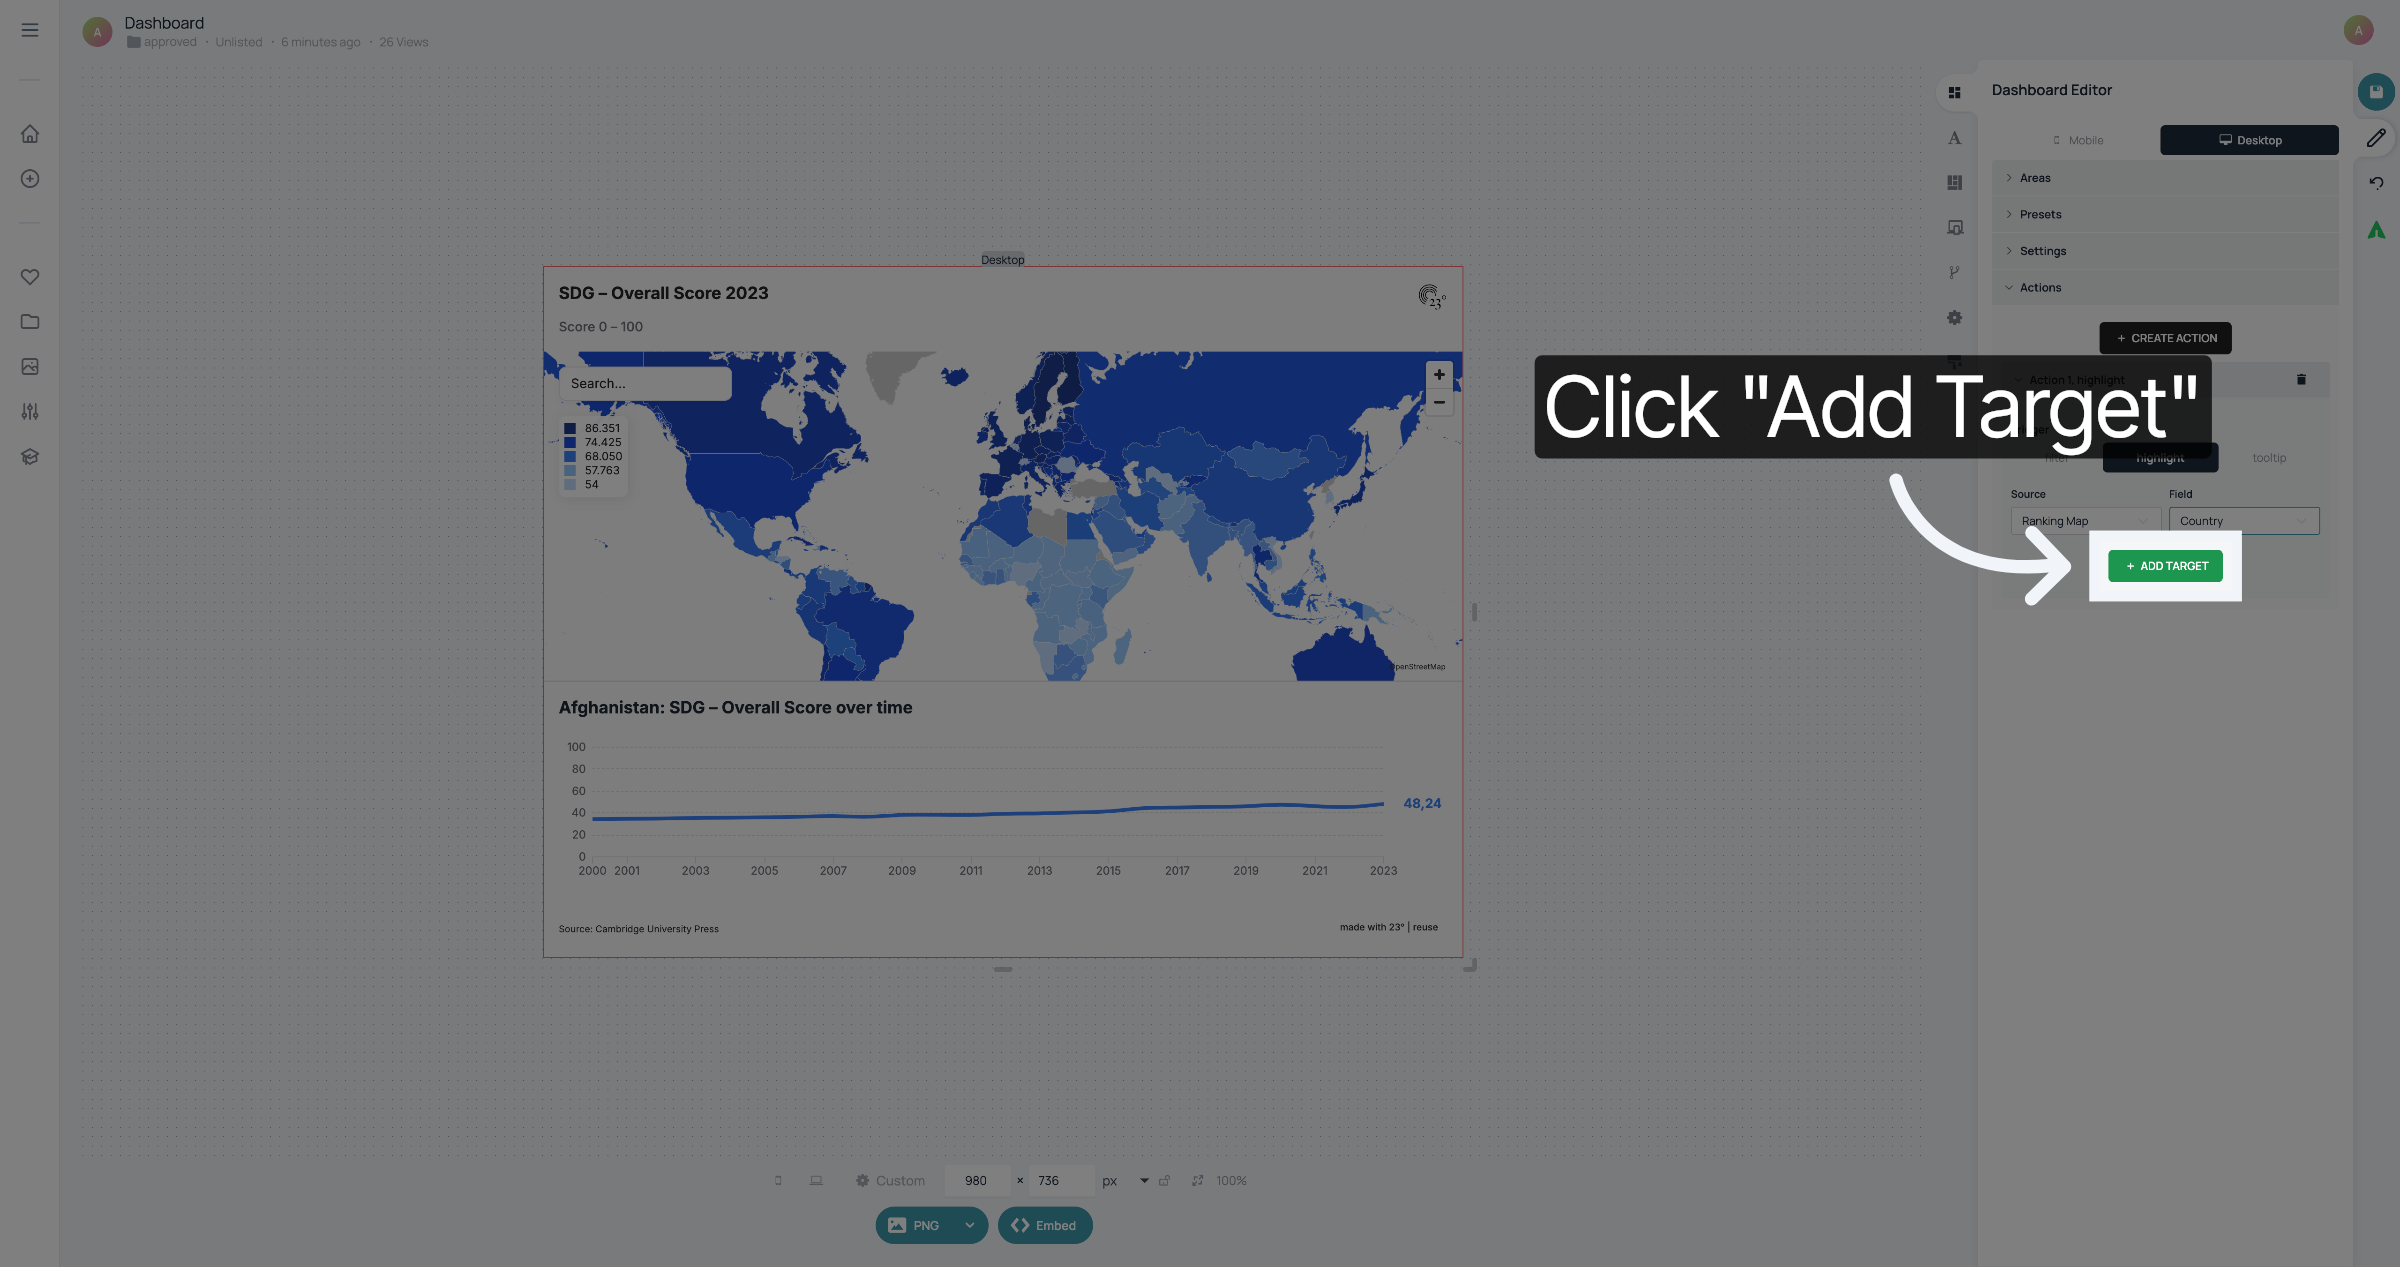
Click "Add Target" to specify which visualisation will be filtered by the action
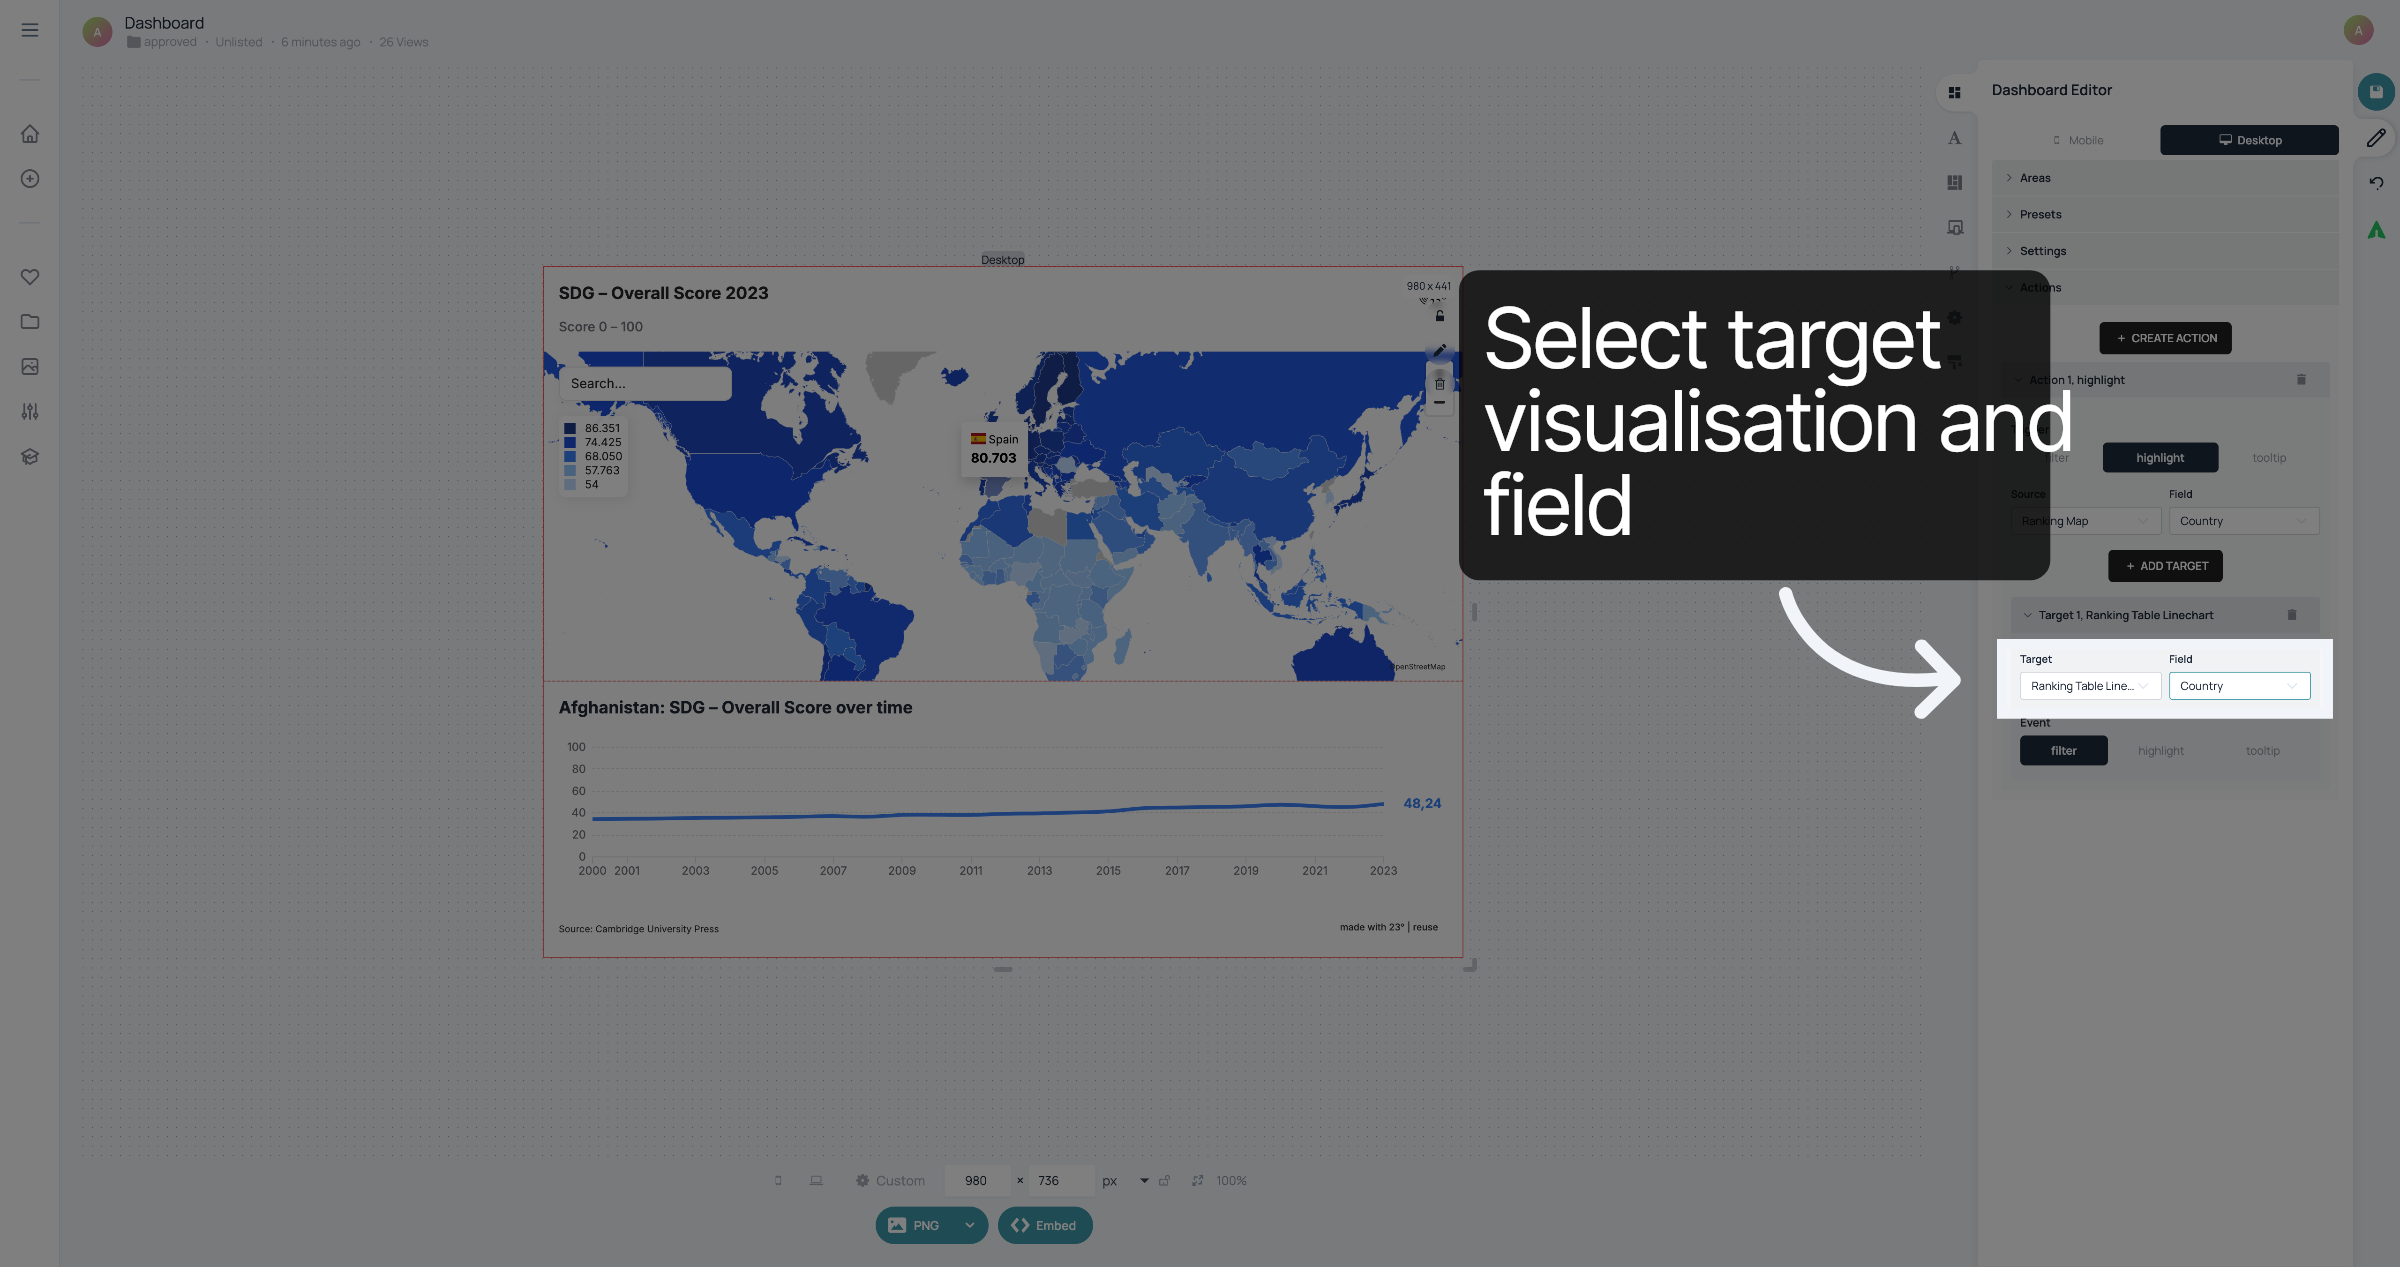
Select the name of the visualisation and which the datafield that corresponds with the datafield in the first visualisation. It is very important that the content of the column in the dataset of the first visualisation is spelled exactly like the content of the column in the dataset of the first visualisation
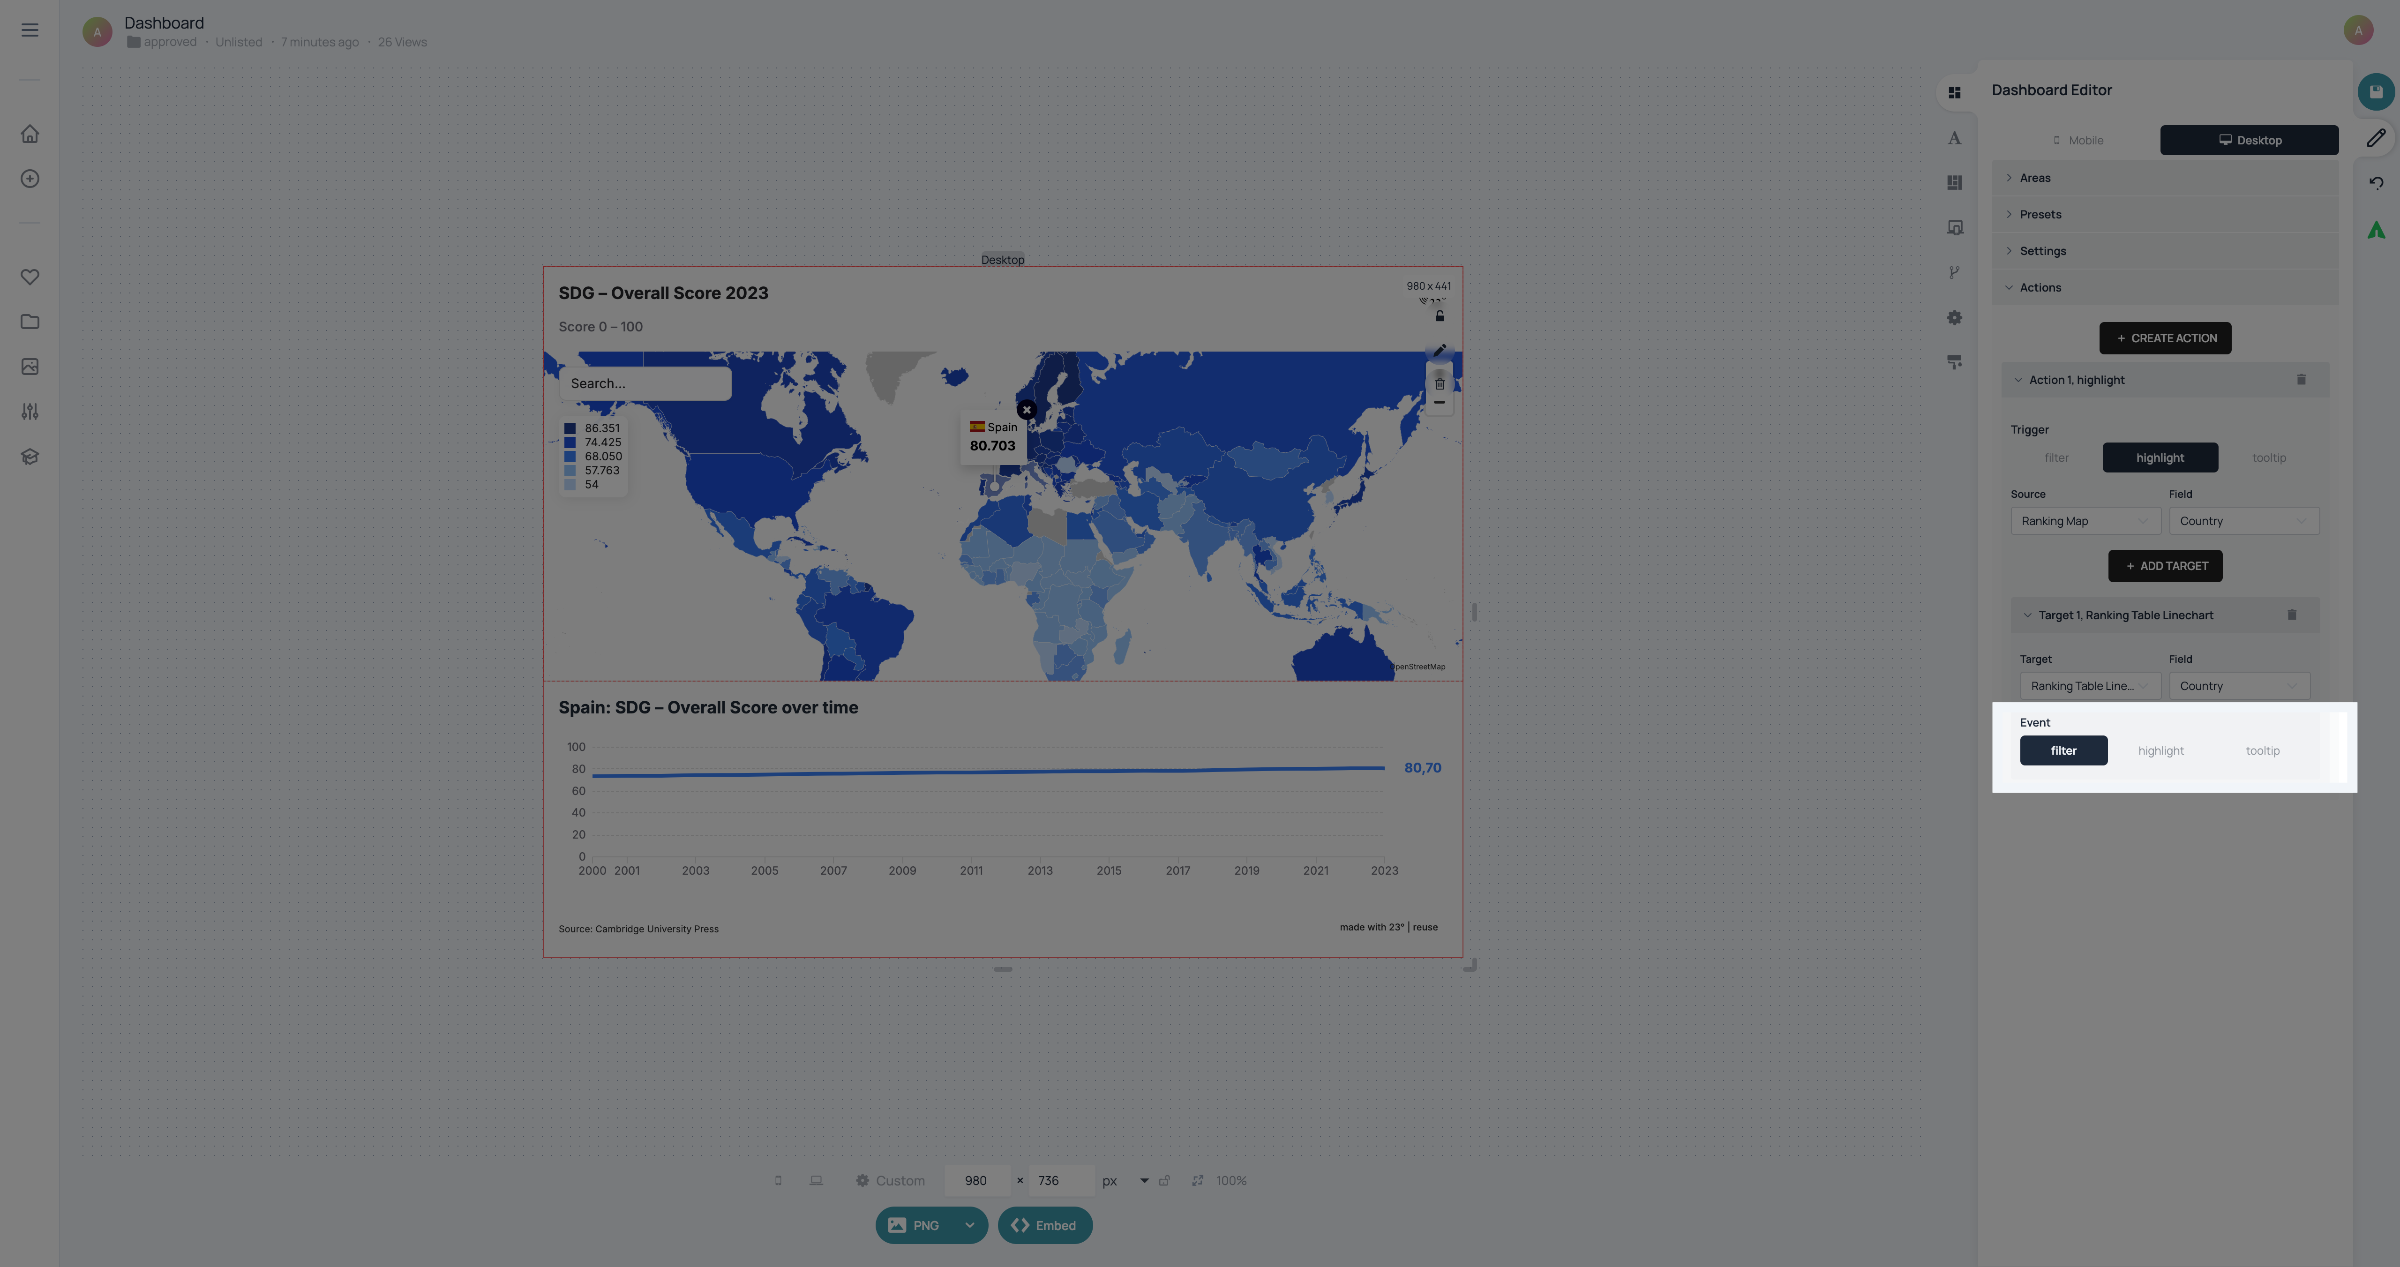
Select, which event should be triggered when the action takes place. The second visualisation can either be filtered, highlighted or a tooltip can be triggered. In this case we want to filter the Linechart by country to show the data for the countries that are clicked above.
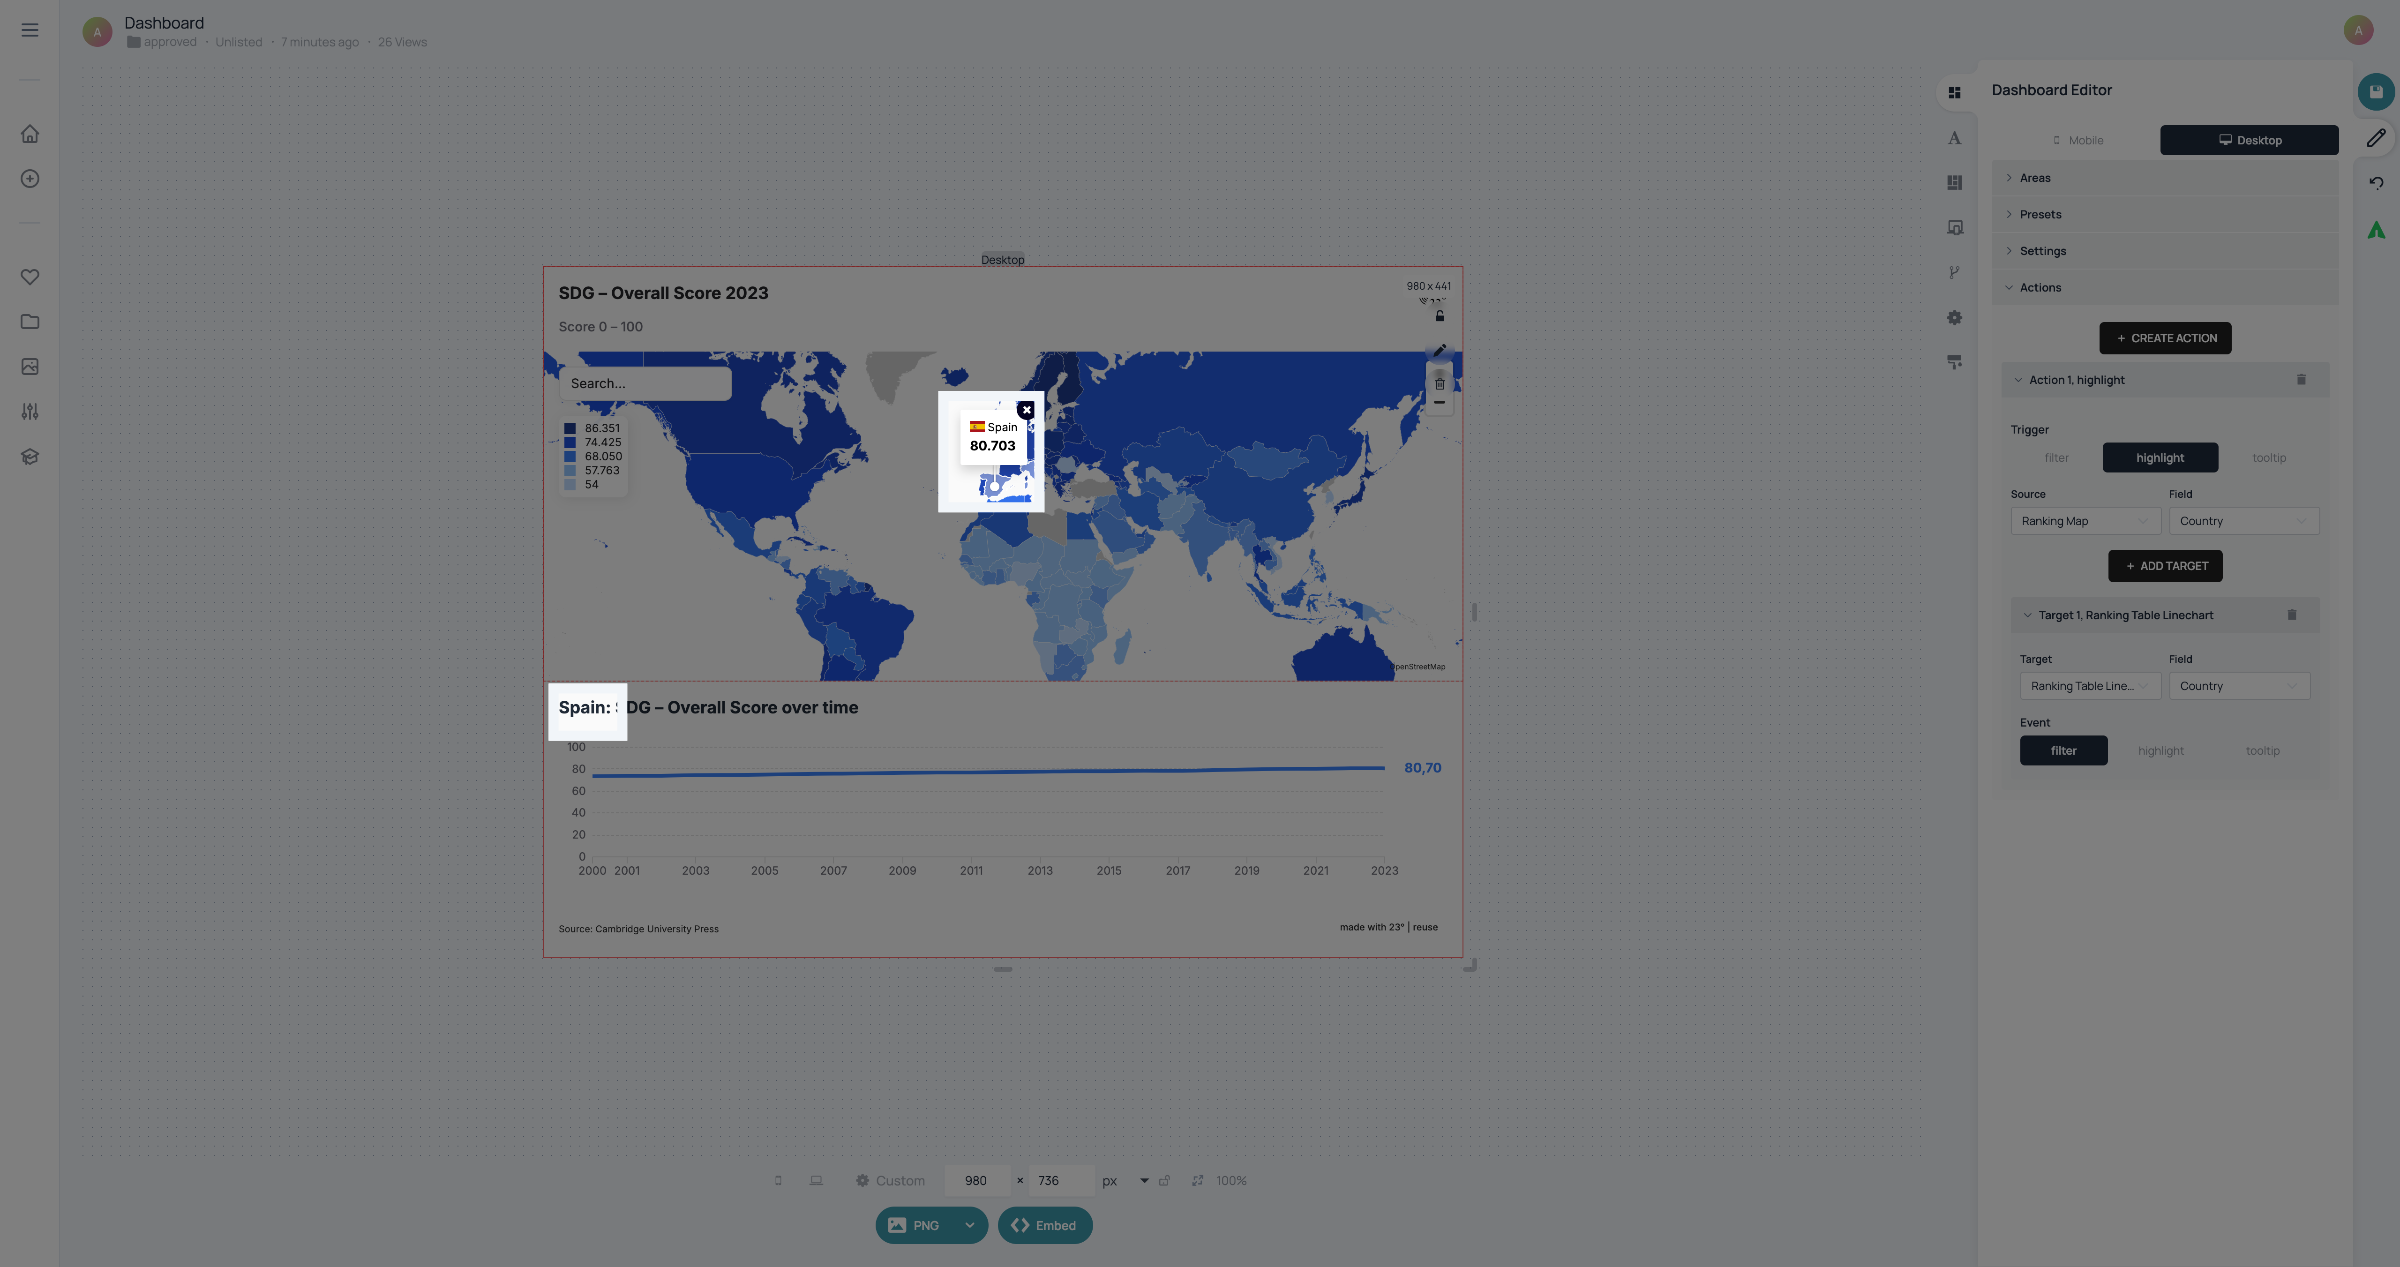
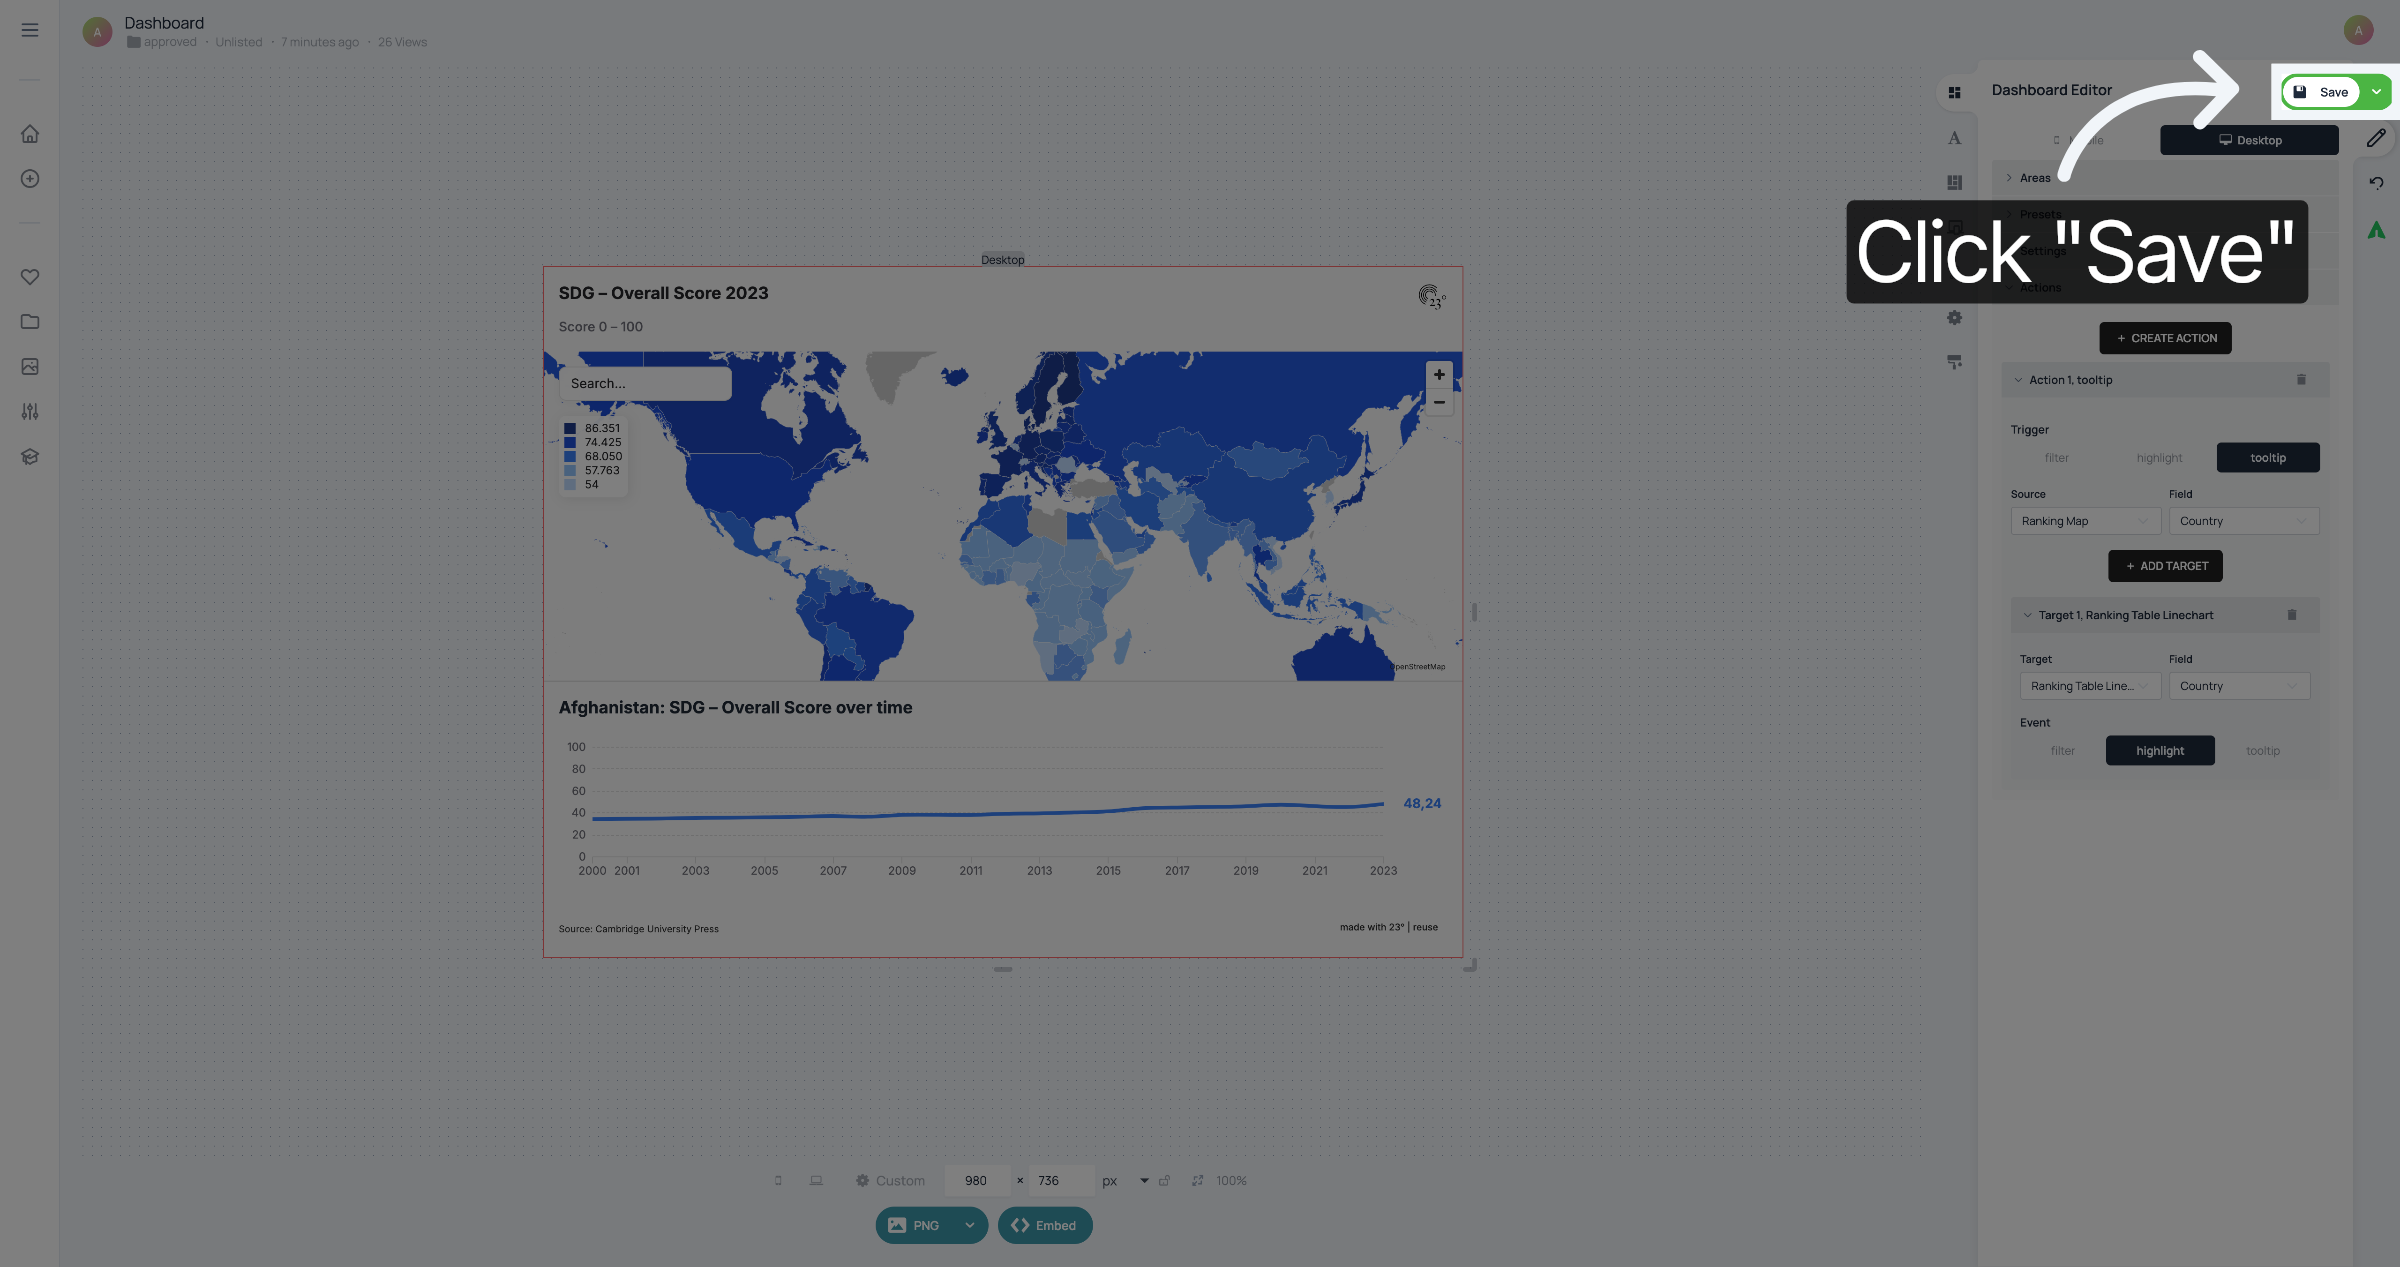
Now when you click on a country in the map, the linechart below is filtered to that country.
Don't forget to save your changes.
You have successfully configured a dashboard action.