Add Filter Dropdown to Statistic in 23degrees
This tutorial explains how to add a filter dropdown to a statistic in 23degrees.
In this example we have the SDG Scores of multiple countries over time displayed on the same time. I will show you how to add a dropdown statistic to make the chart more readable.
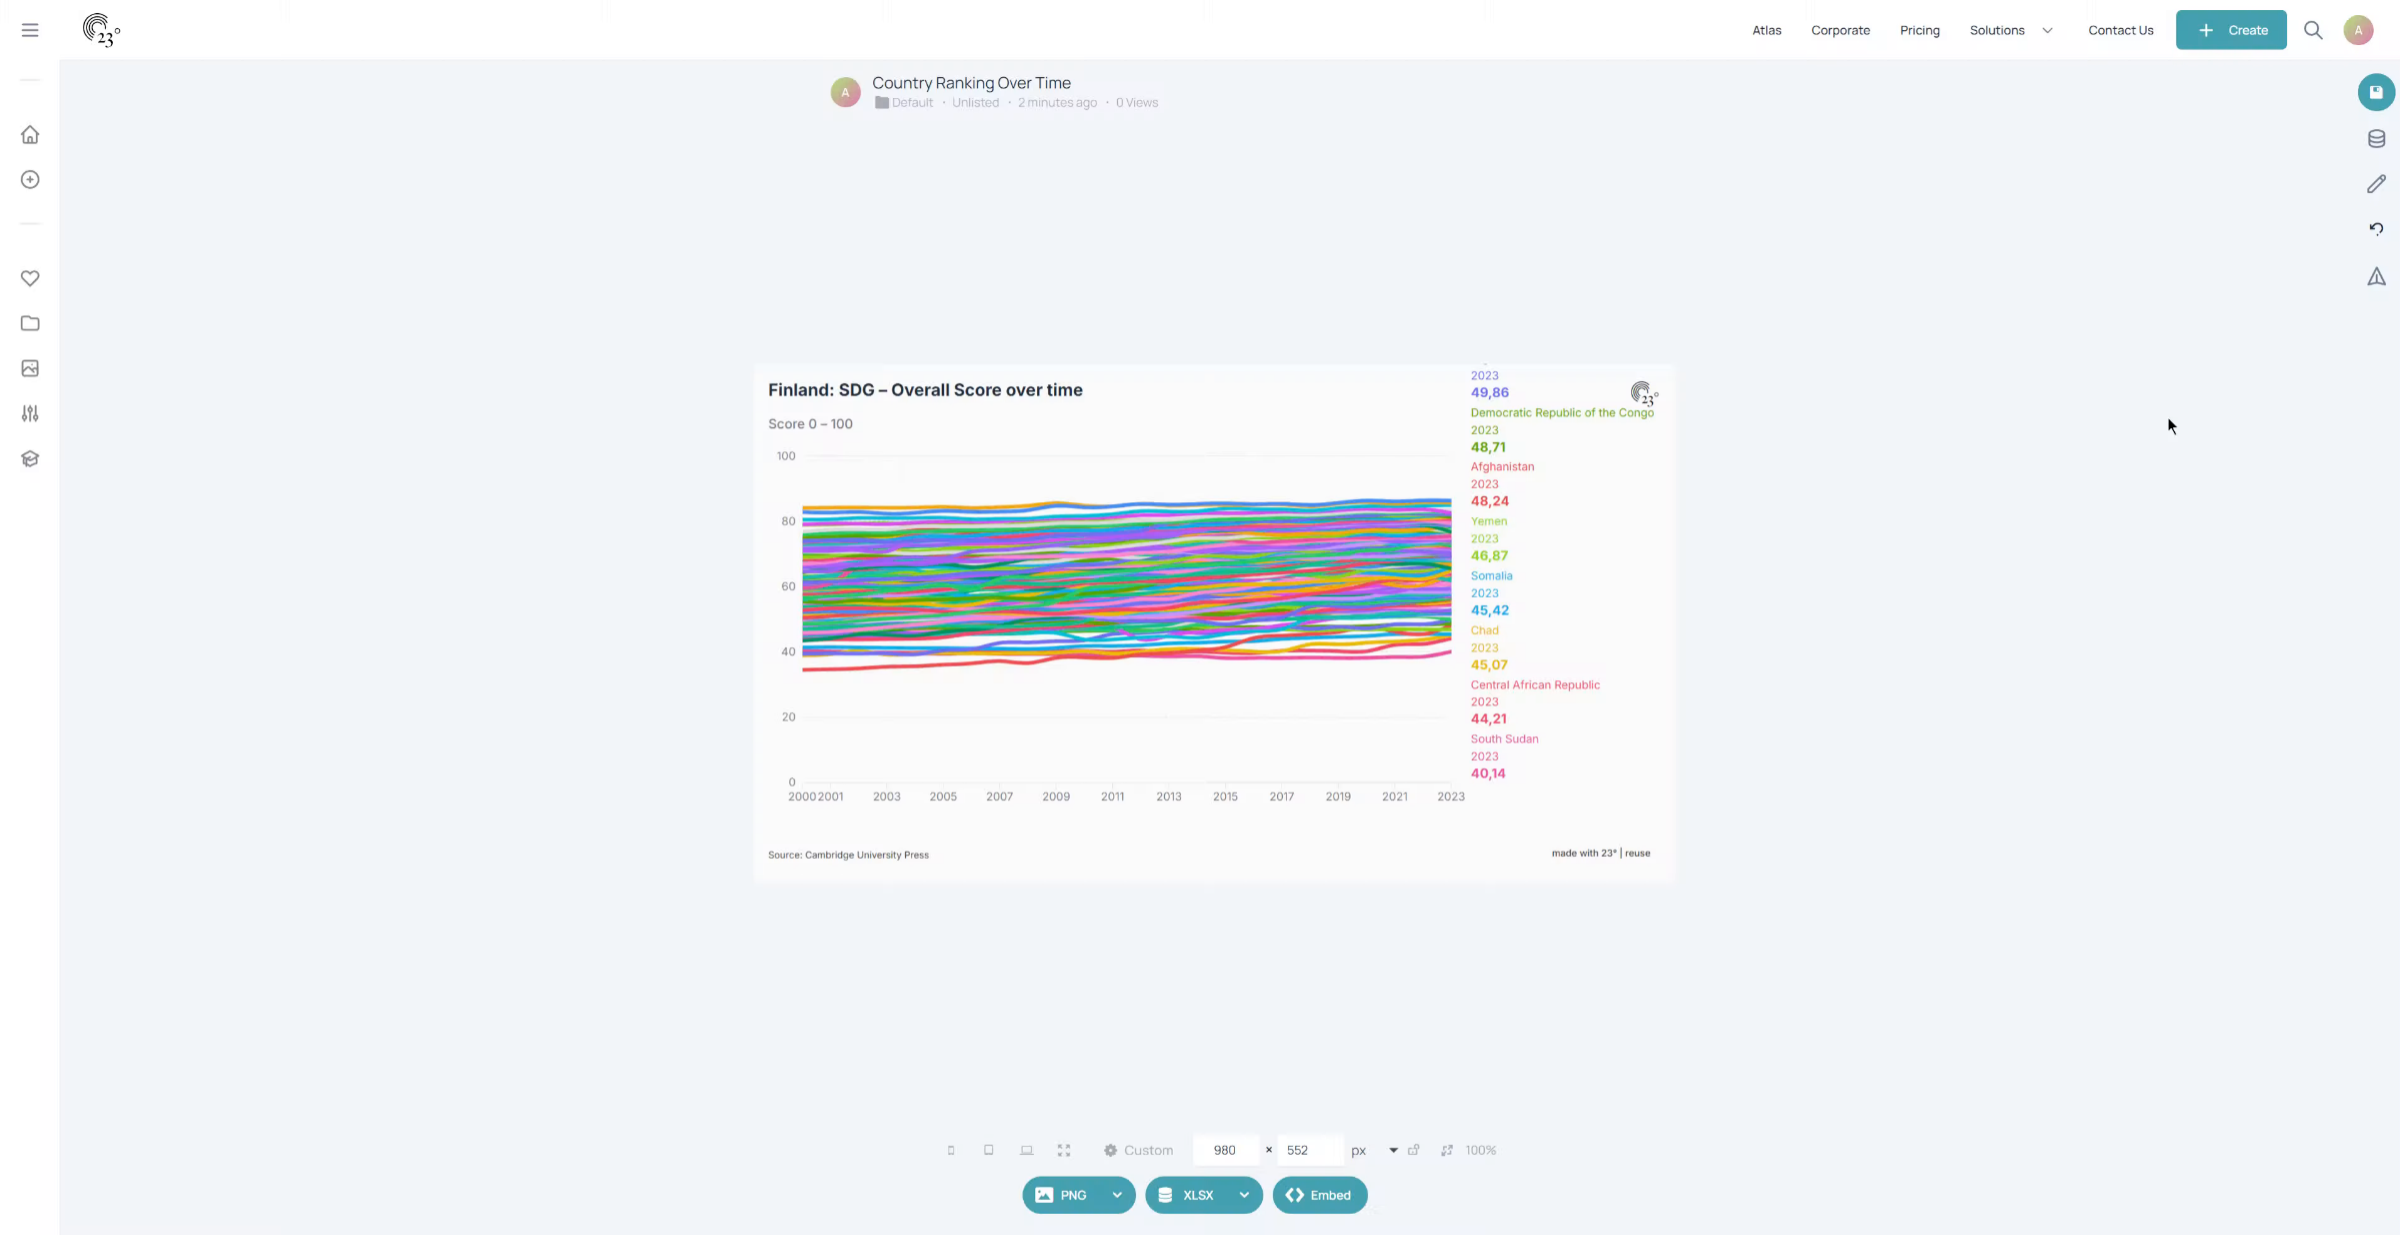
First click on the Data Editor.
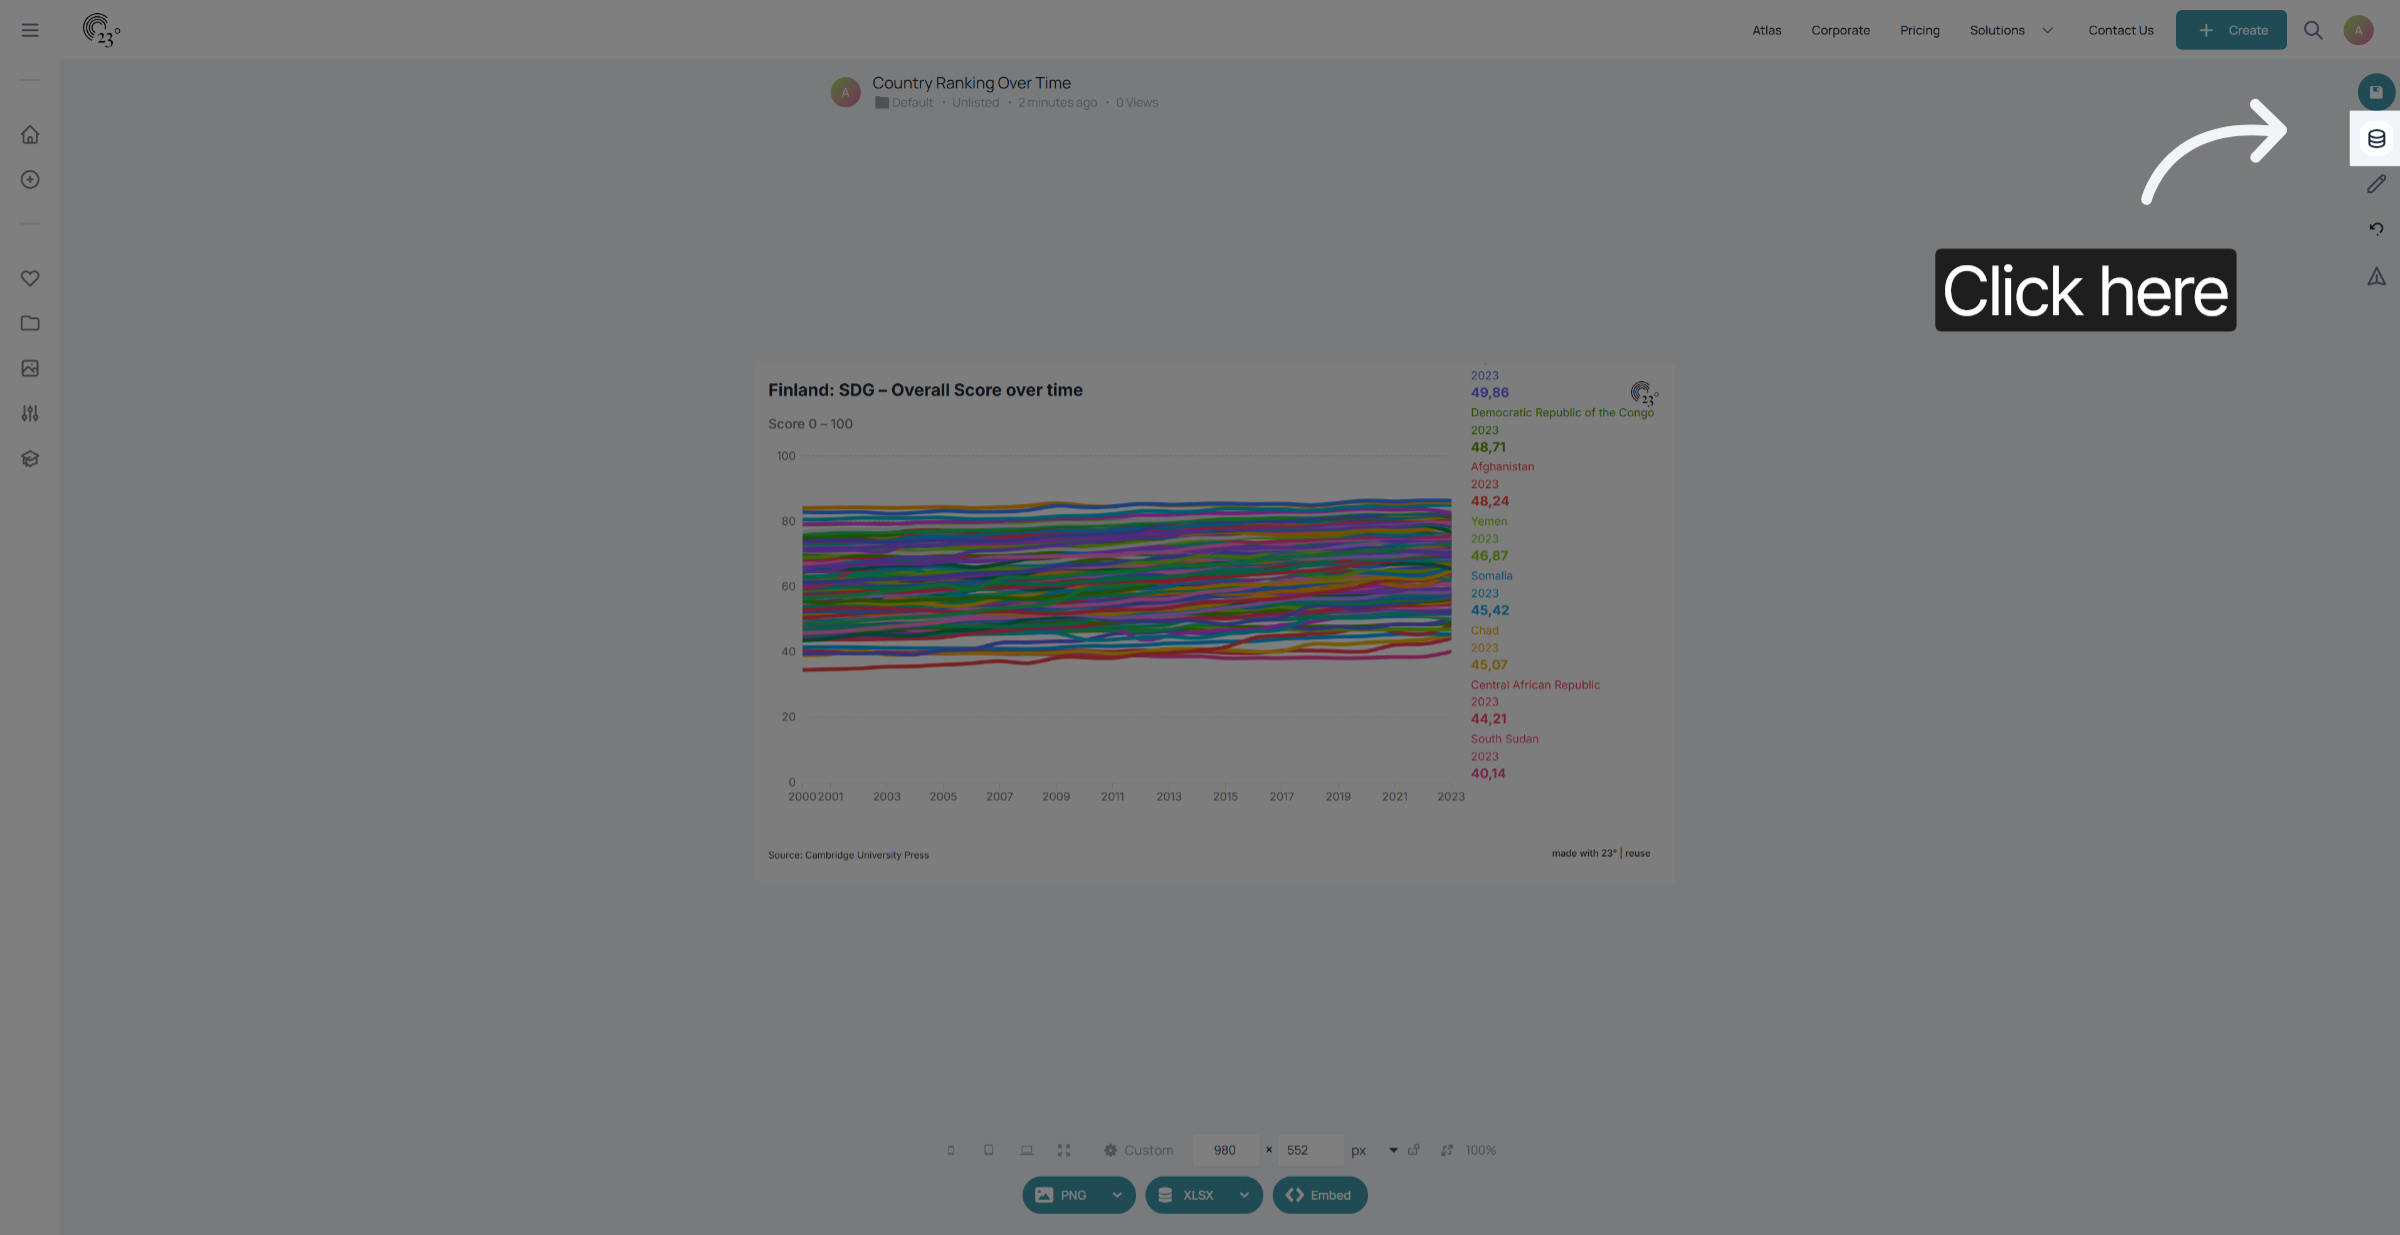
Click on the plus symbol to add a dropdown filter.
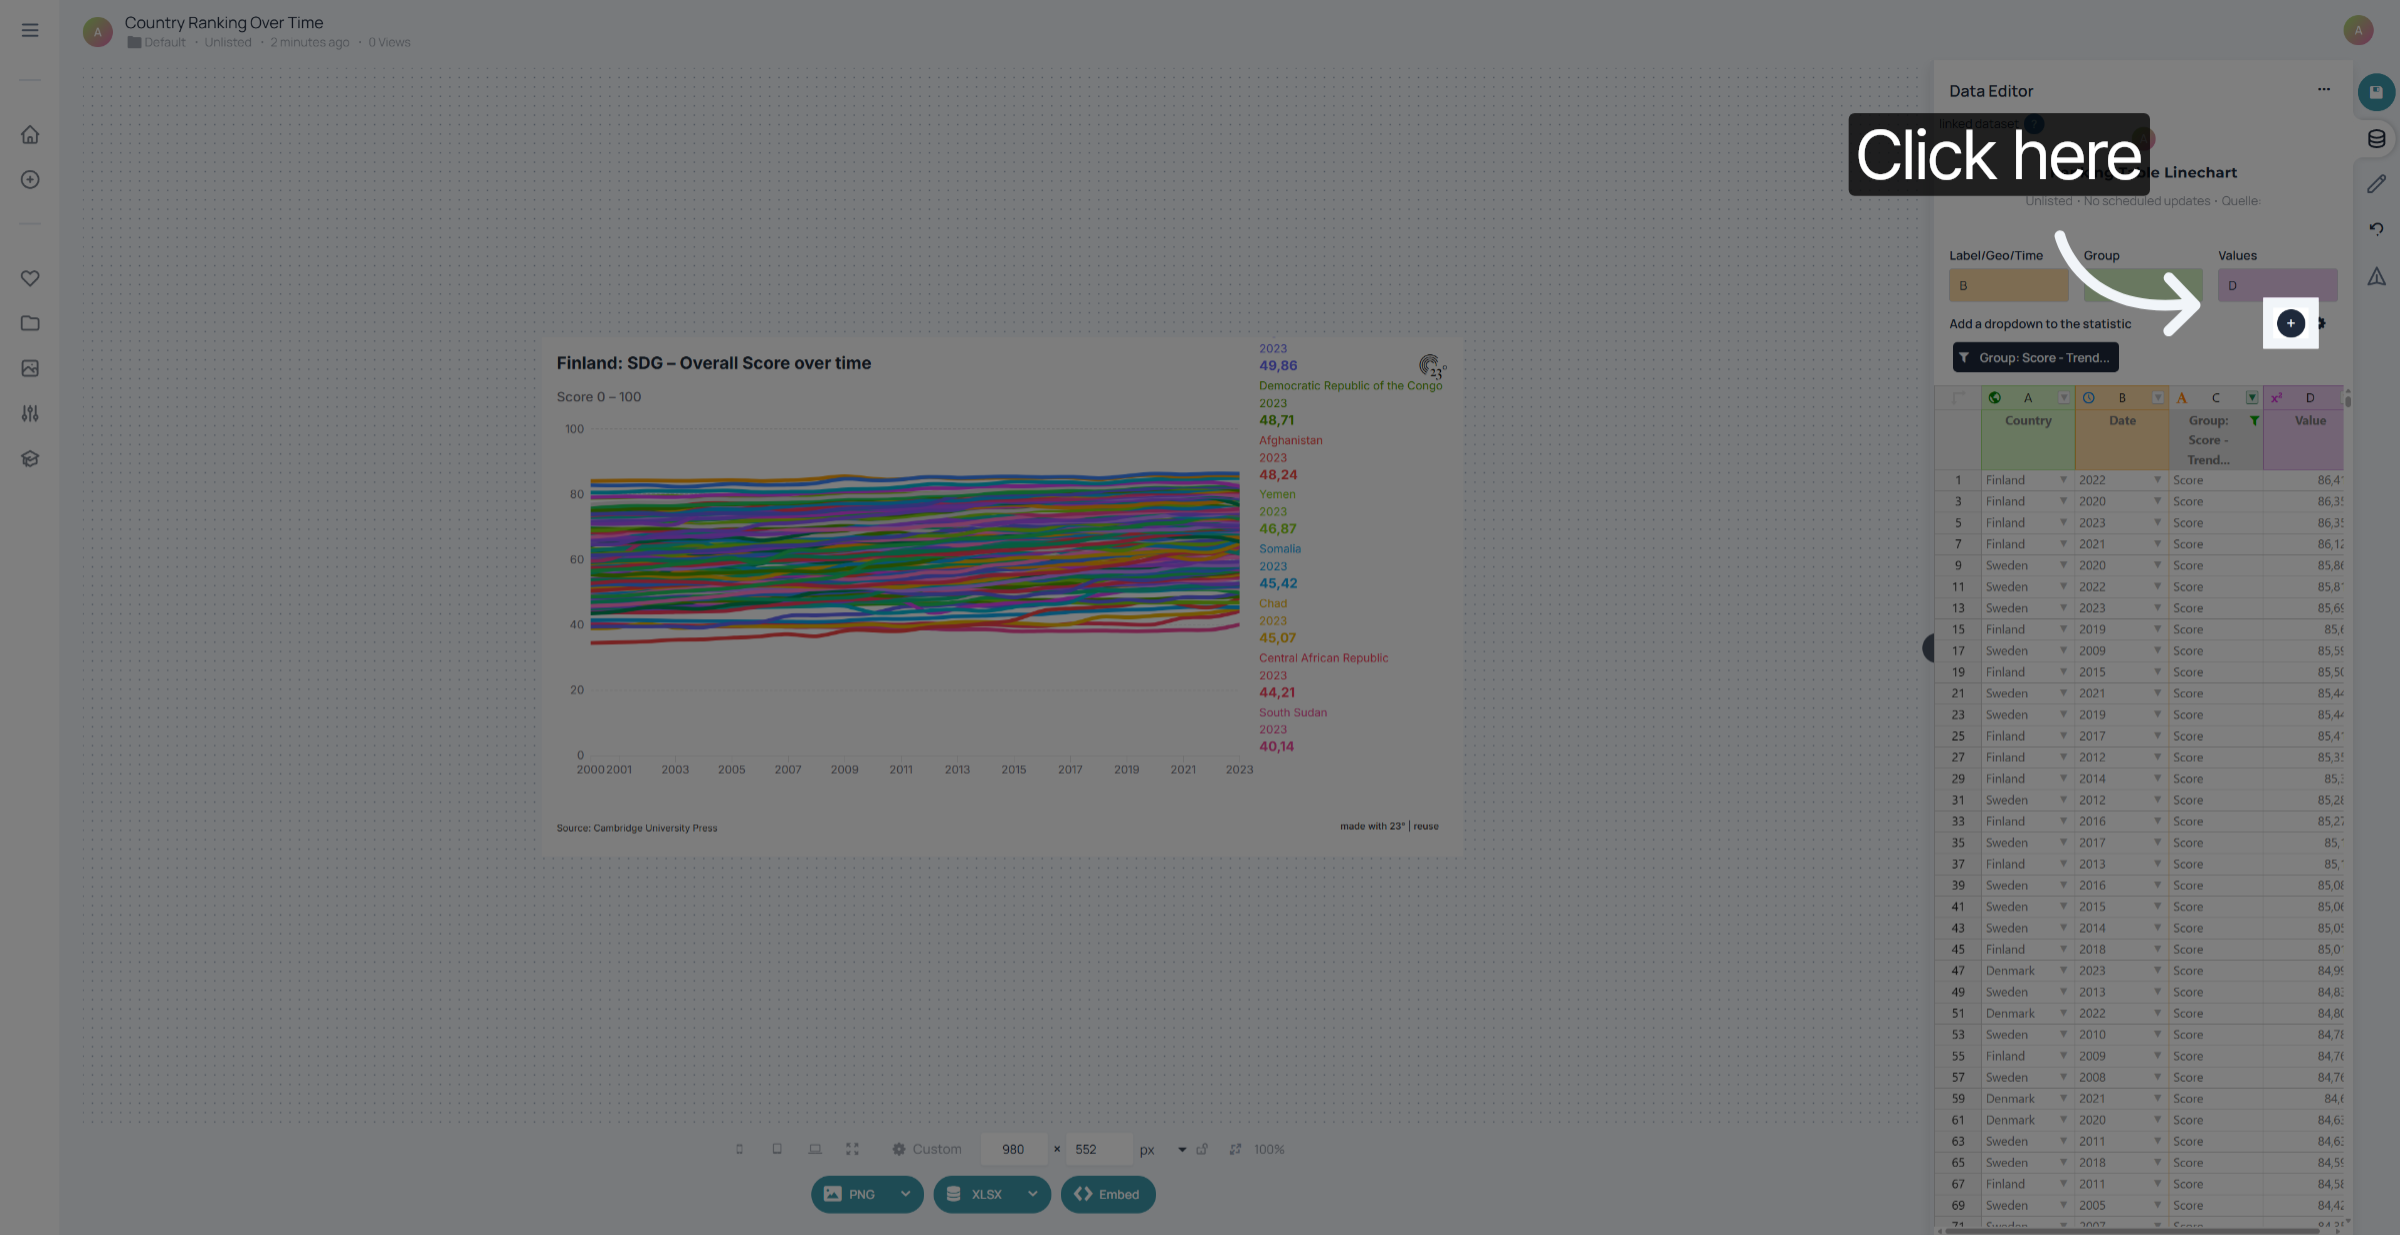
Select a column for filtering. In this case we want to filter by country.
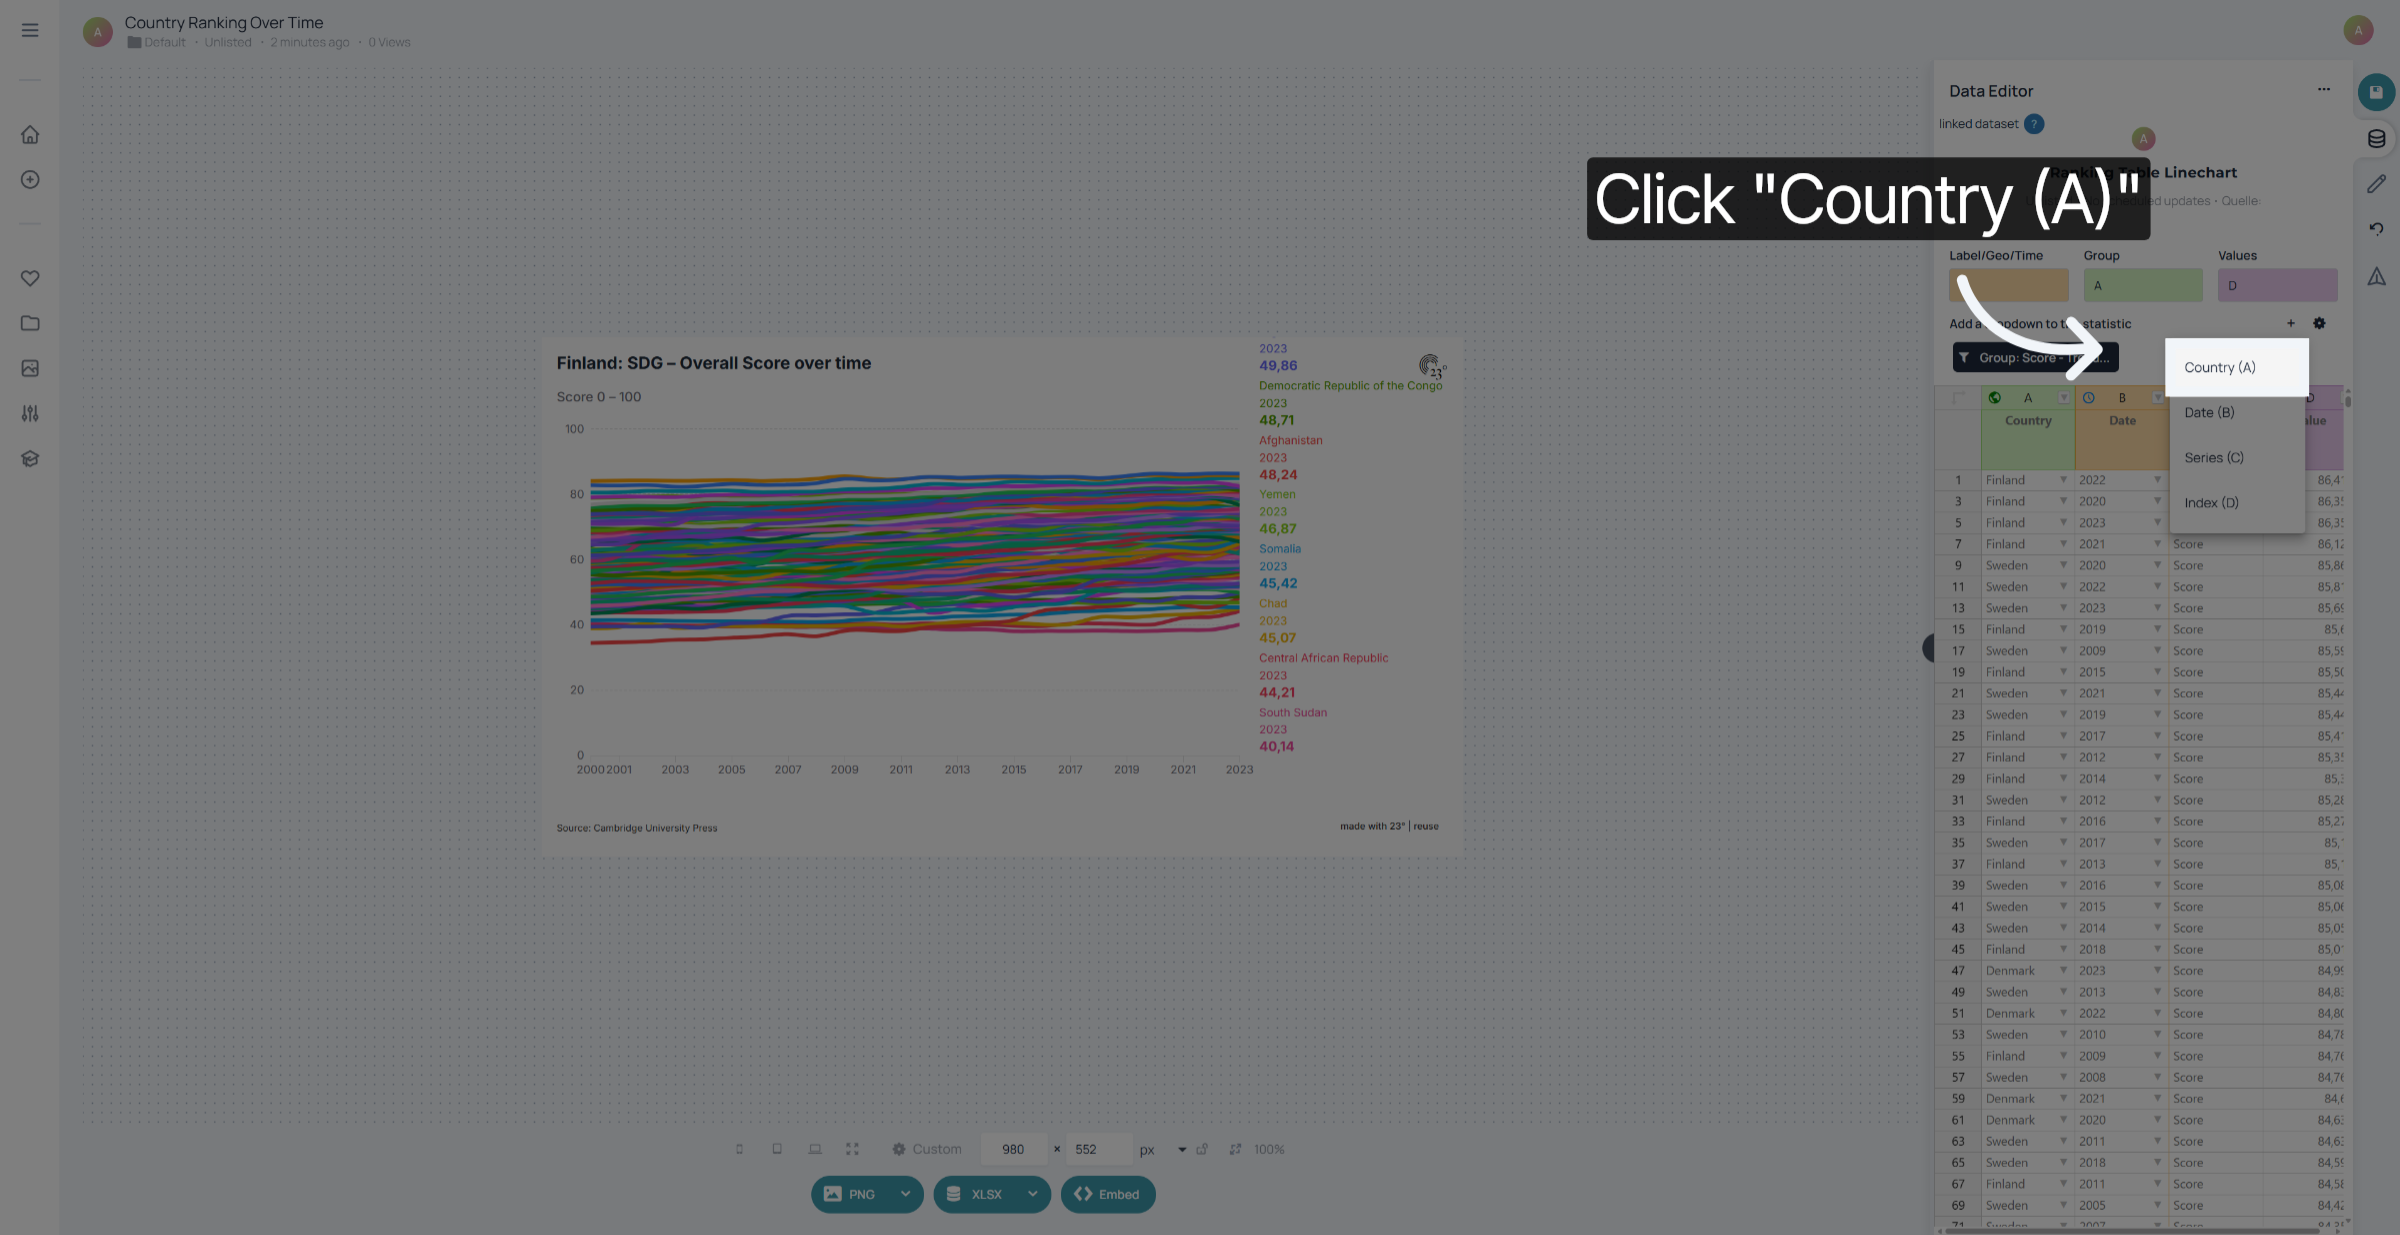
Your Dropdown filter is now visible in the visualisation. To access the filter settings click on your newly created filter.
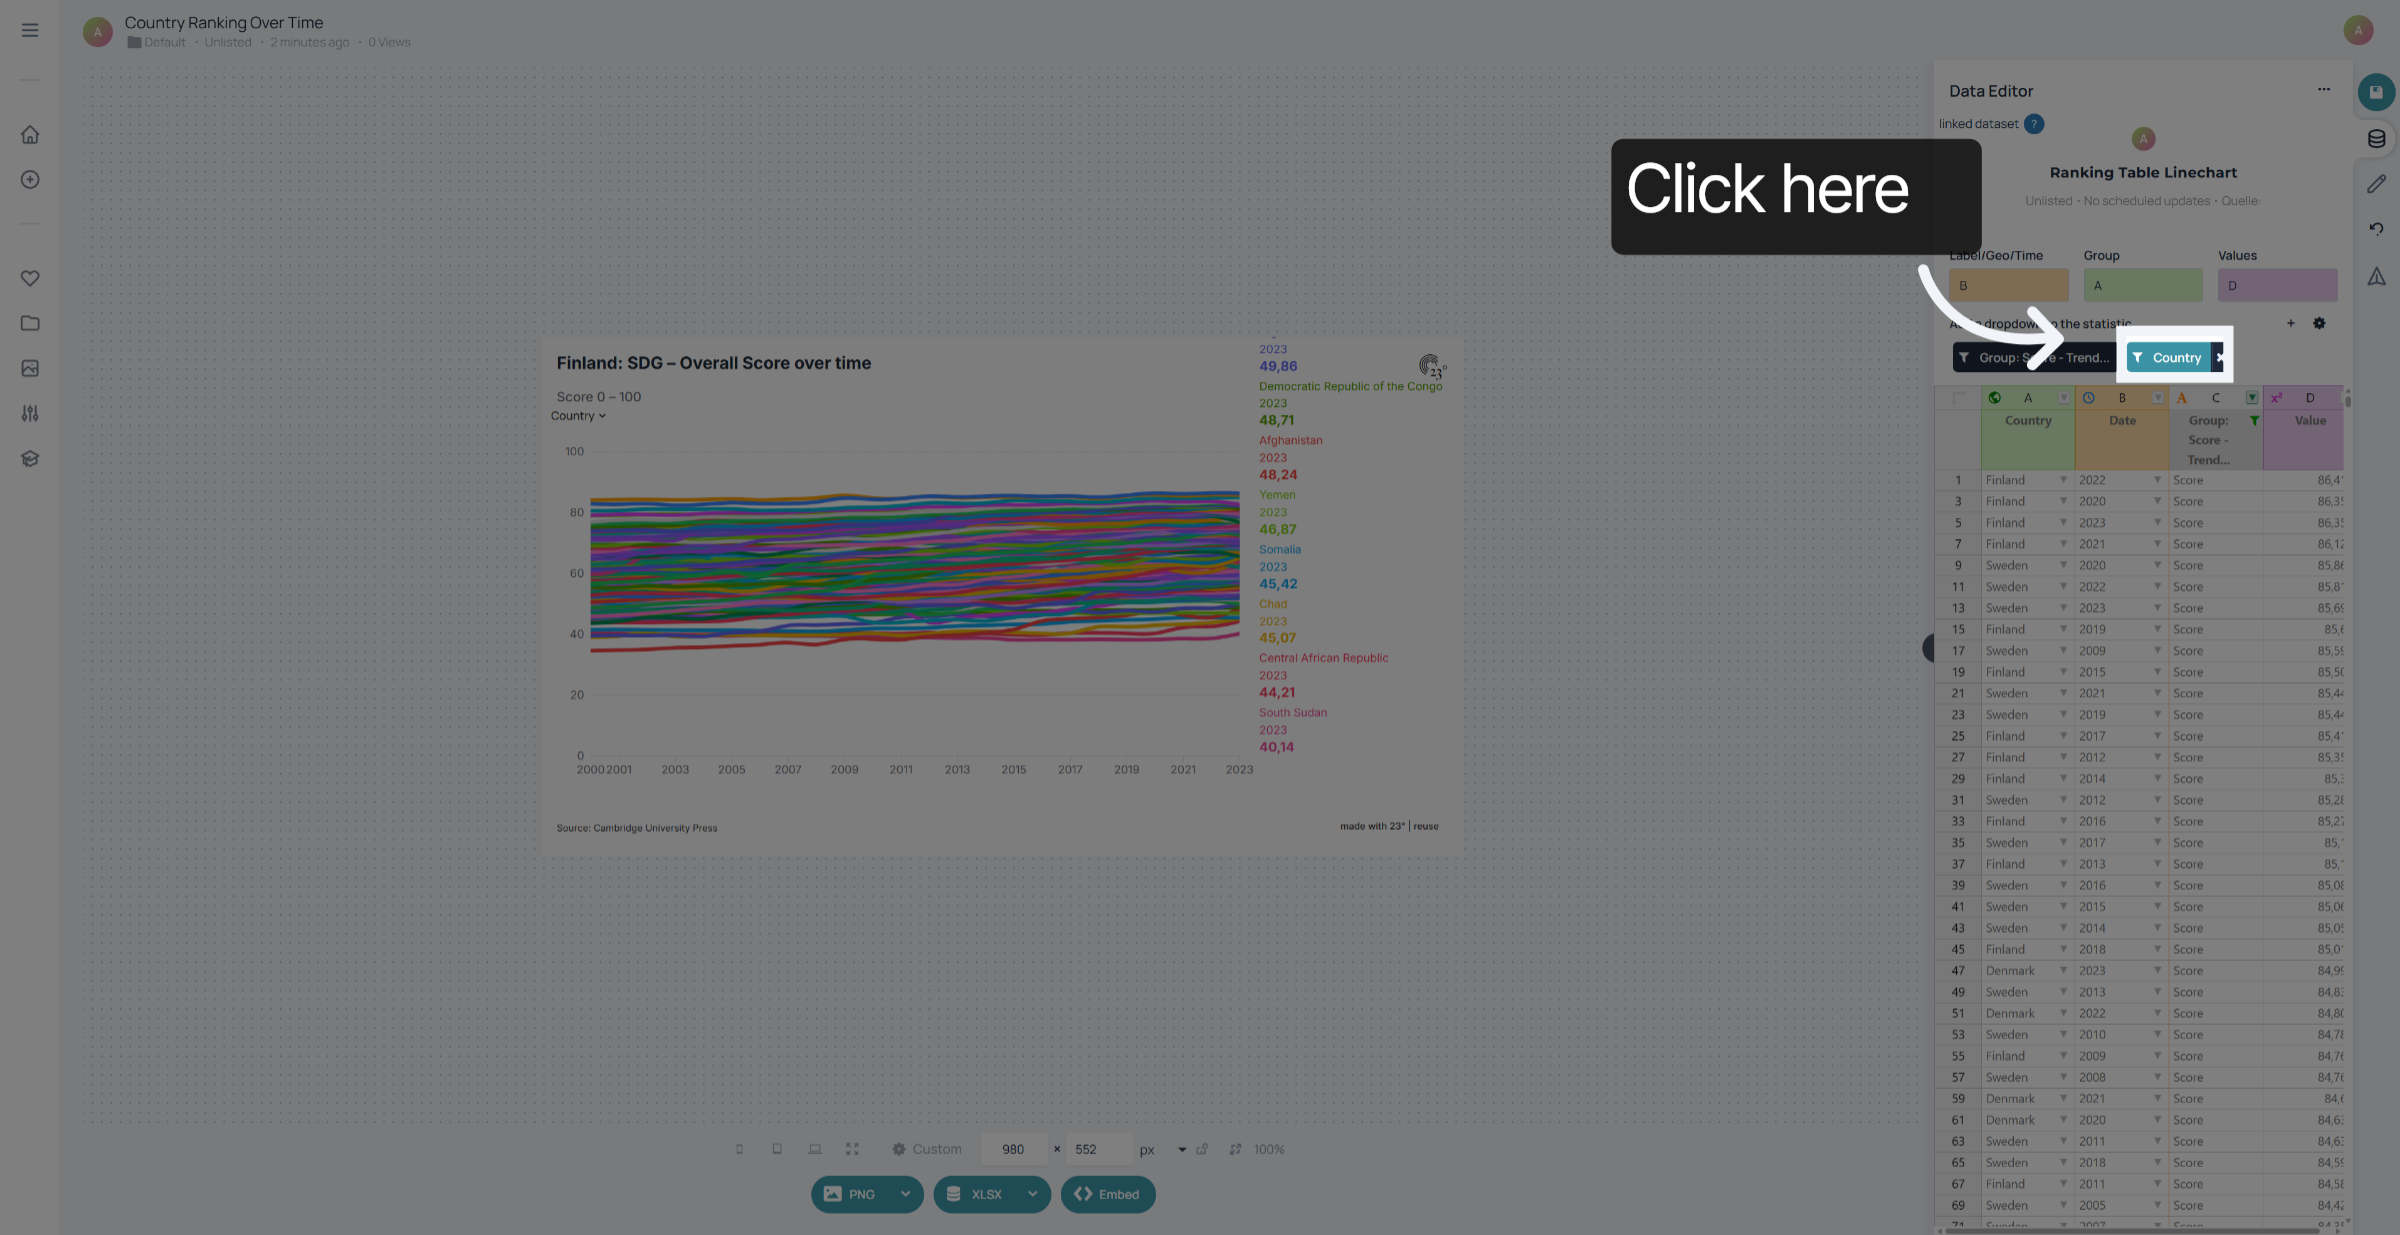
Click here to define wheter your filter should be a single or multiselect filter.
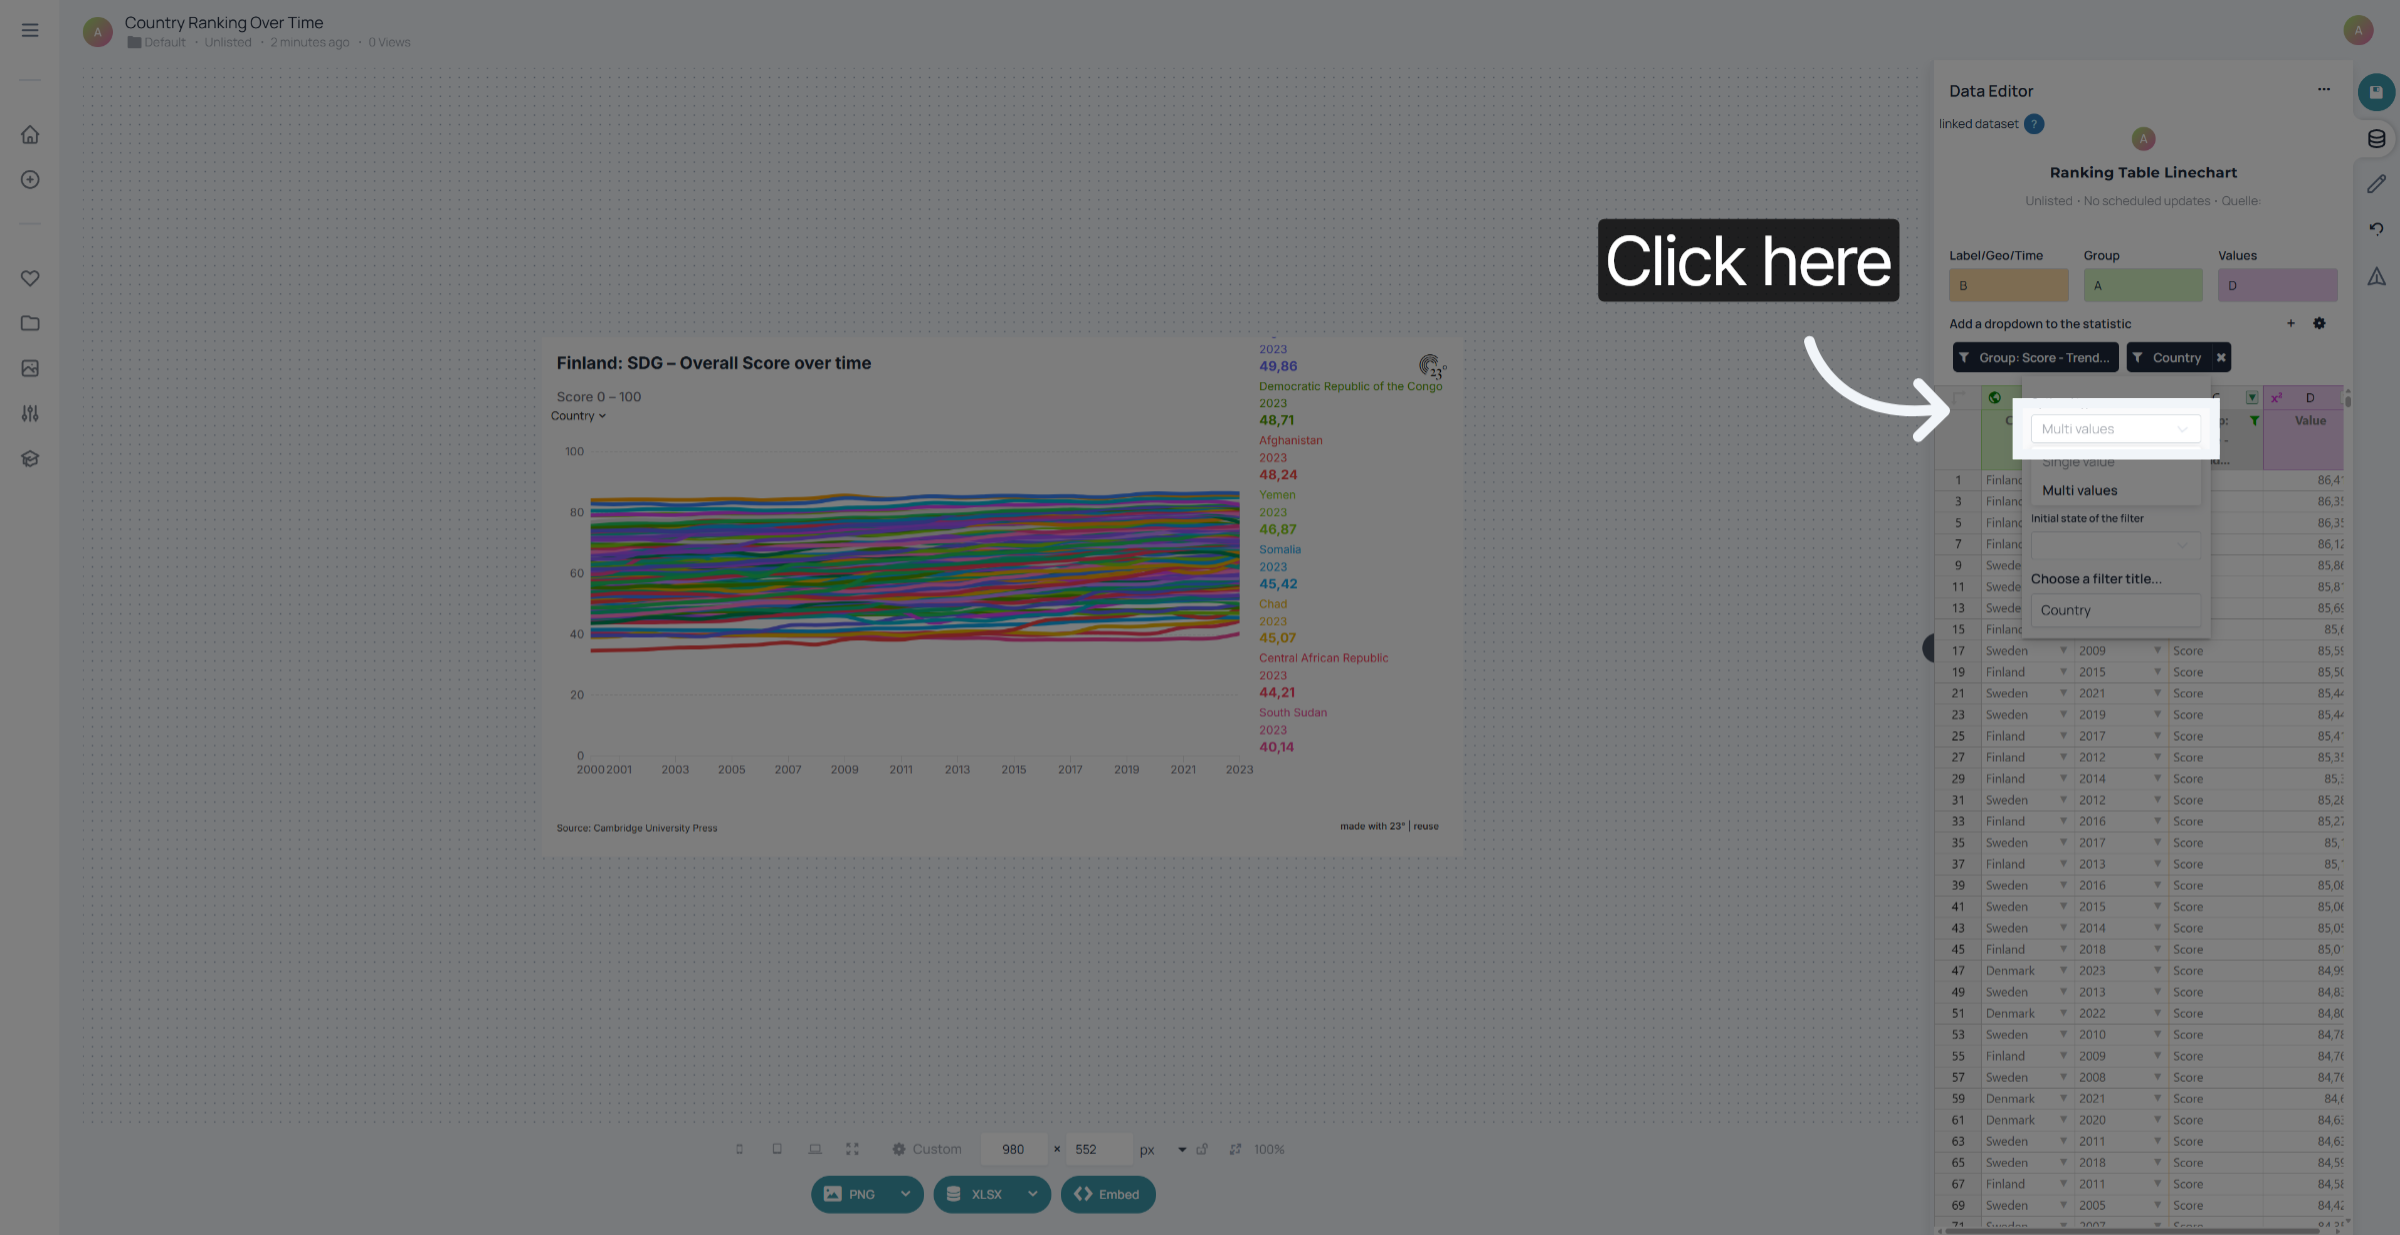
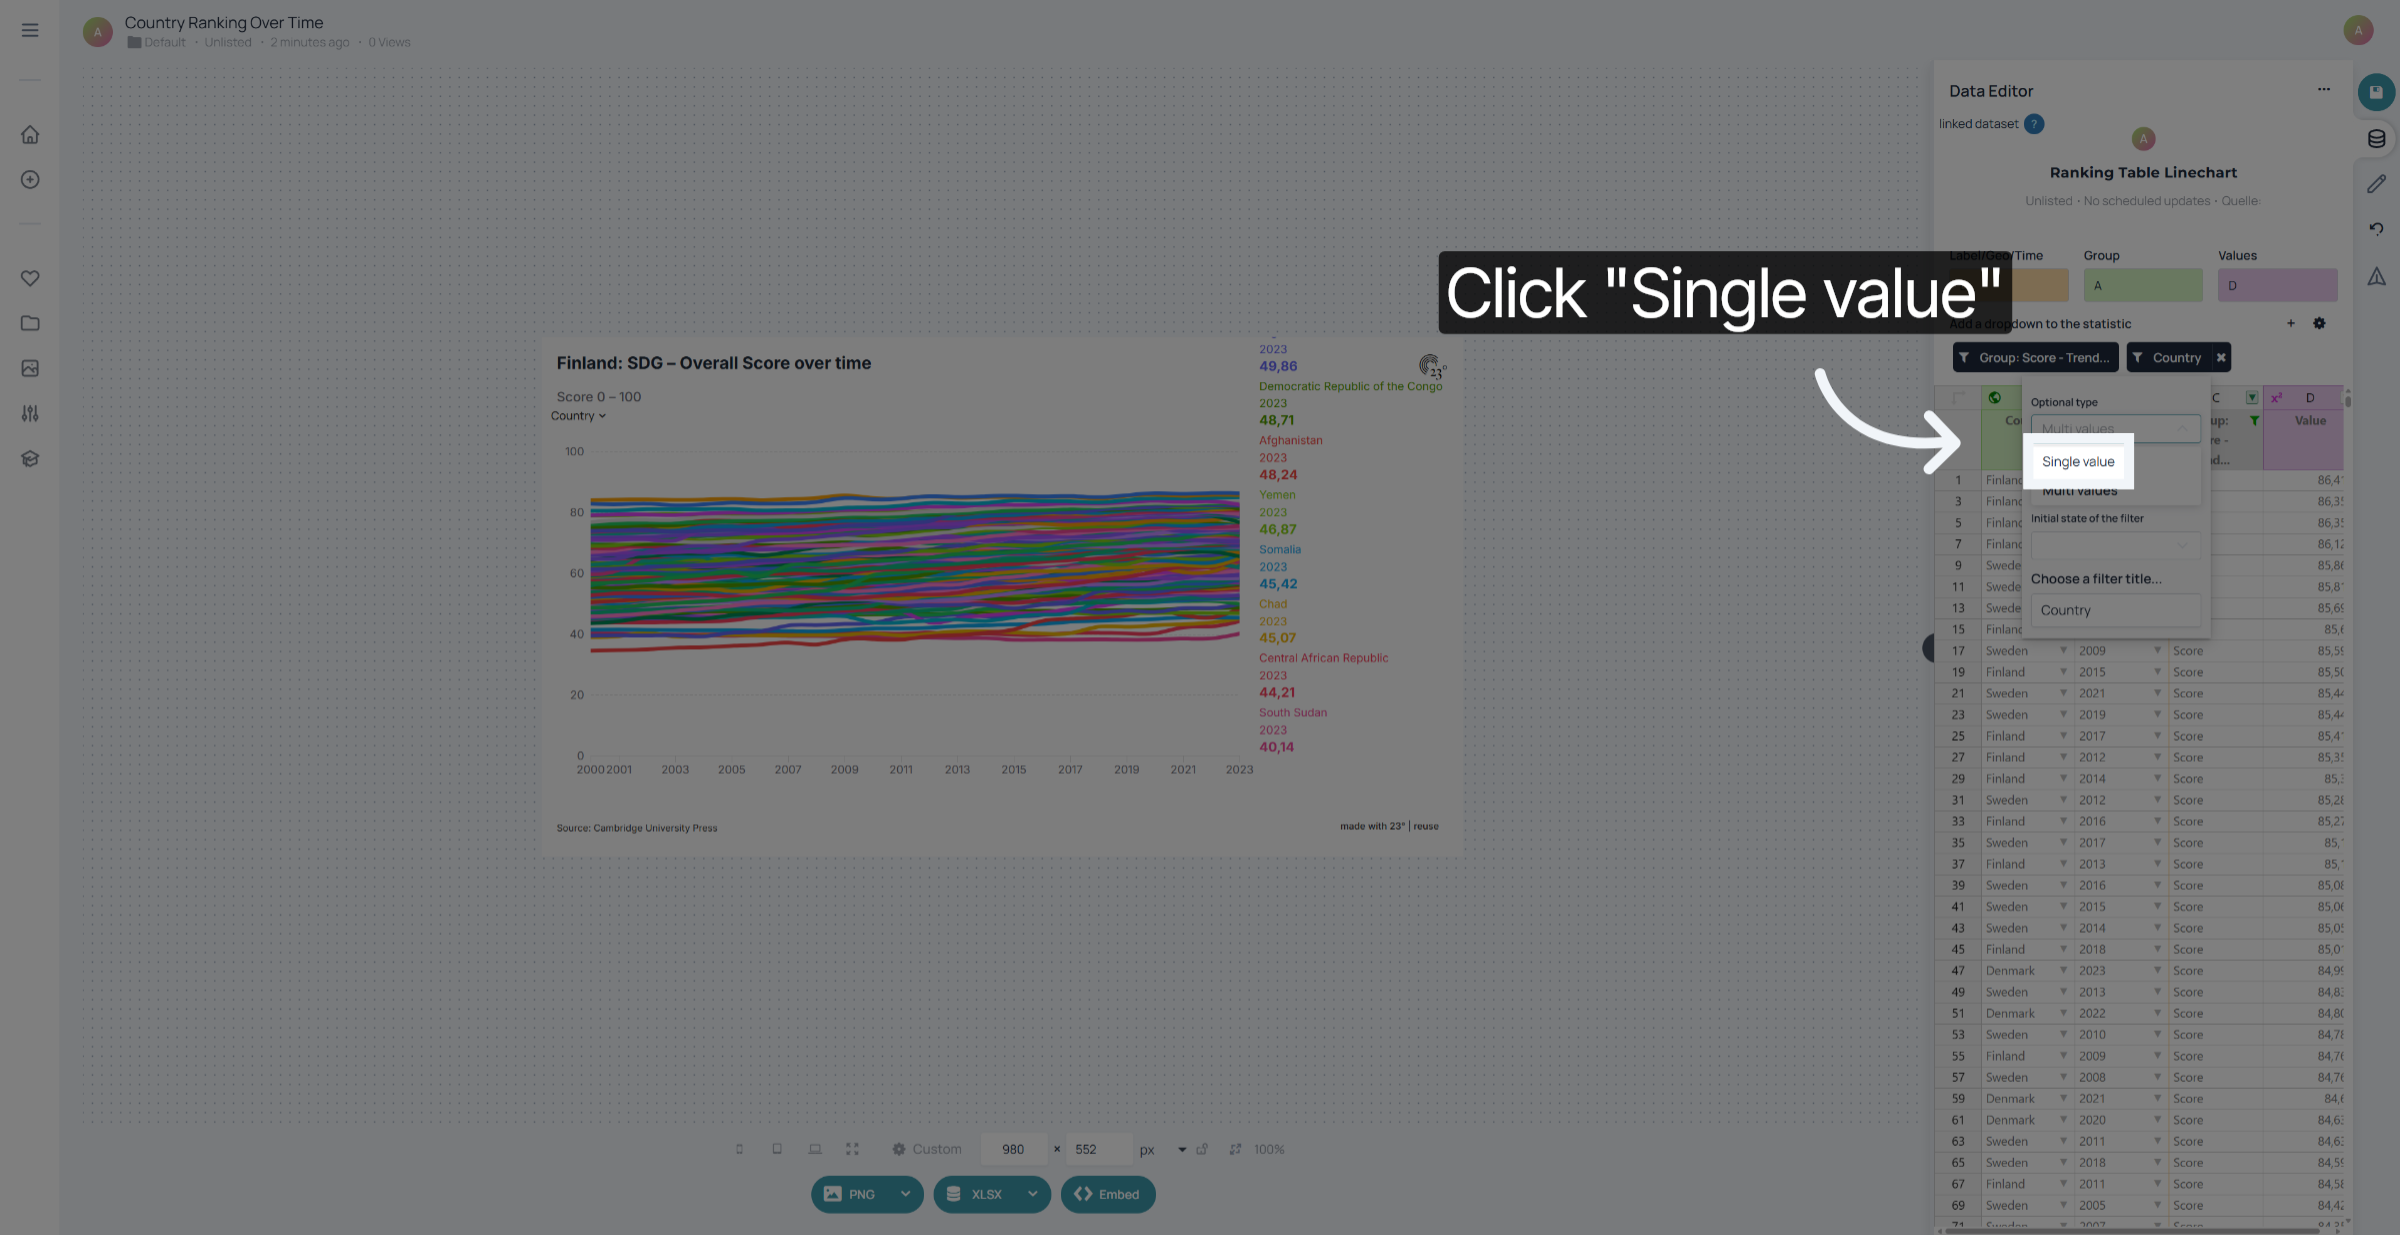
In this case we want to define the filter as a single select filter where only one country is shown at a time.
You can define the initial state of the filter. The alphabetically first, last or your custom selection can be preselected for the initial viewport.
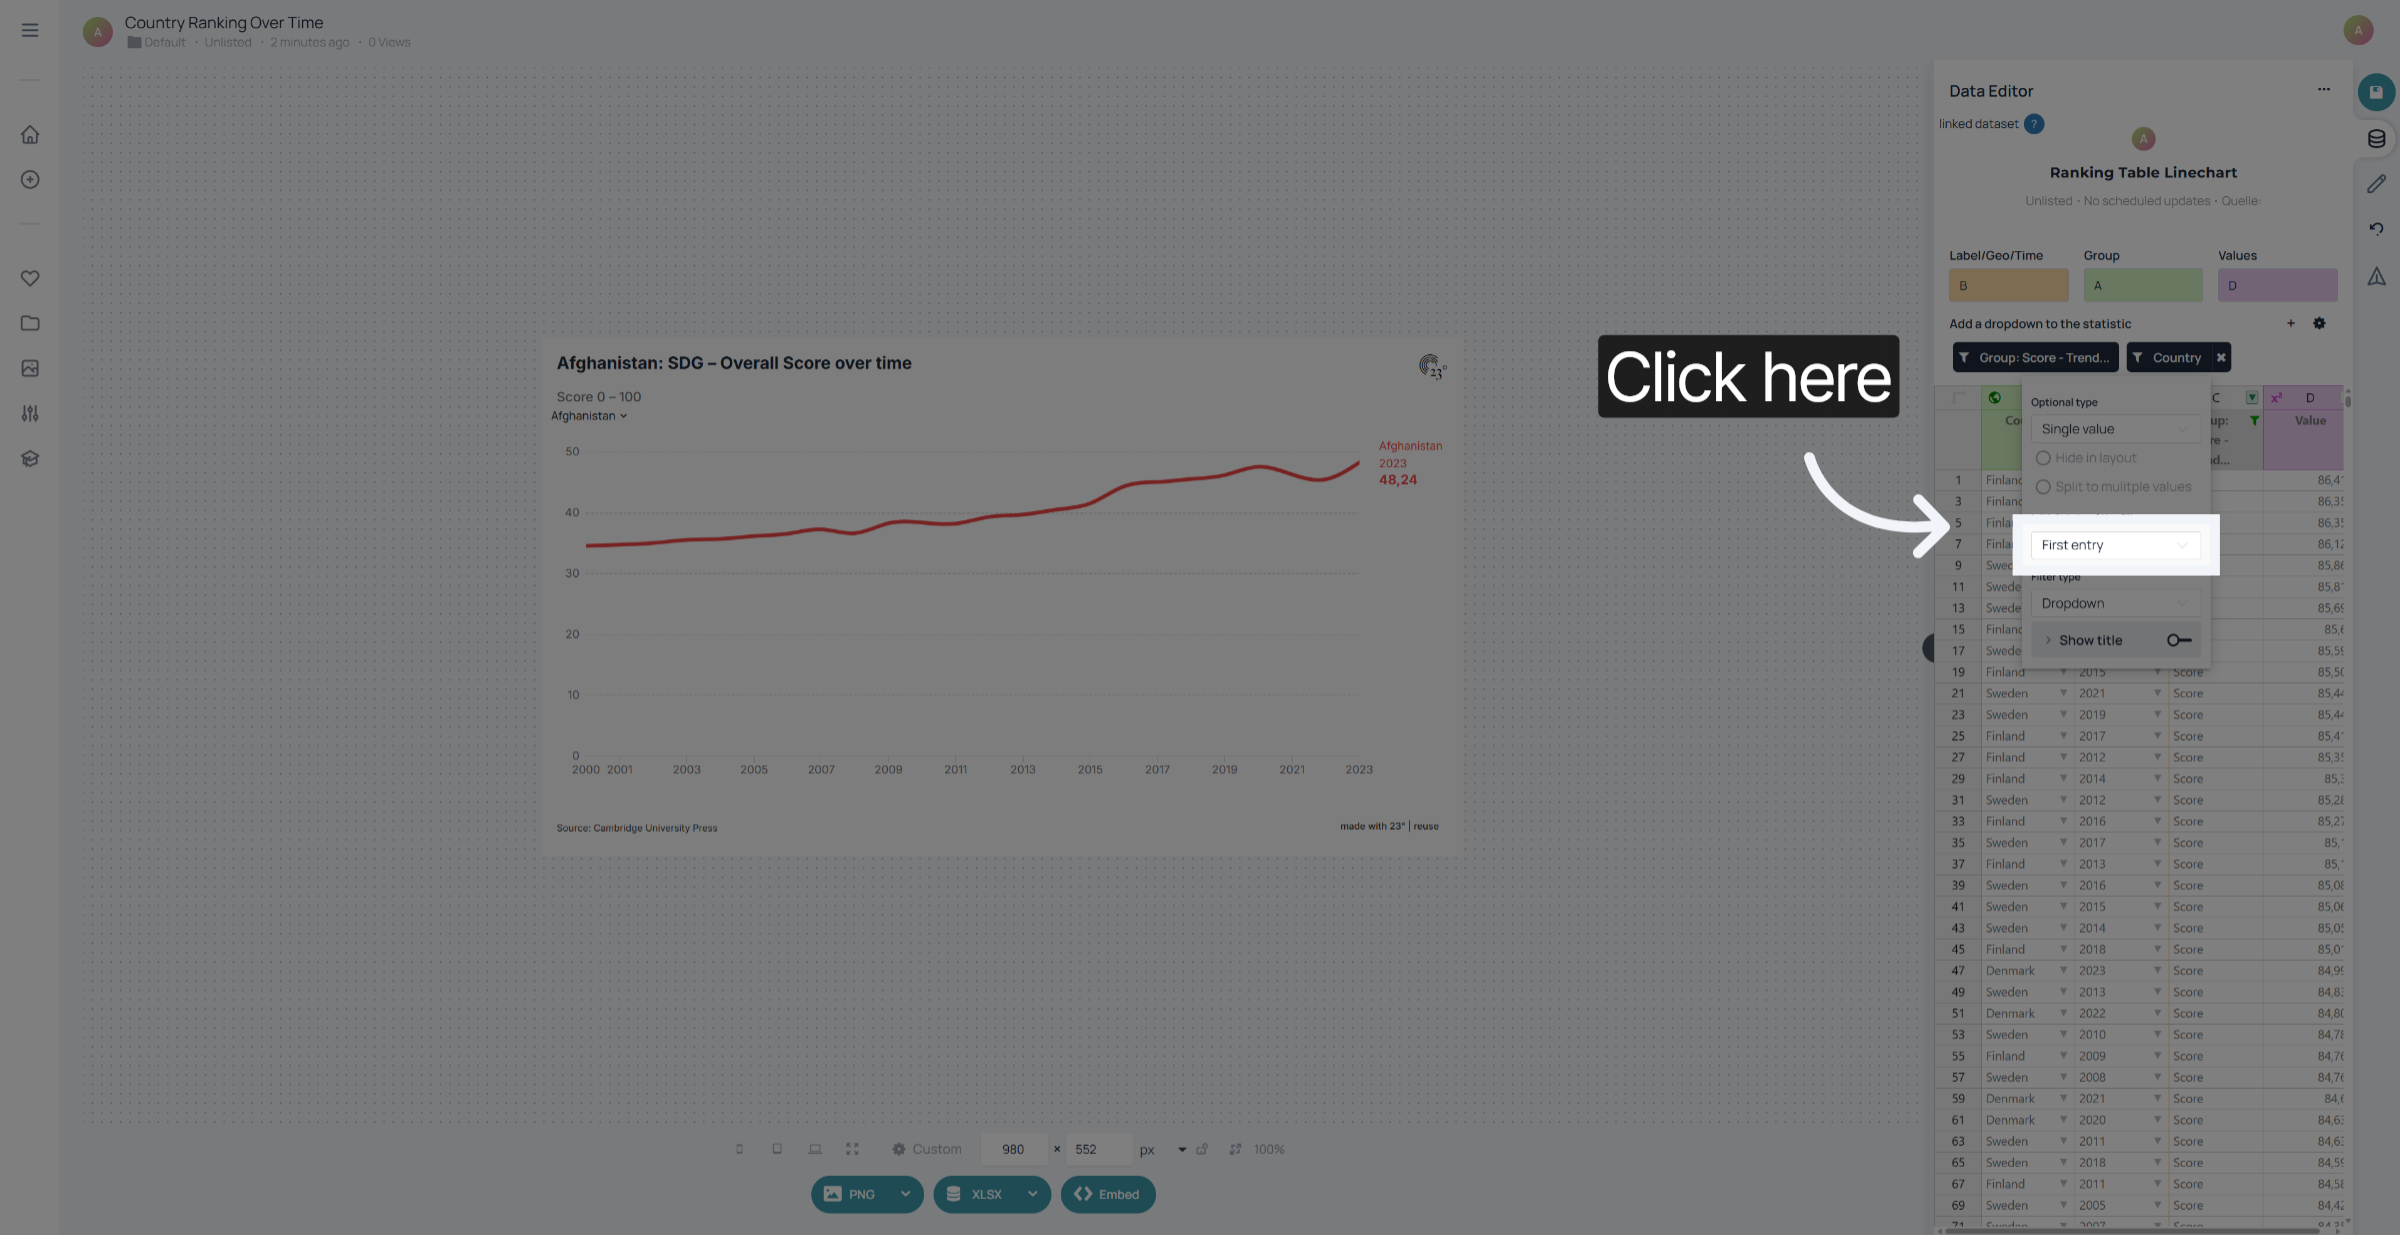
Click here to change your filter type. Depending on what you need you can create a filte dropdown, a timeline, a timeslider or buttons.
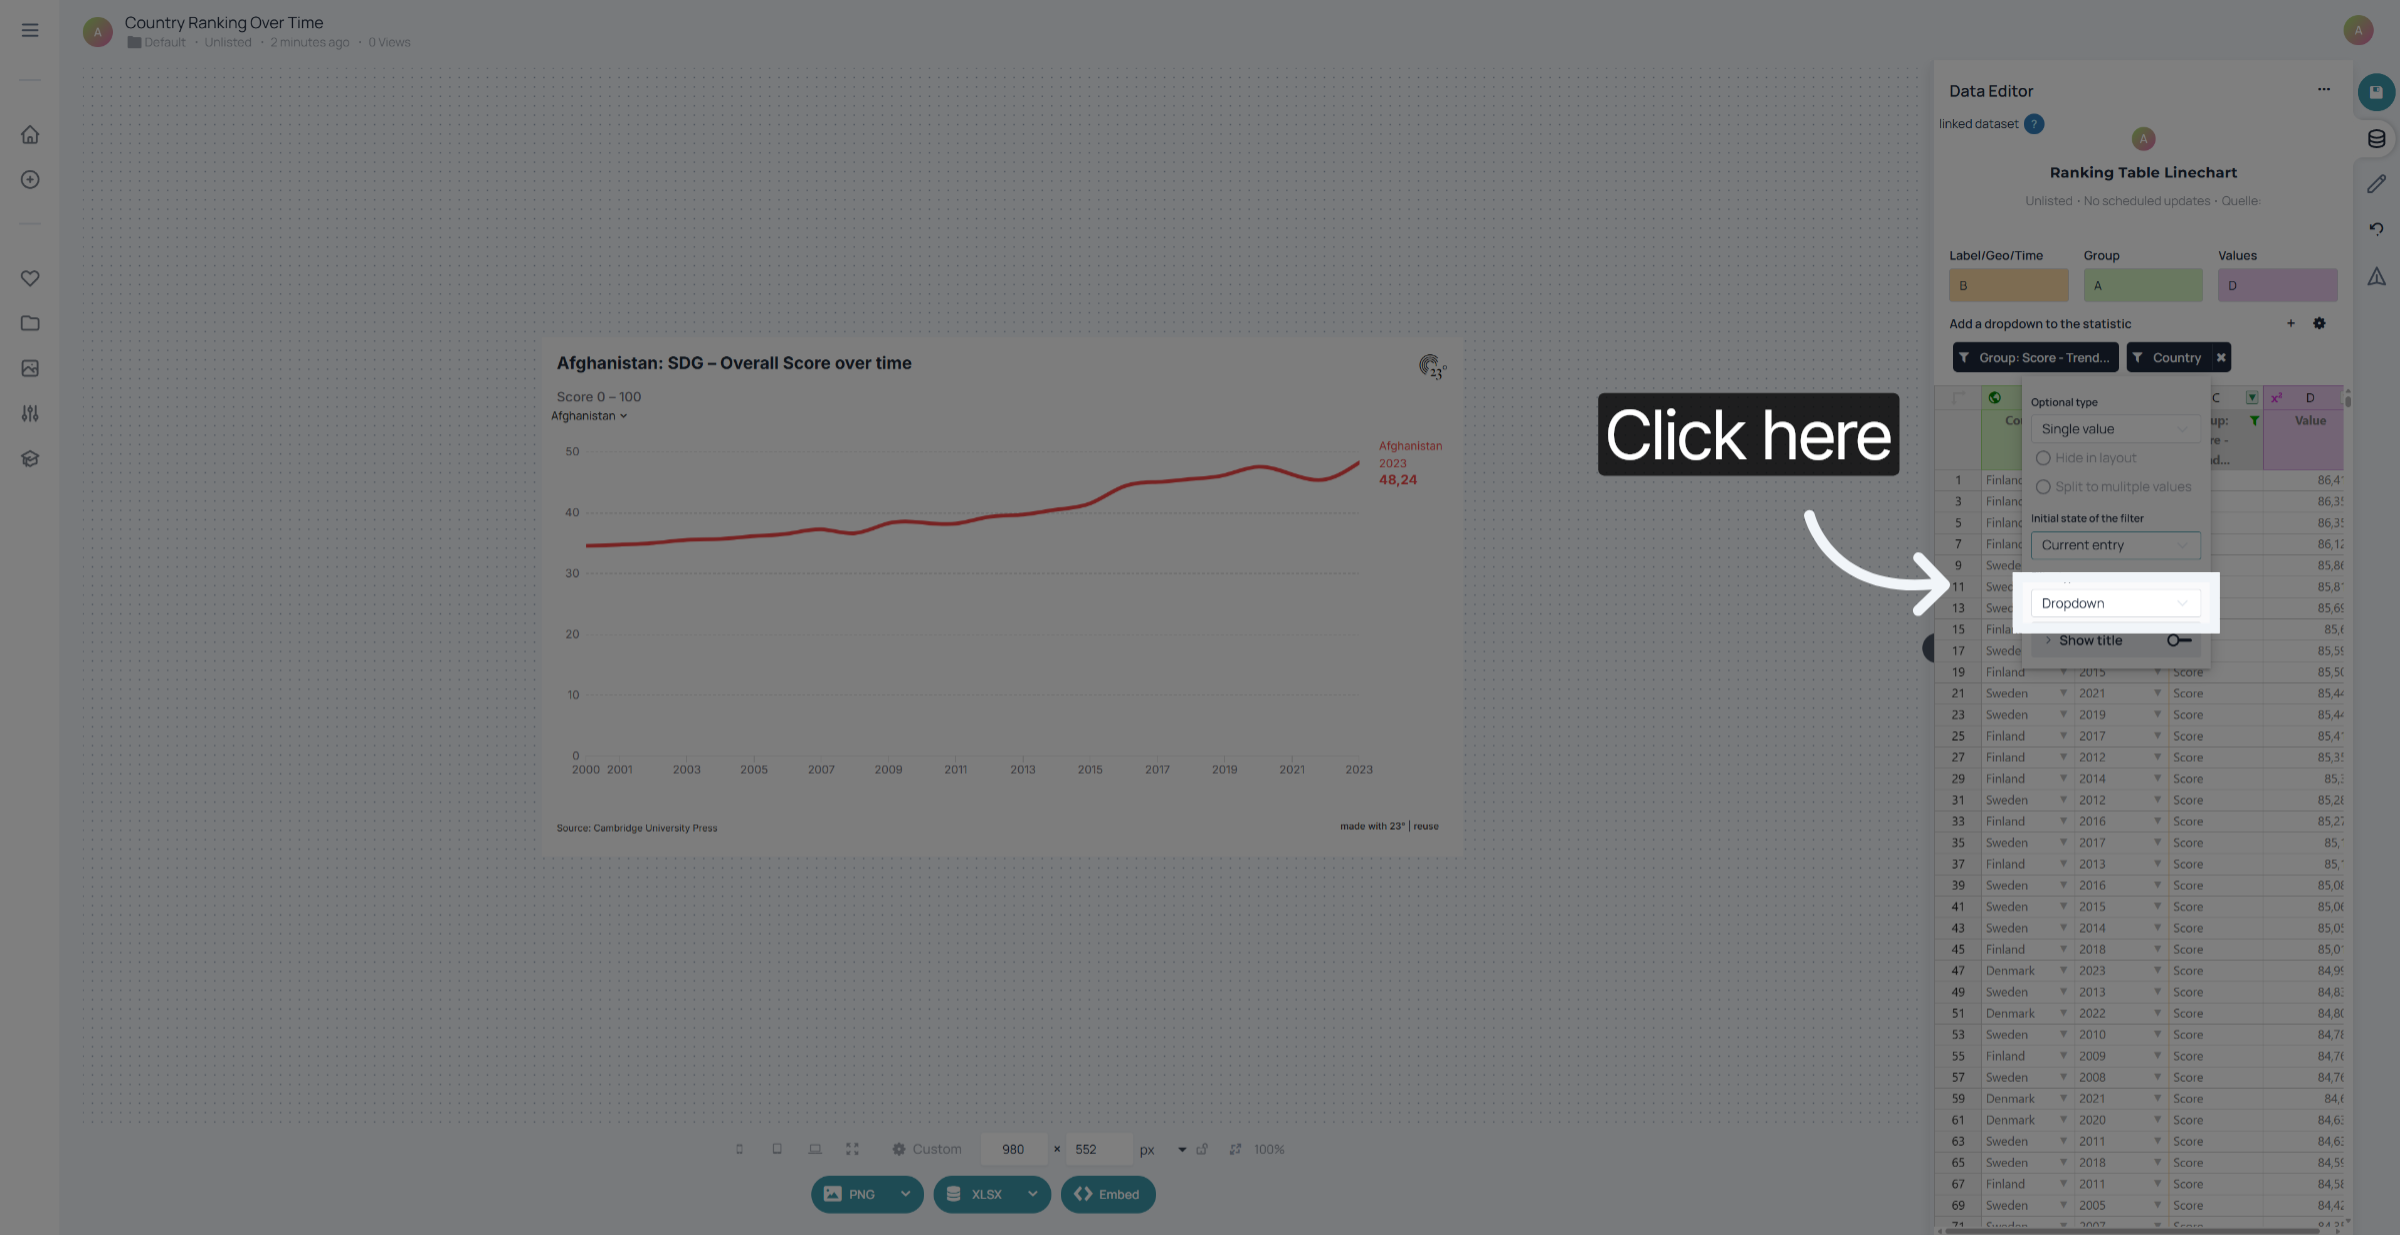
Click here to enable the column name or give a custom name to the dropdown filter as the title for the dropdown
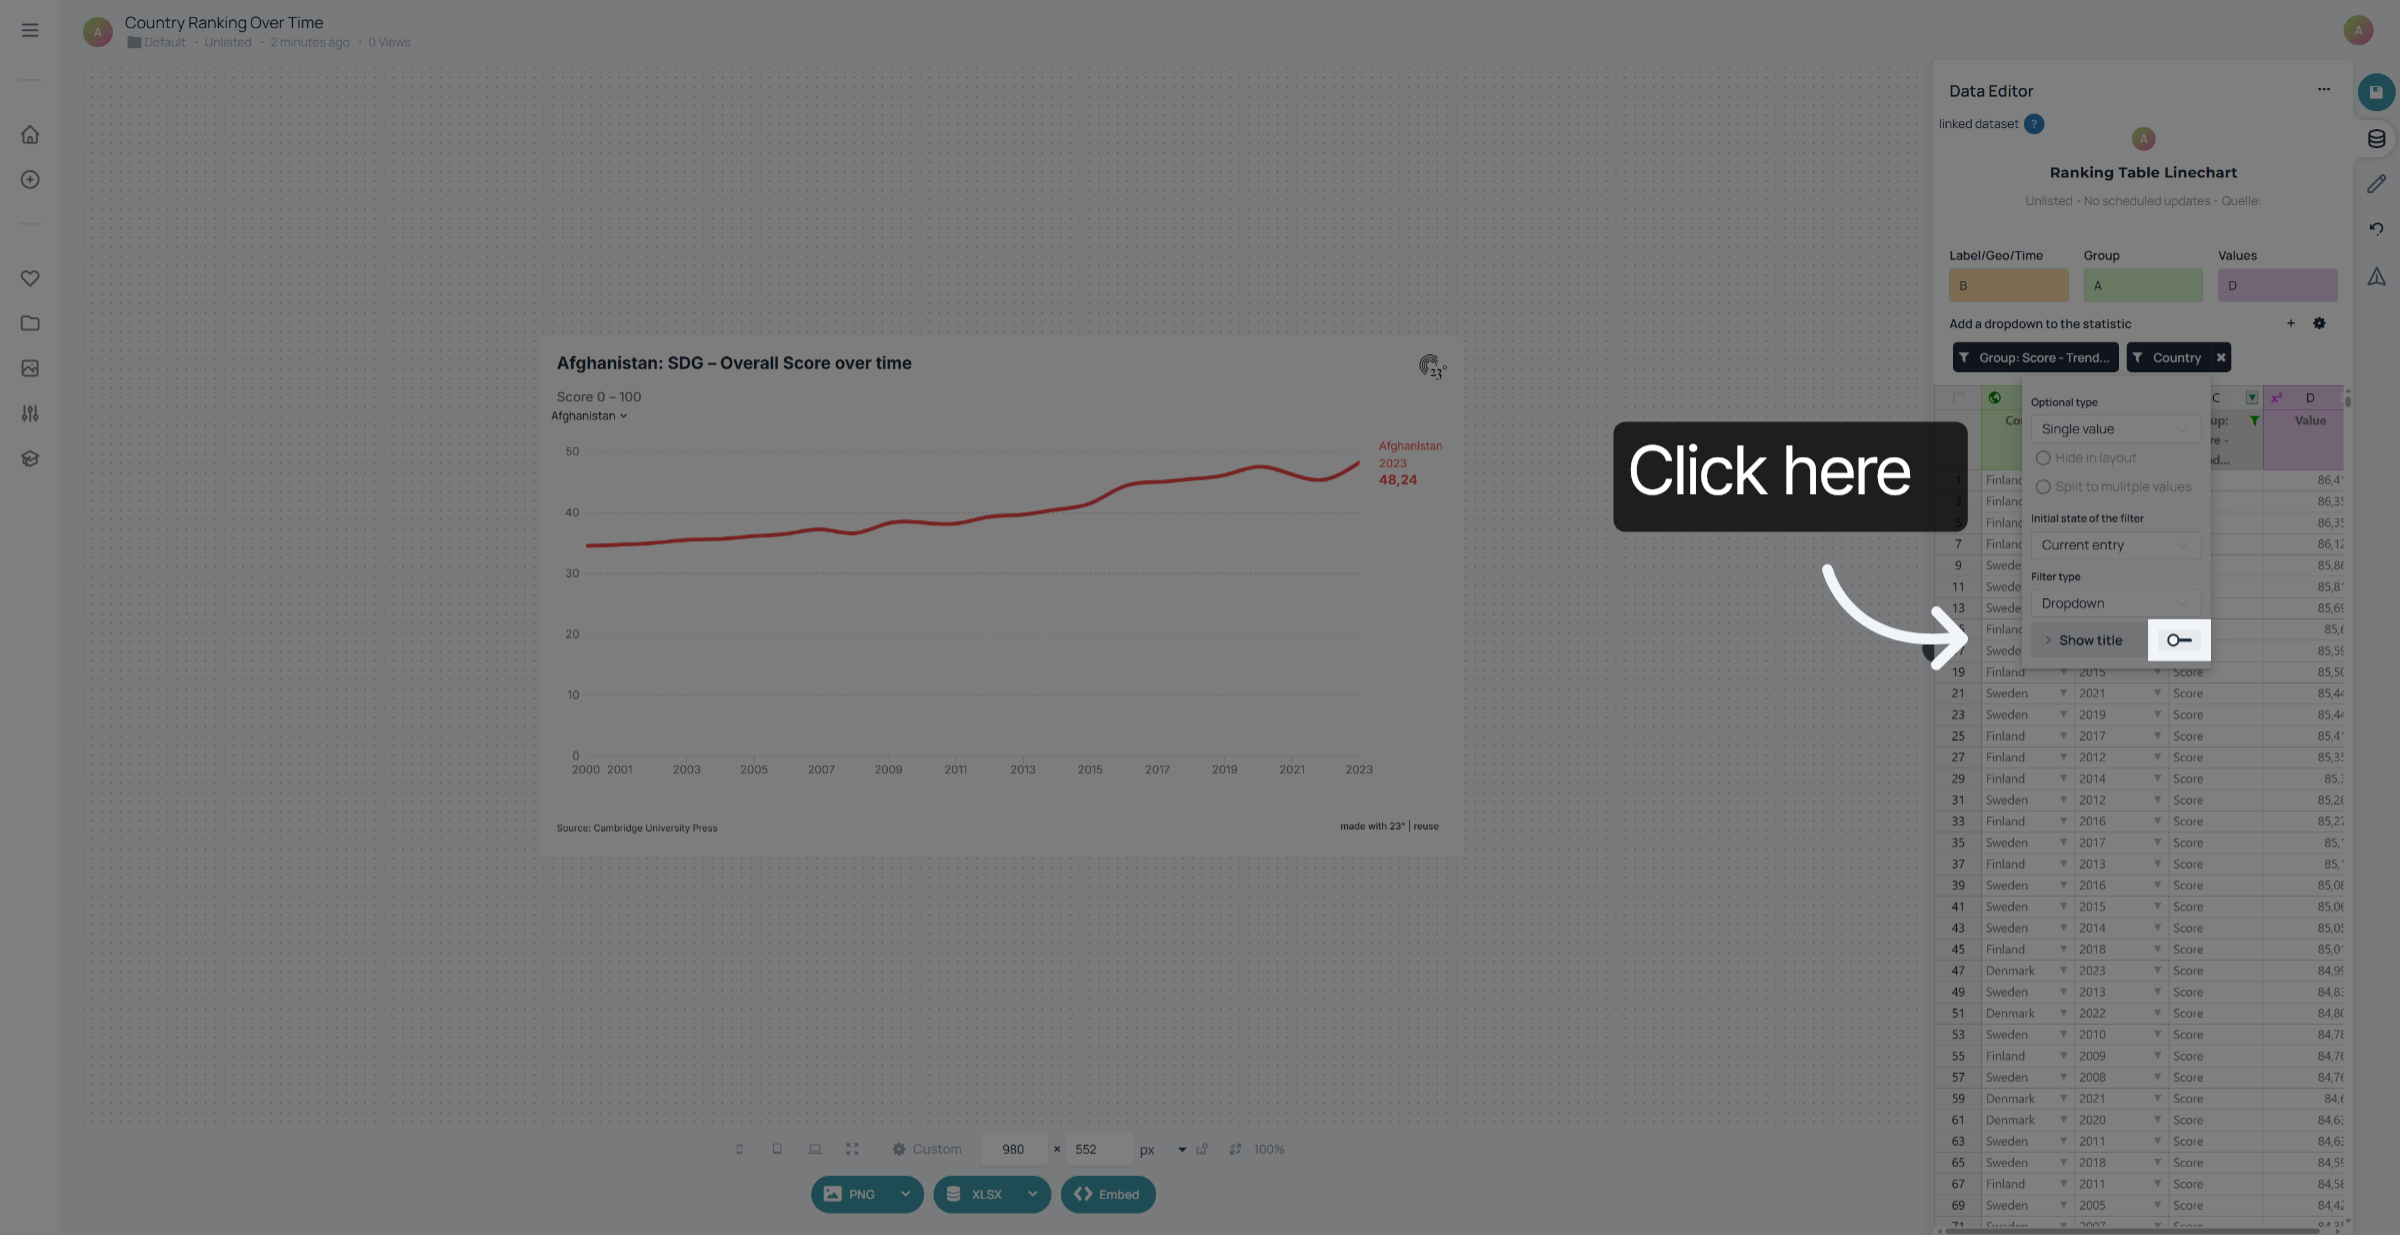
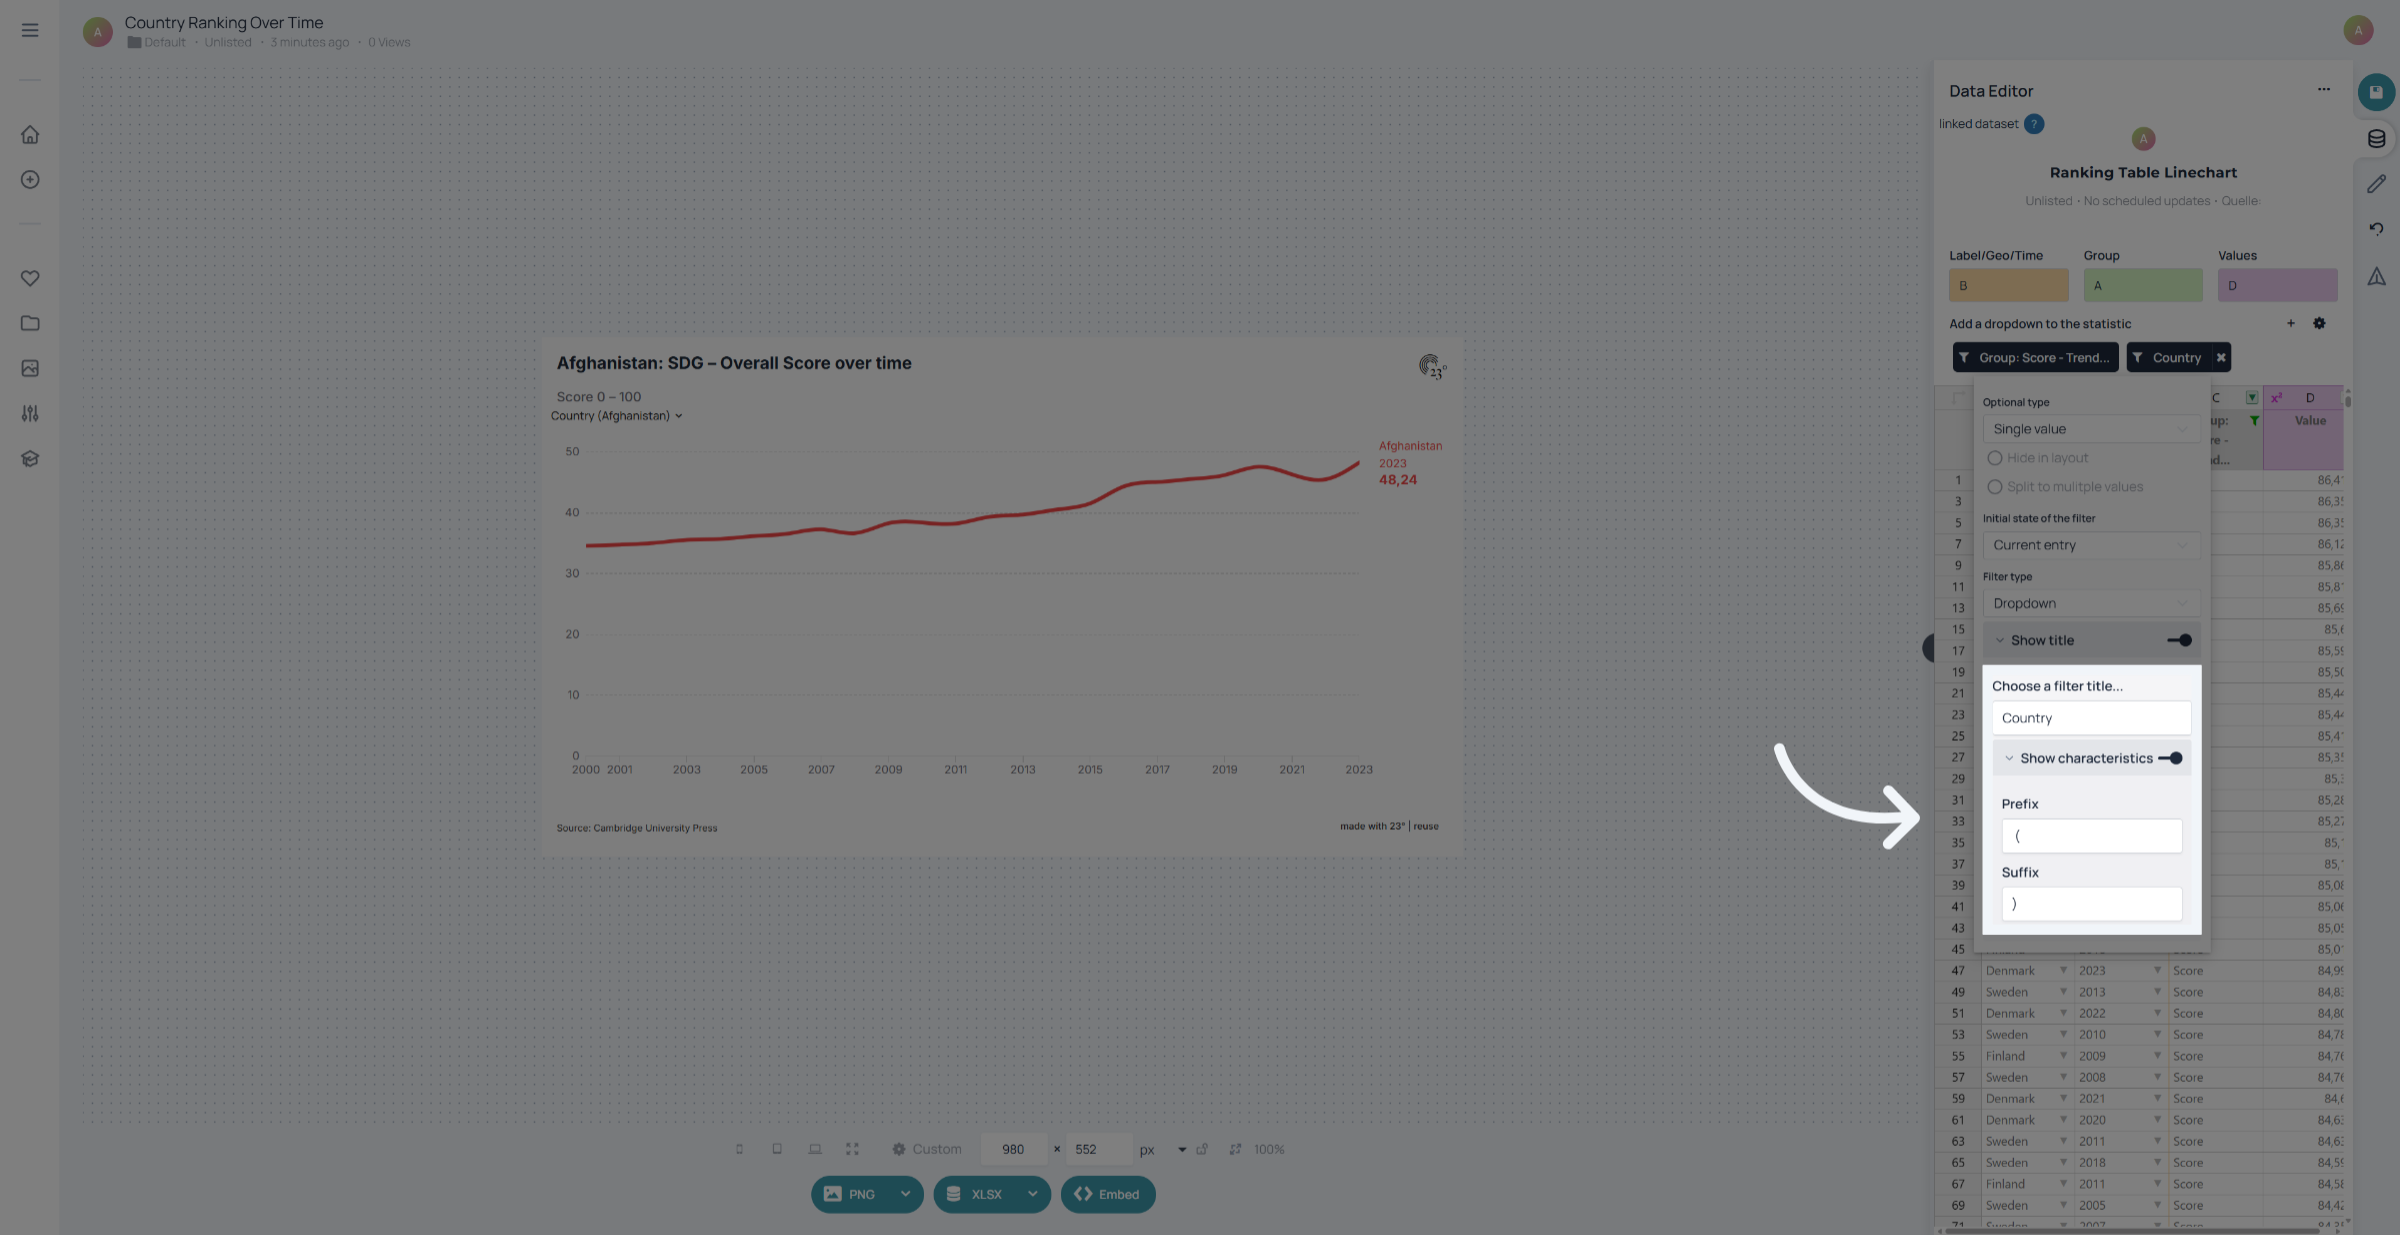
you can add prefixes and suffixes for the selected items.
your filter will be added under the subtitle section of your chart.
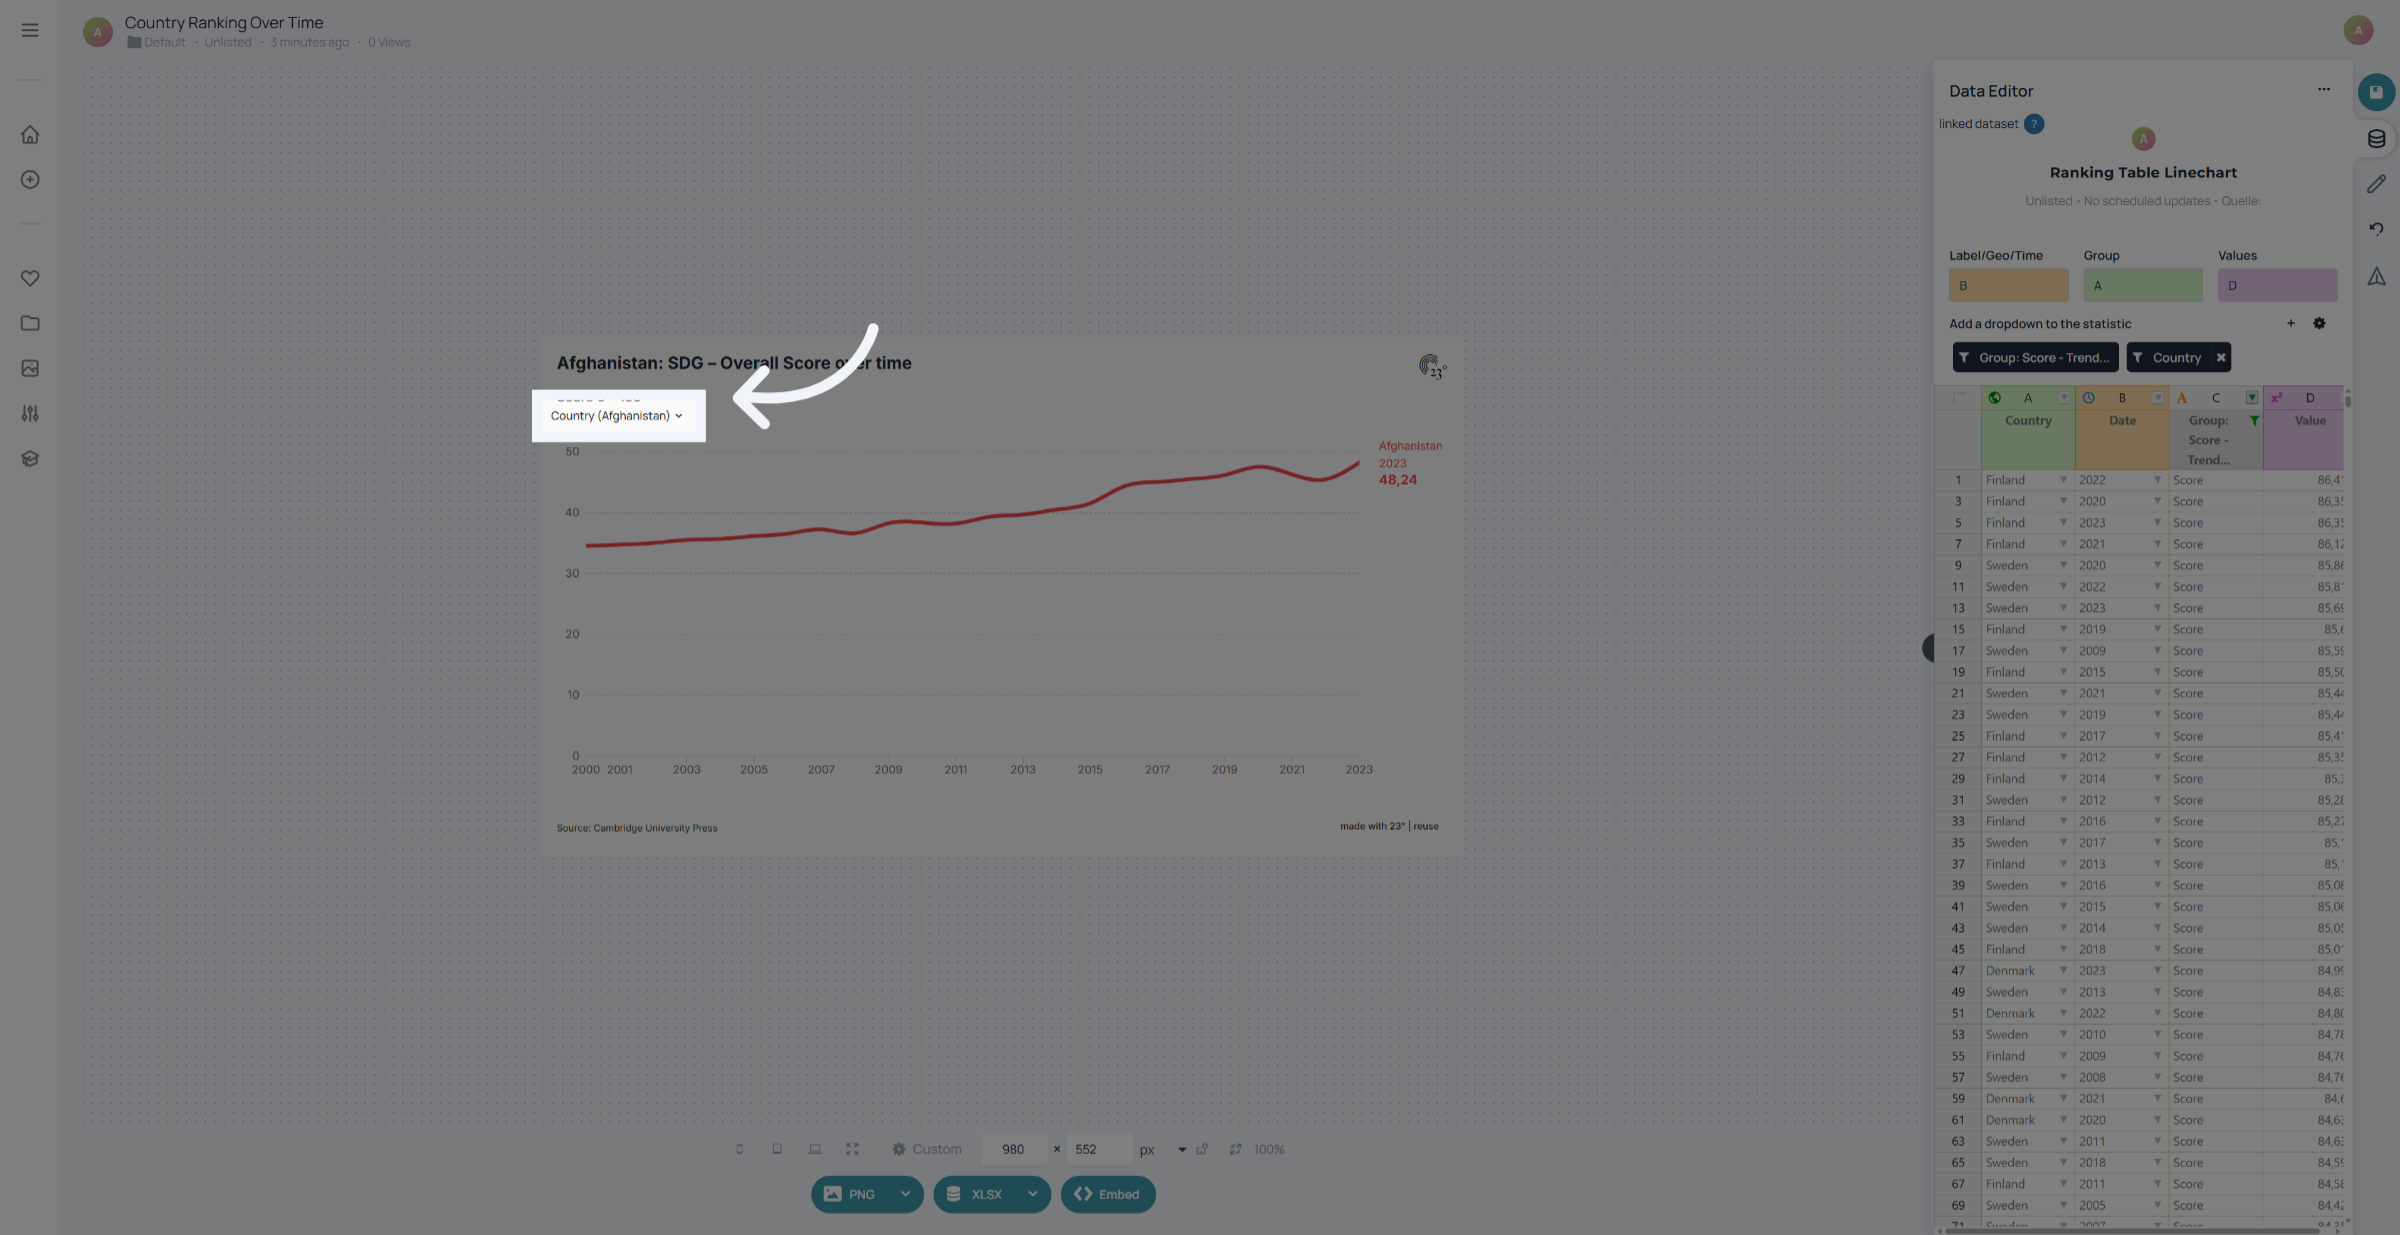
And thats it. Your chart is ready and users can select themselves what data they want to engage with.
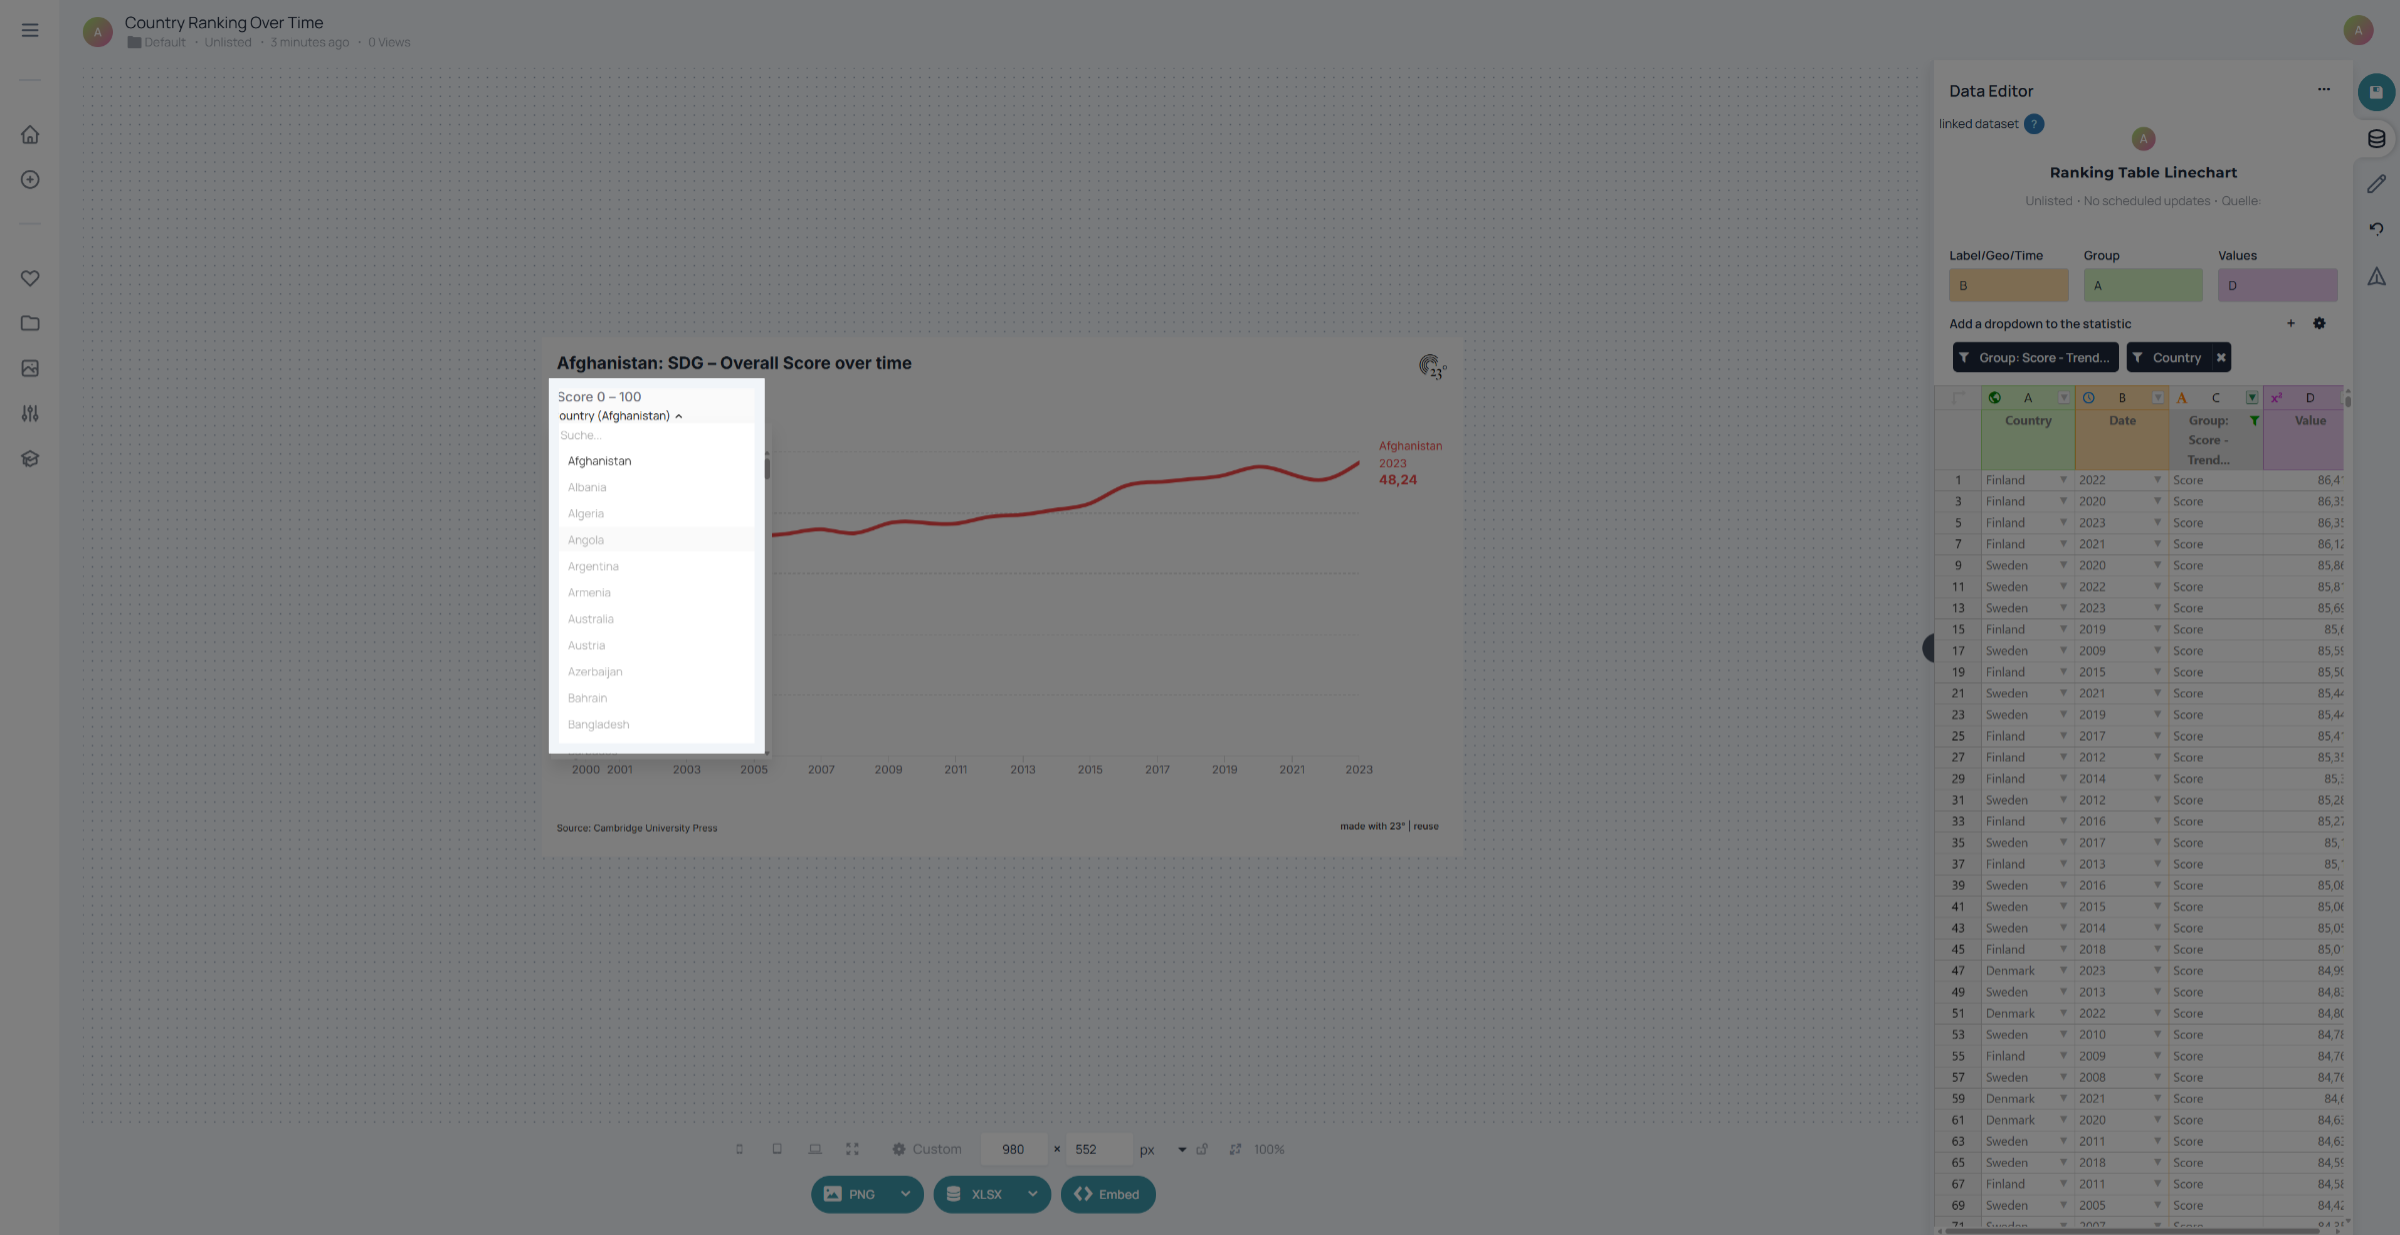
You have successfully added and configured a filter dropdown to a statistic in 23degrees. This setup allows dynamic filtering by country, enhancing data analysis and visualization capabilities.