Configure Dot Plot Label Display in 23degrees
This tutorial guides you through configuring label display settings for dot plots in 23degrees.
1. Introduction
You will learn how you can put categorical labels above the dots instead of using a legend.
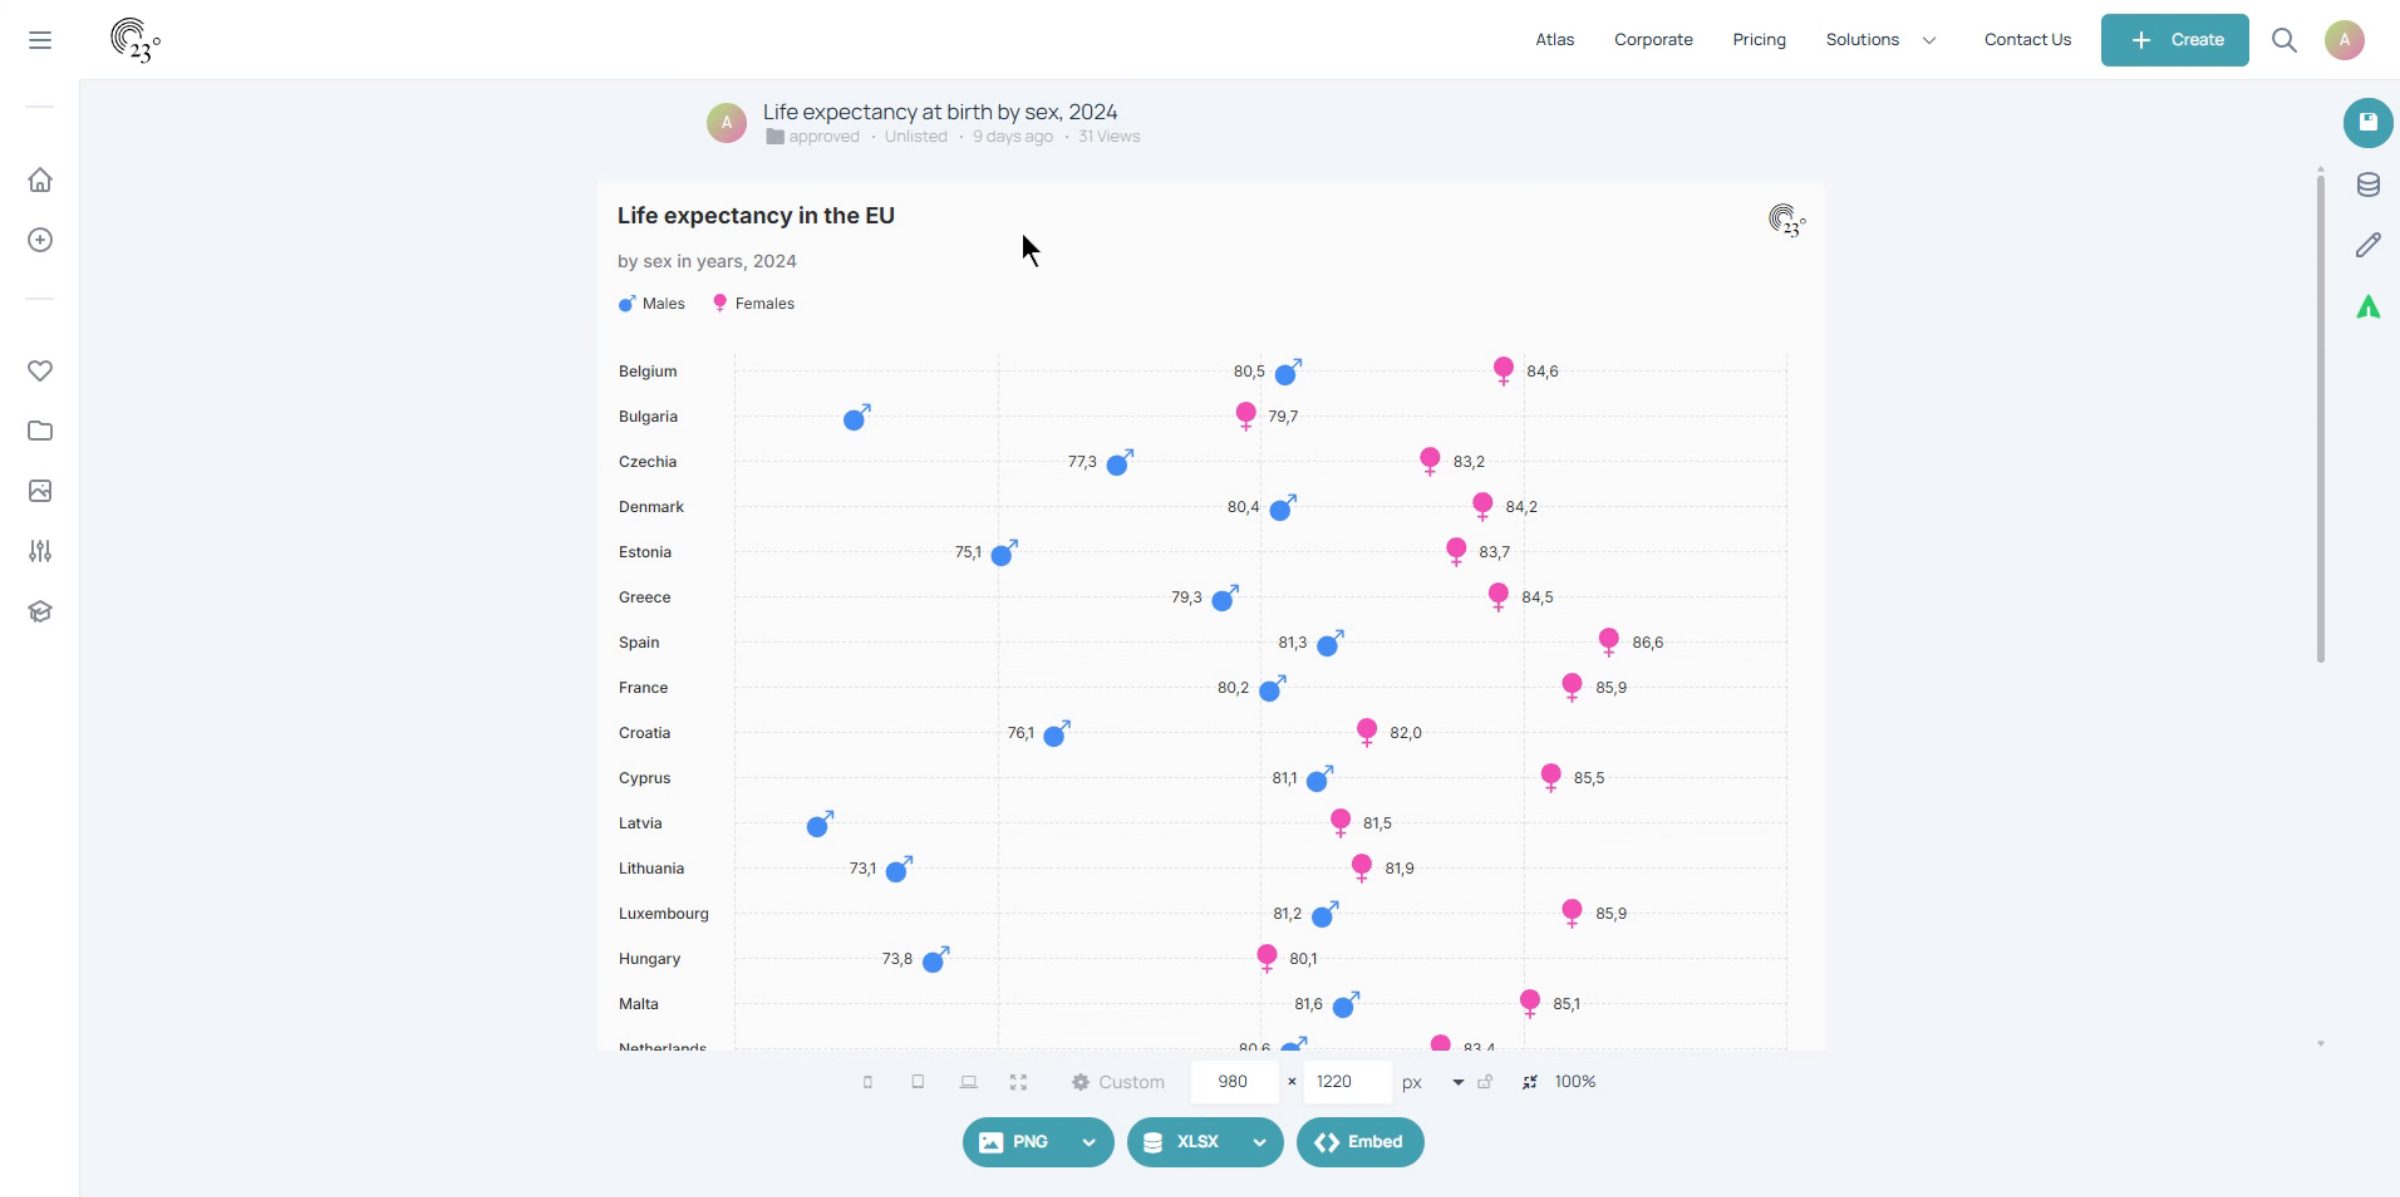
2. Start Editing
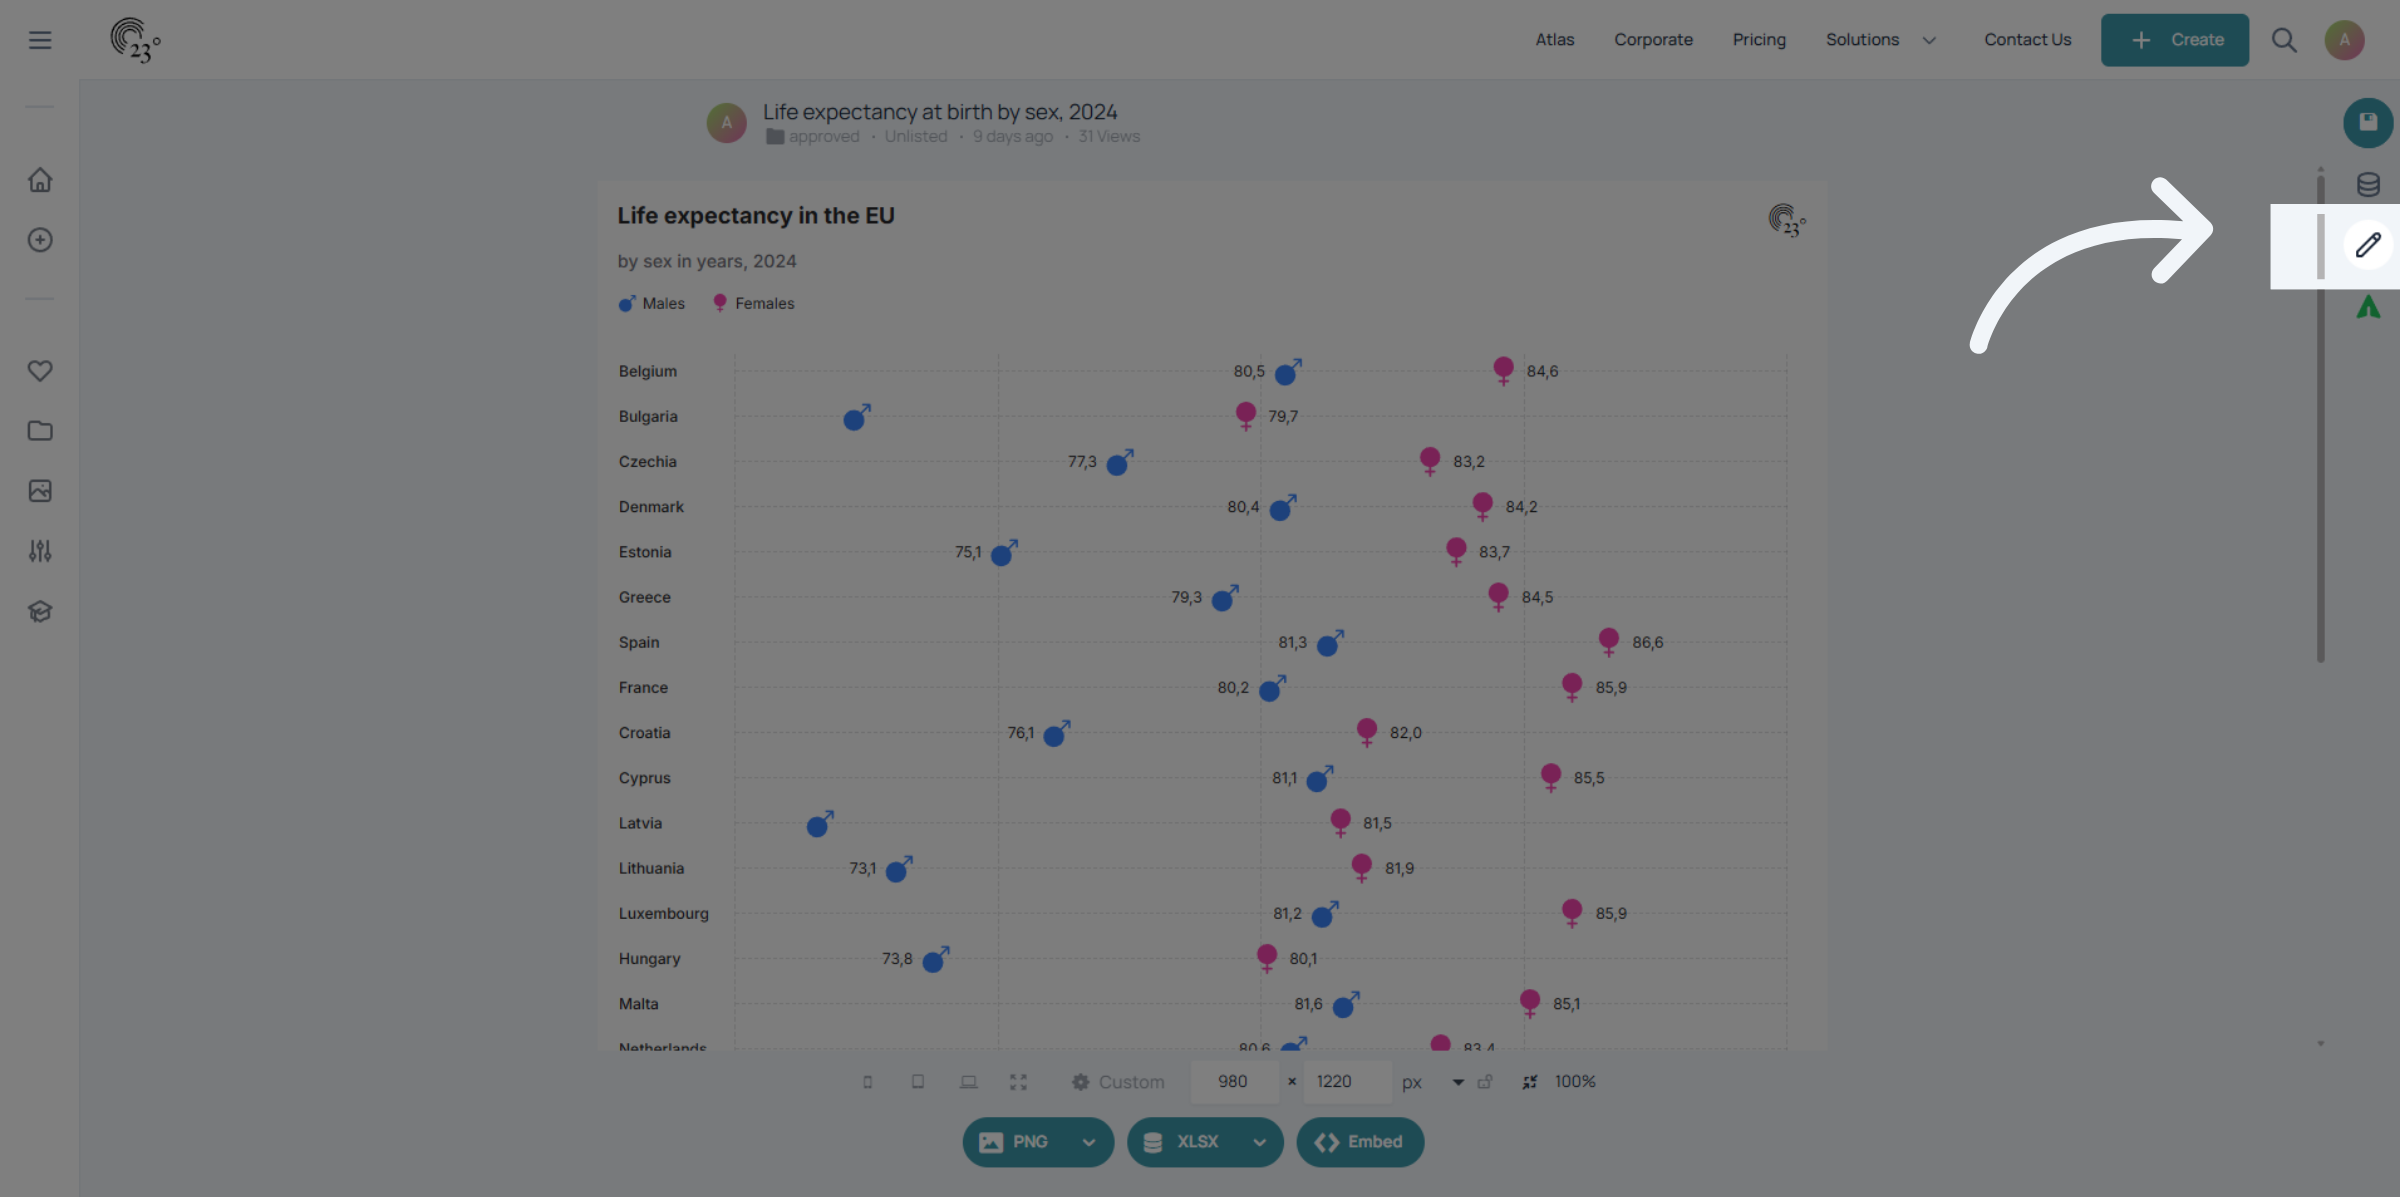
Click the Start editing button to begin modifying your dot plot visualization.
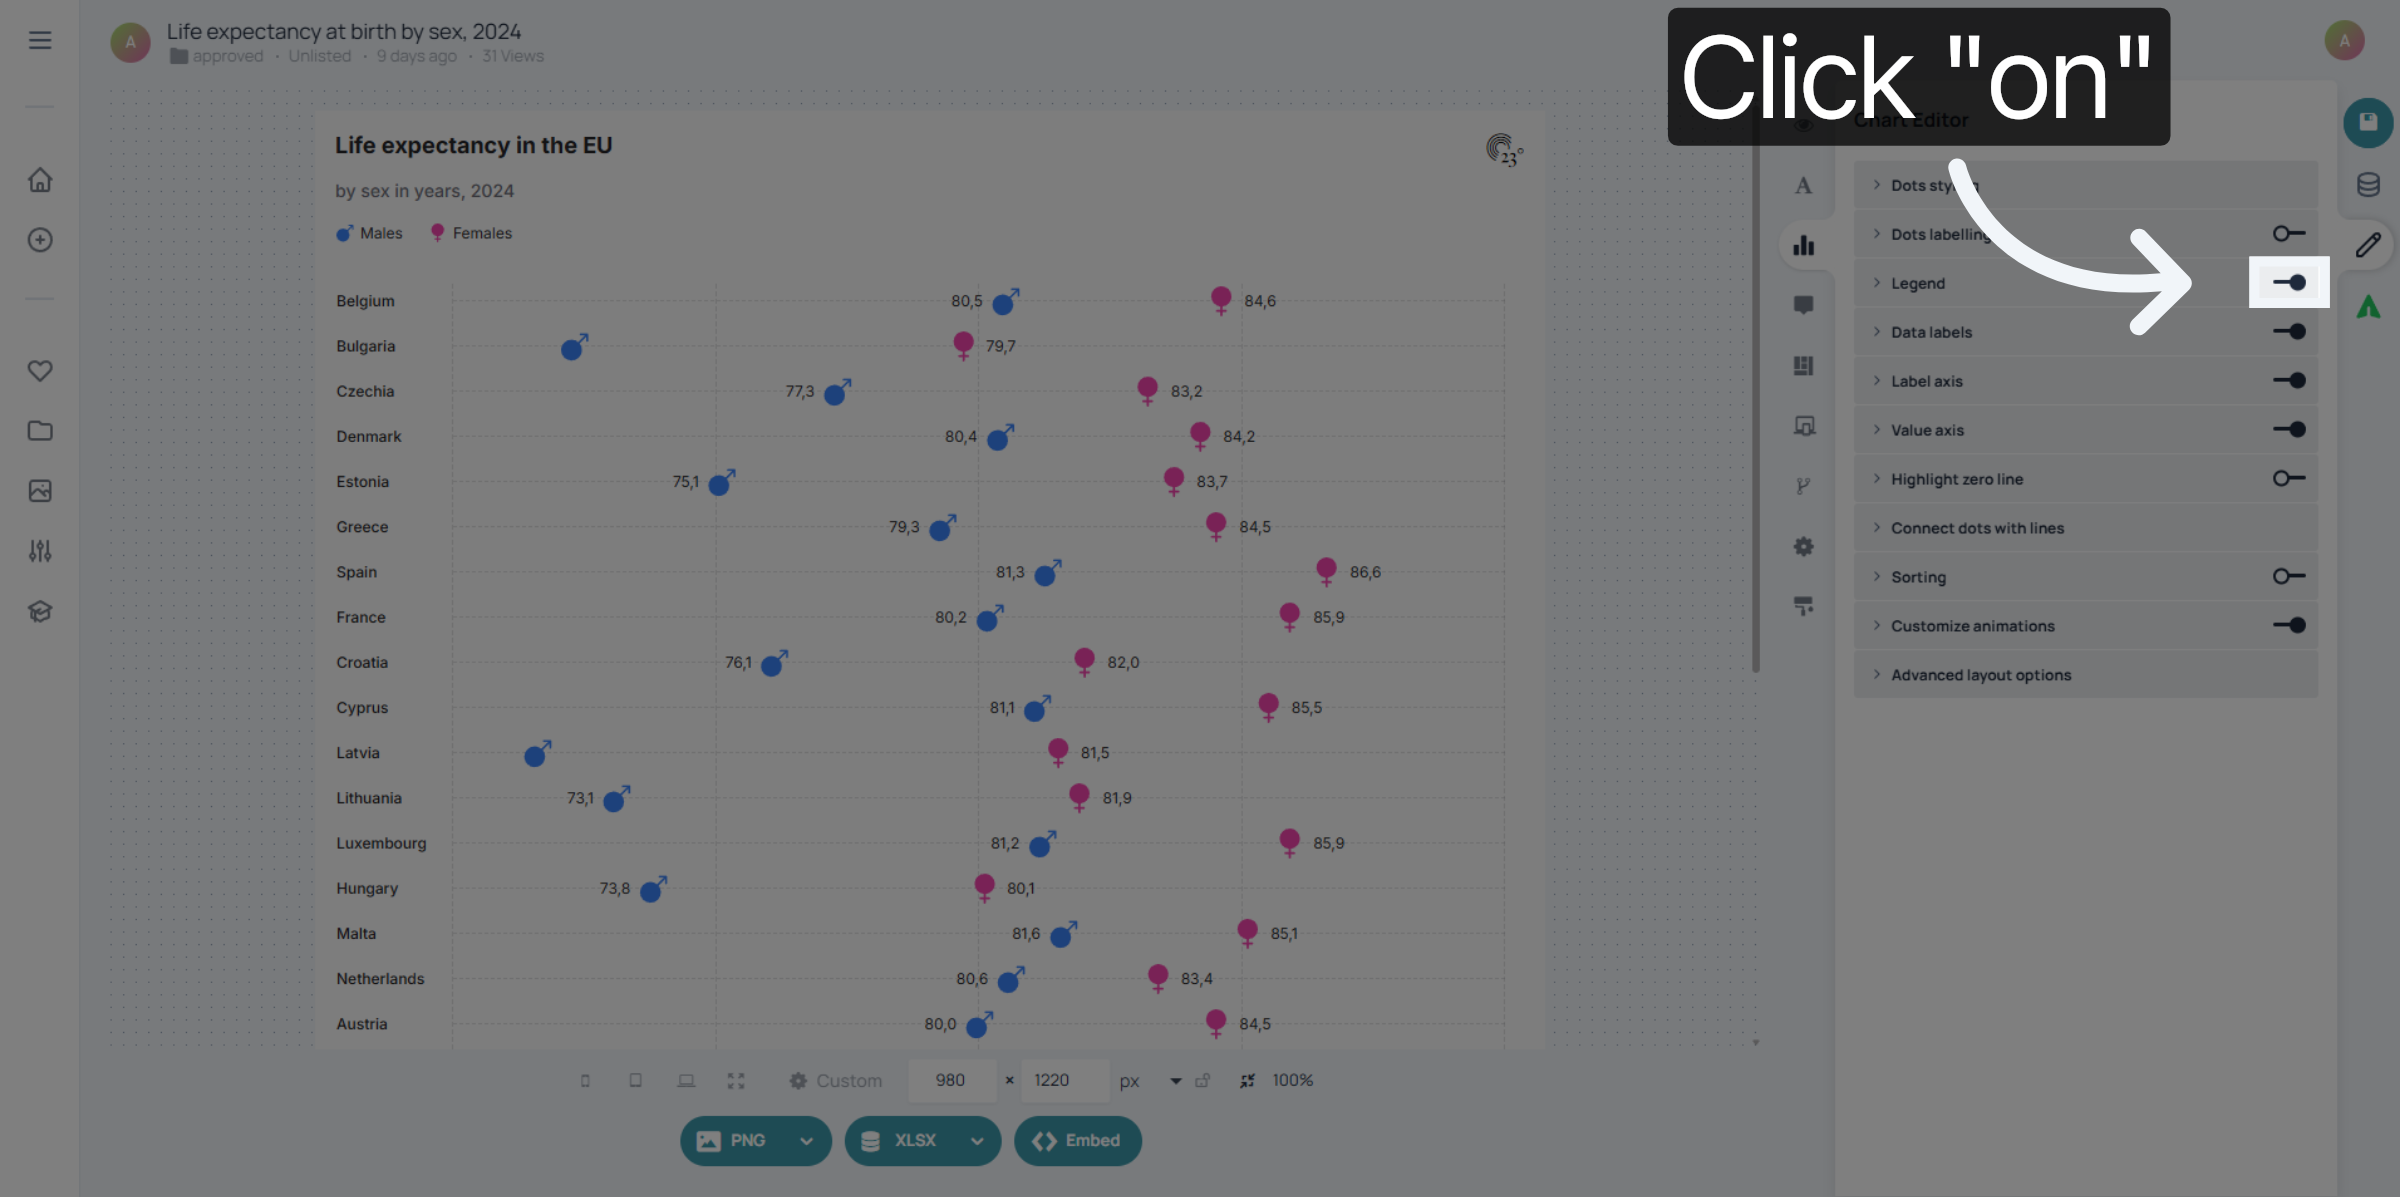
3. Disable Legend
First we want to disable the legend by toggling it off.
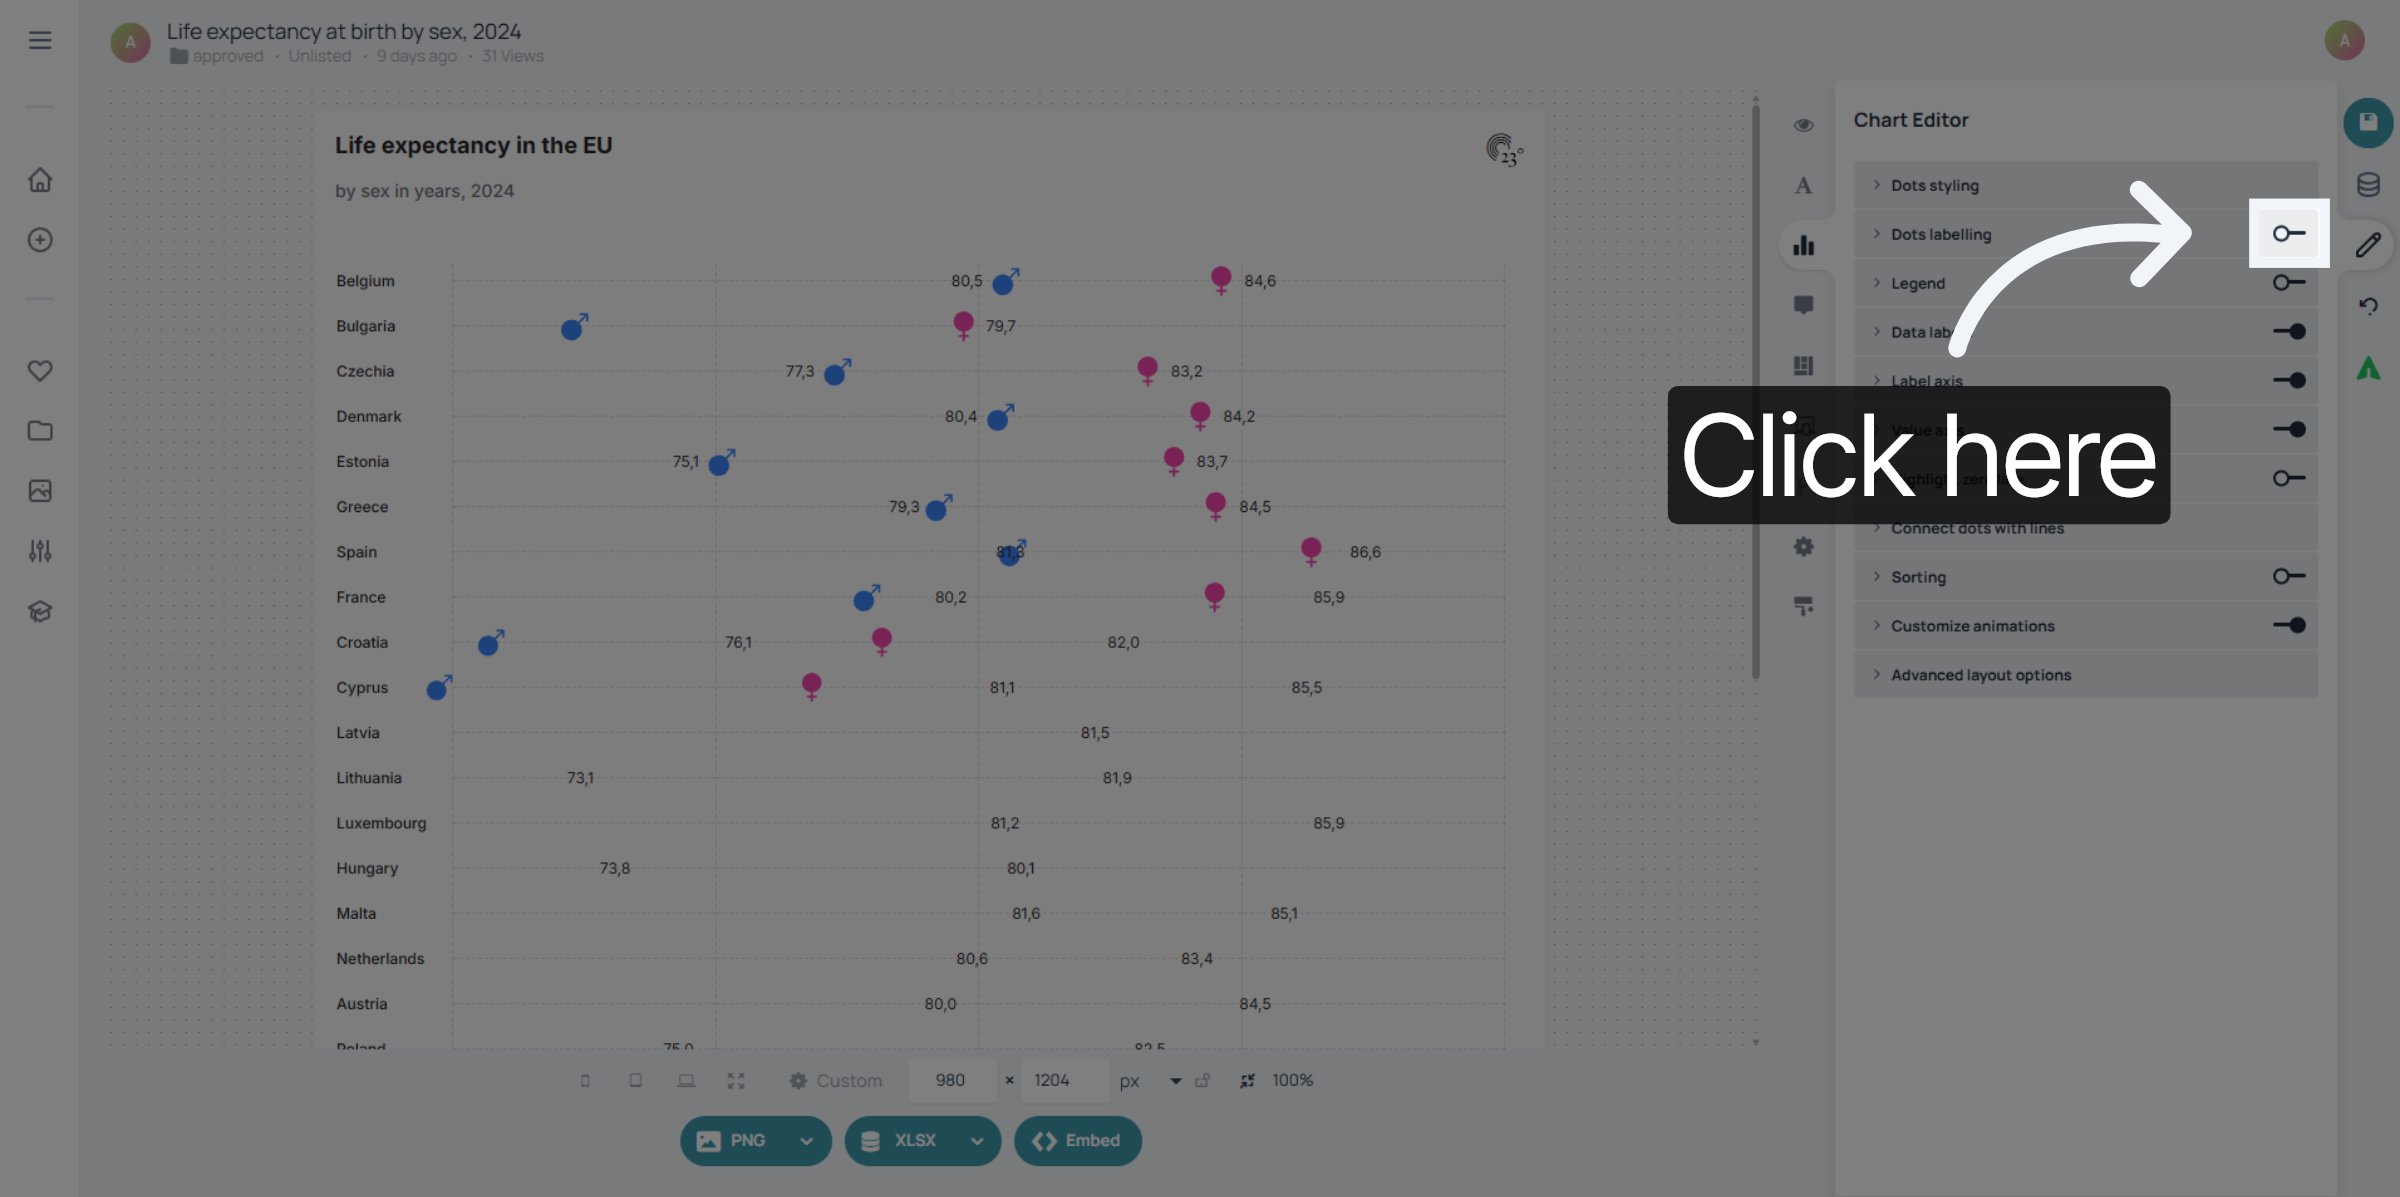
4. Data Labels
Next toggle on data labels.
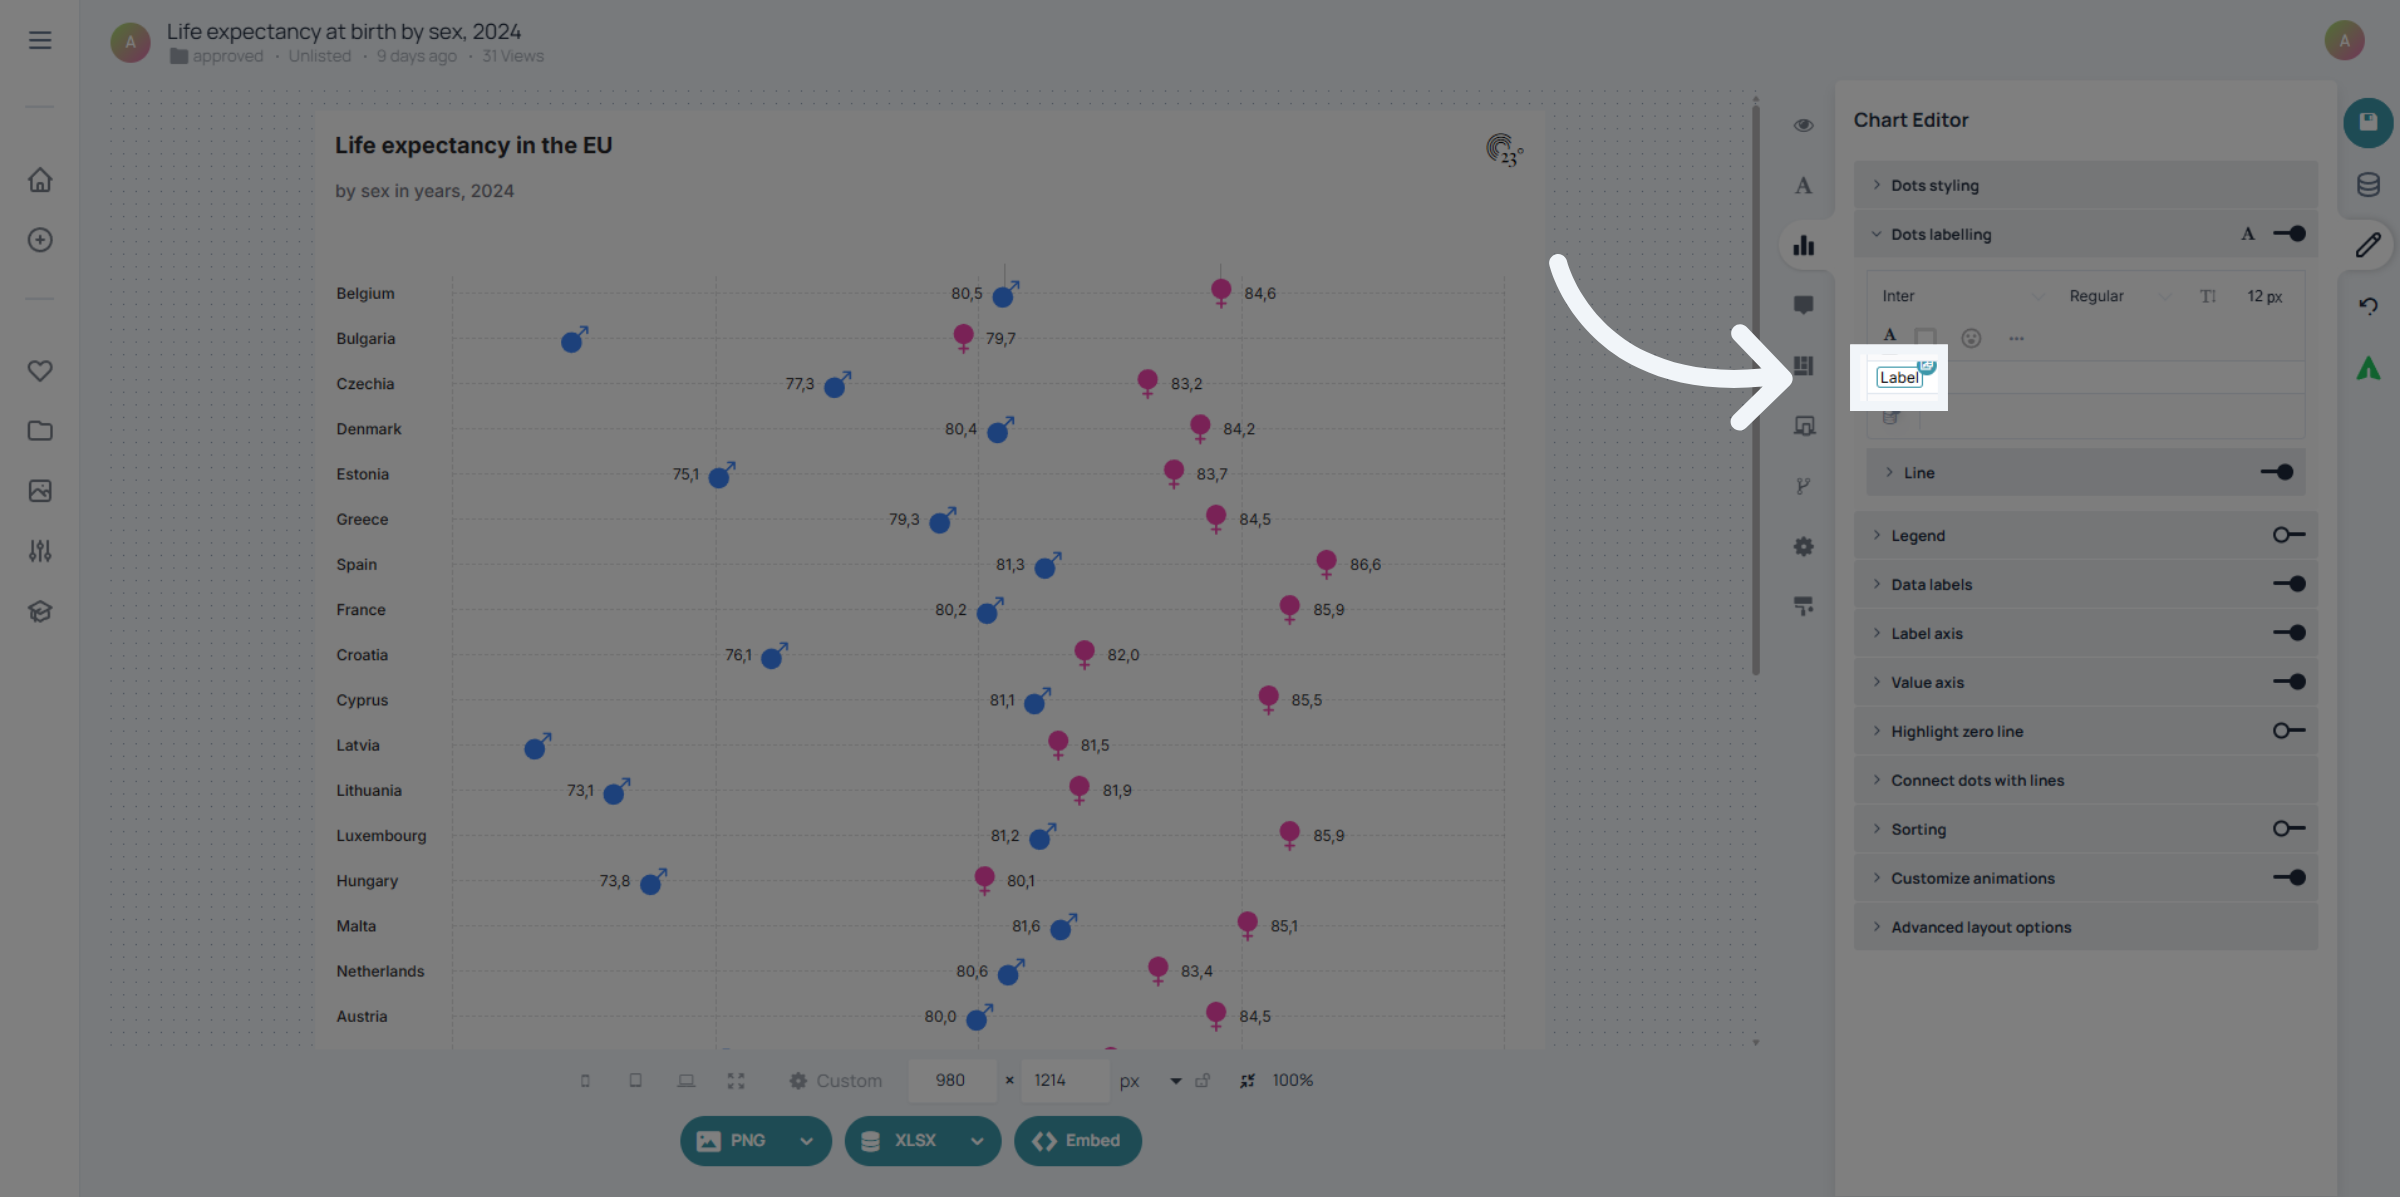
5. Datafield
Click on the data field to replace it.
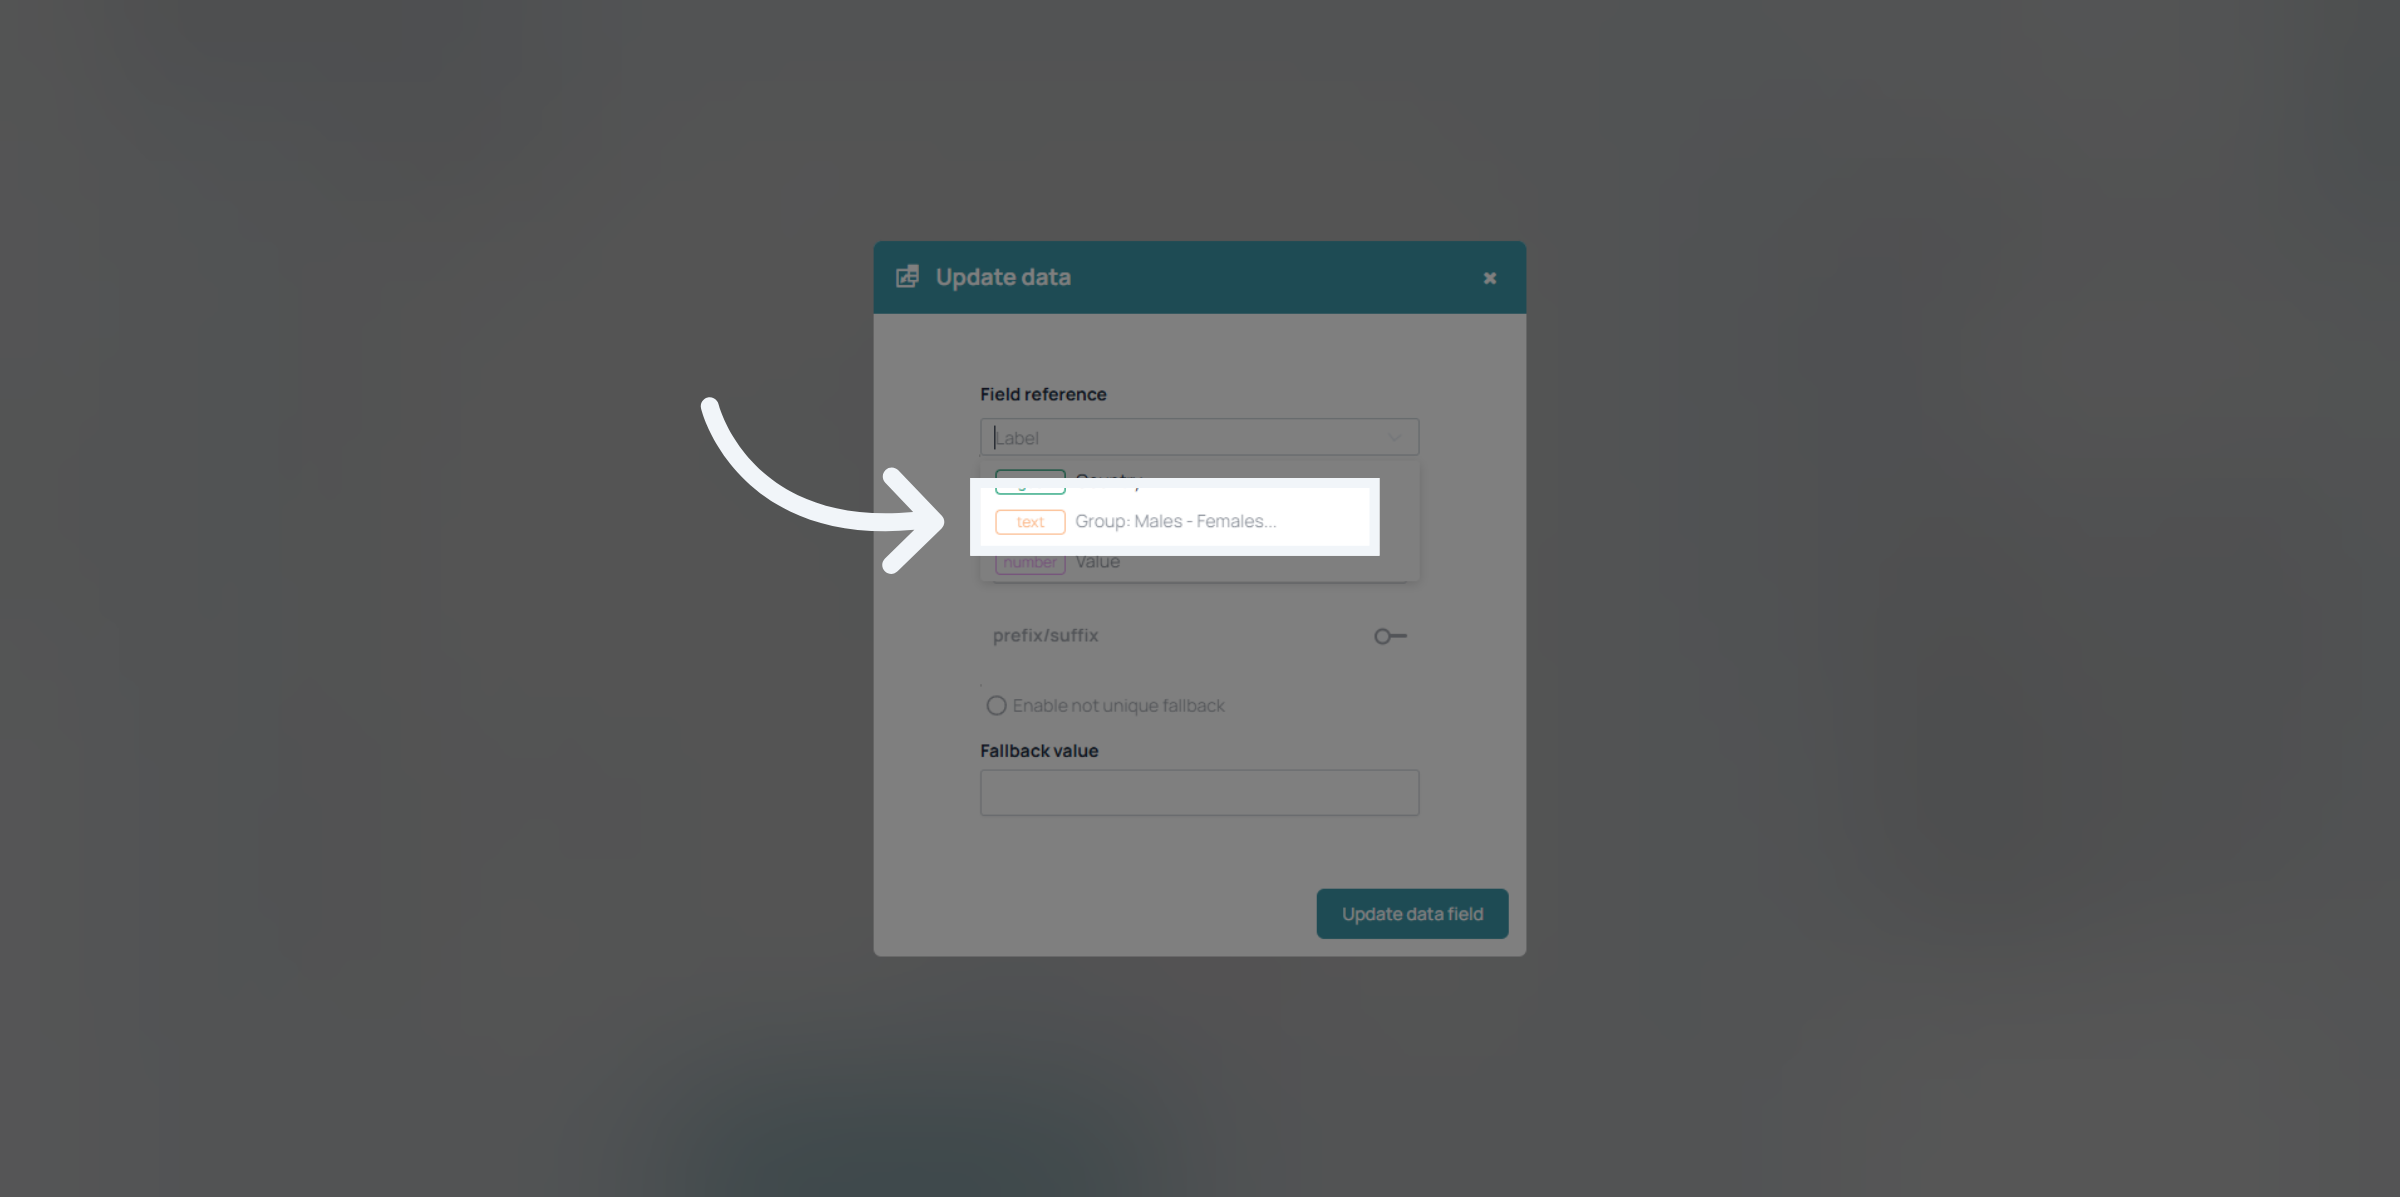
6. Category Column
Select your category column which is going to be used to display the label categories.
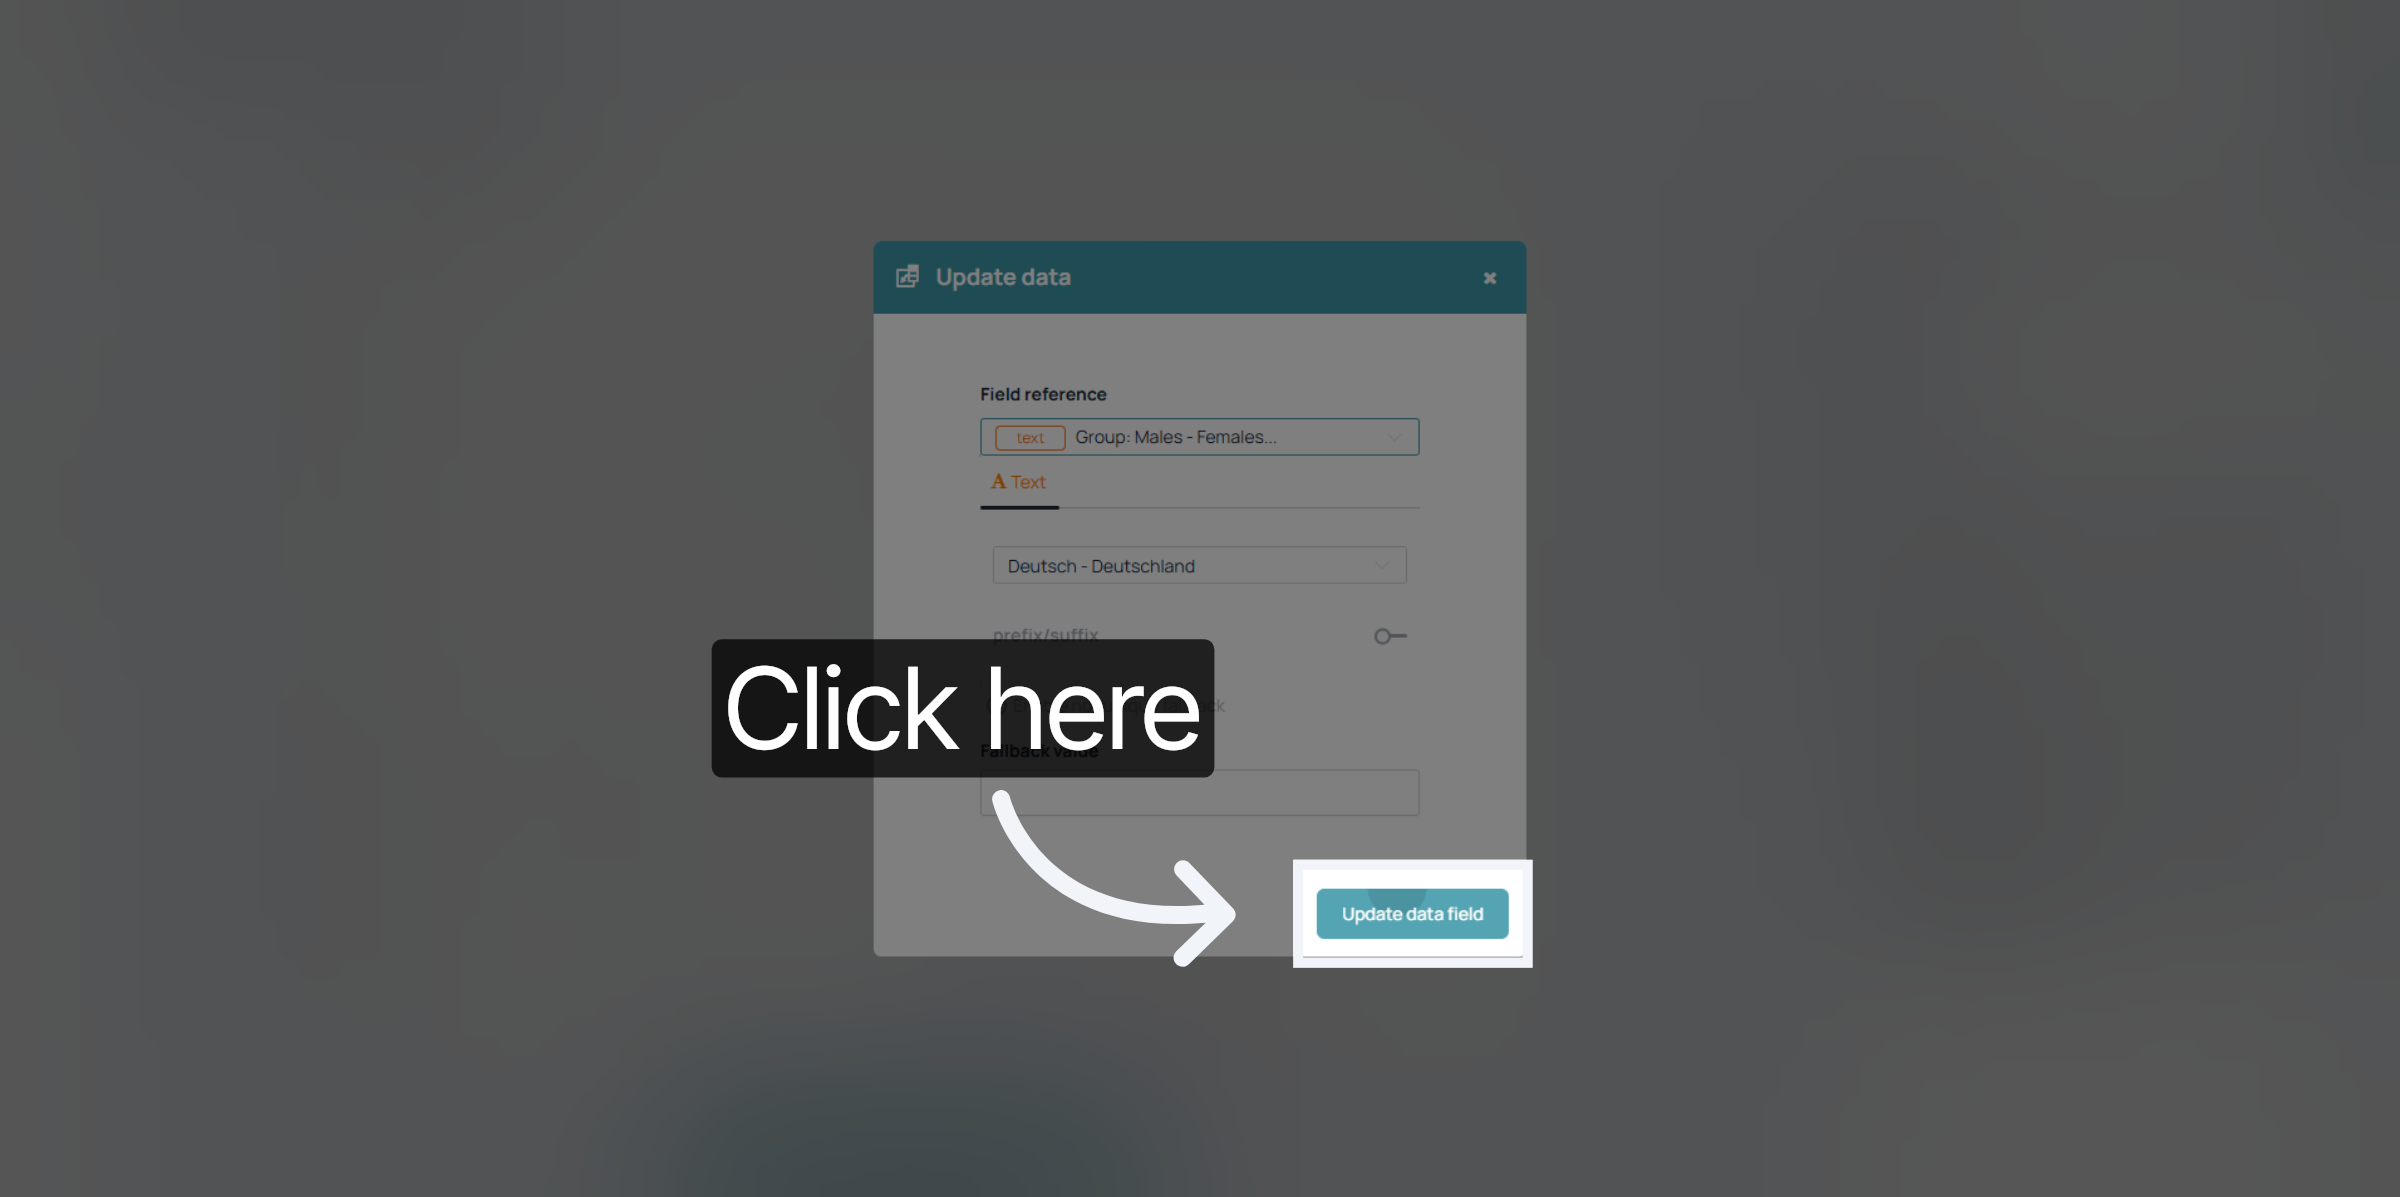
7. Update Data Field
Confirm your selection by updating the data field.
8. Finish
And that's already it.
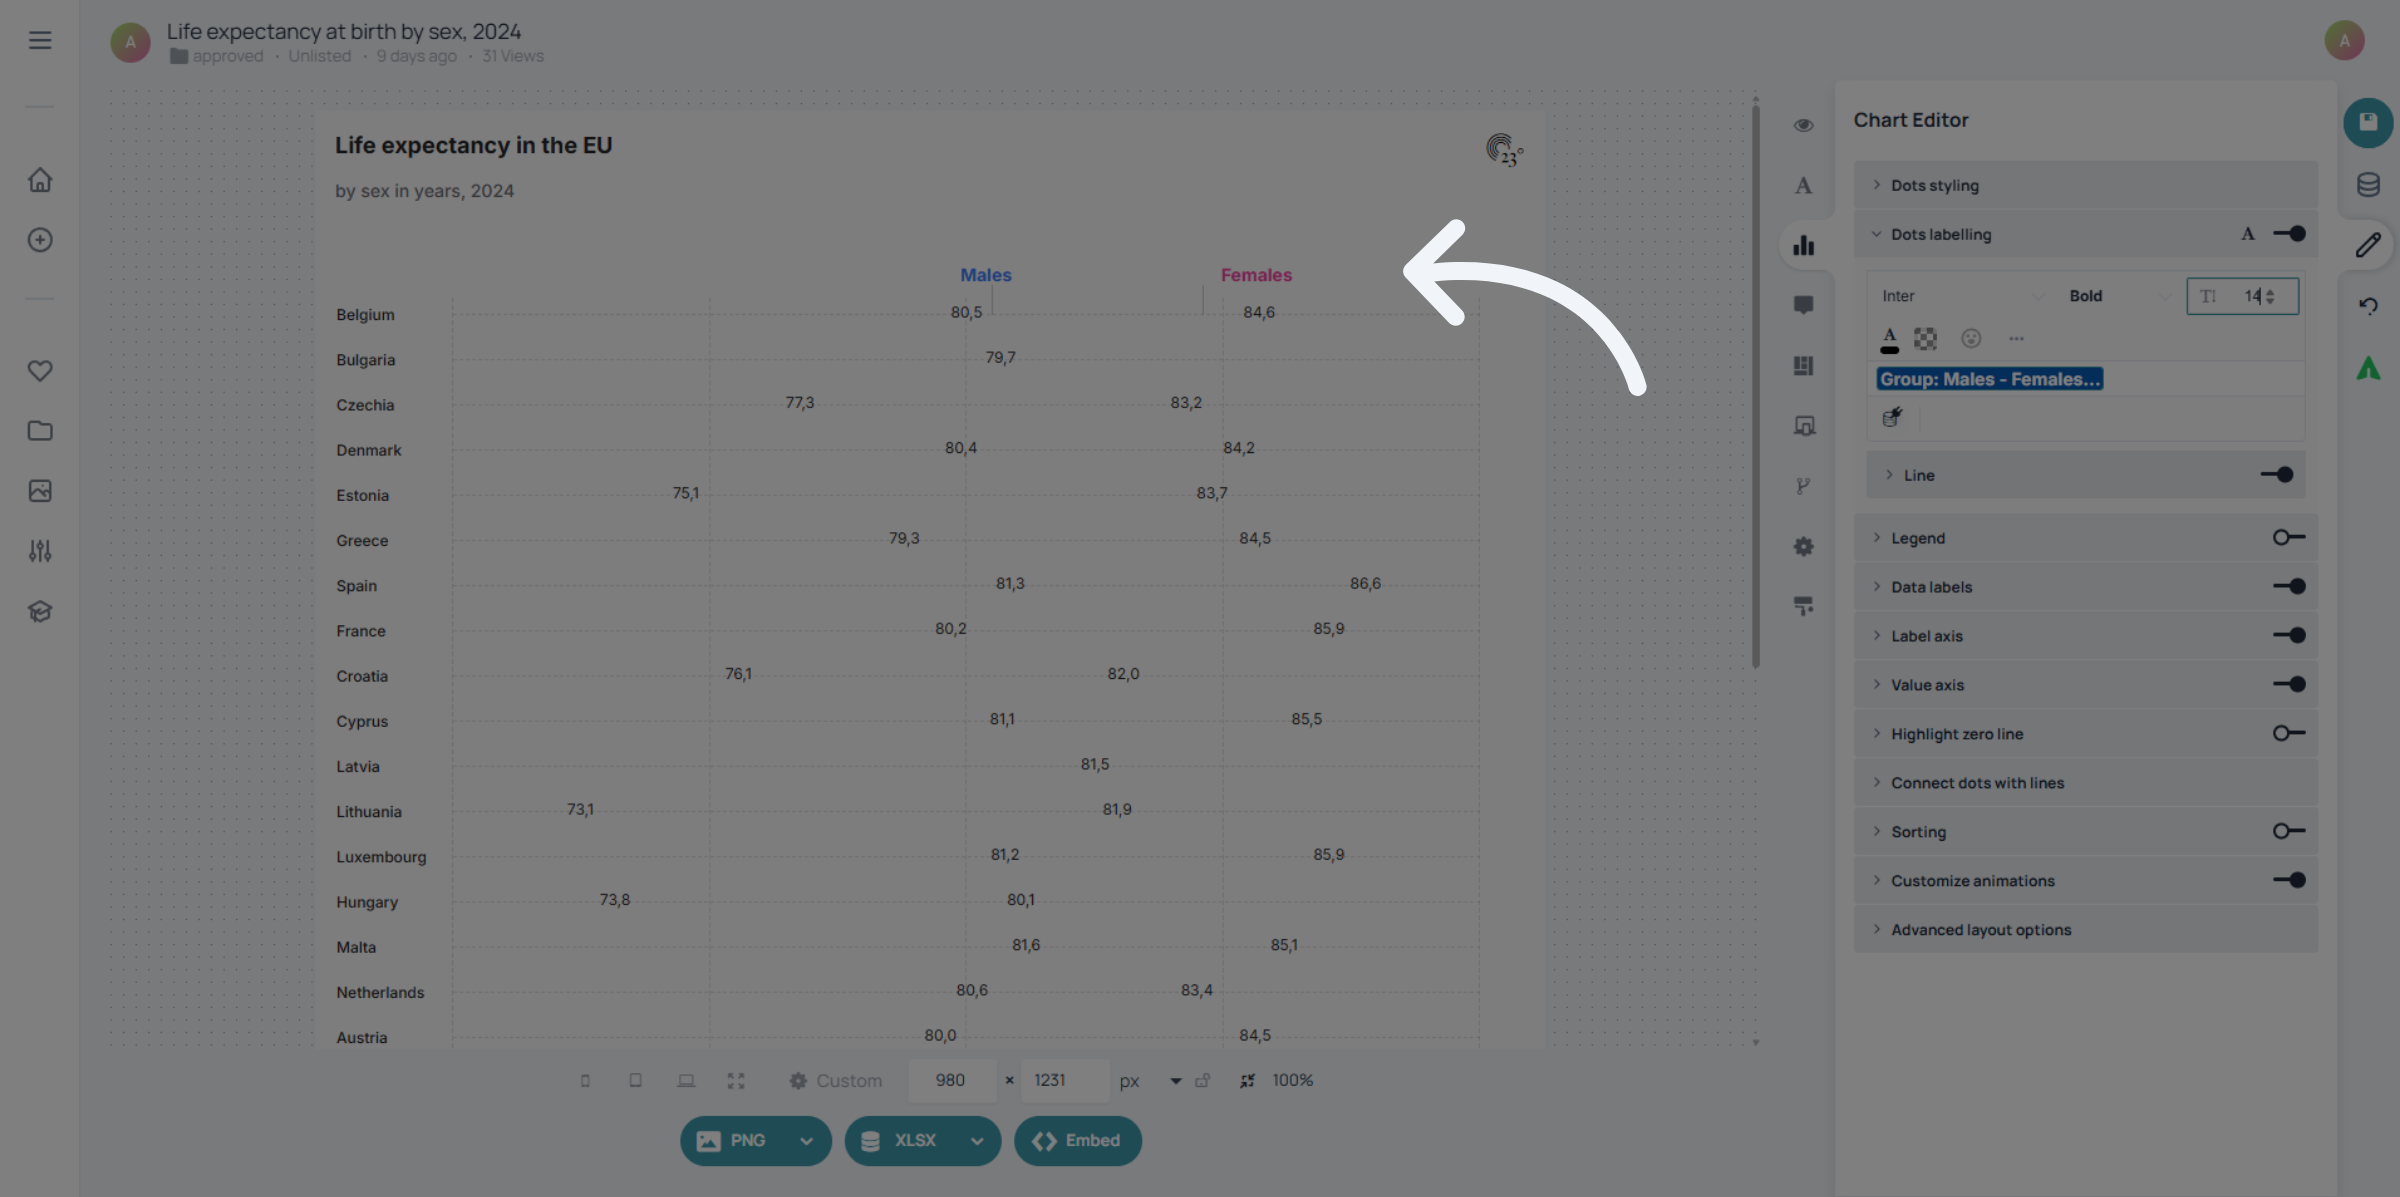
You have successfully configured the label display settings for your dot plot in 23degrees. Check out other tutorials for more chart insights.