layout.skipToContent

How to use symbols in Dot Plots

This tutorial guides you through editing the style of dots in your 23° dotplots.

applicationUI.publishedAt 6 de mayo de 2026
1. Go to the chart editor

If you have created a dotplot and want to customize the style of the dots, go to the chart editor.
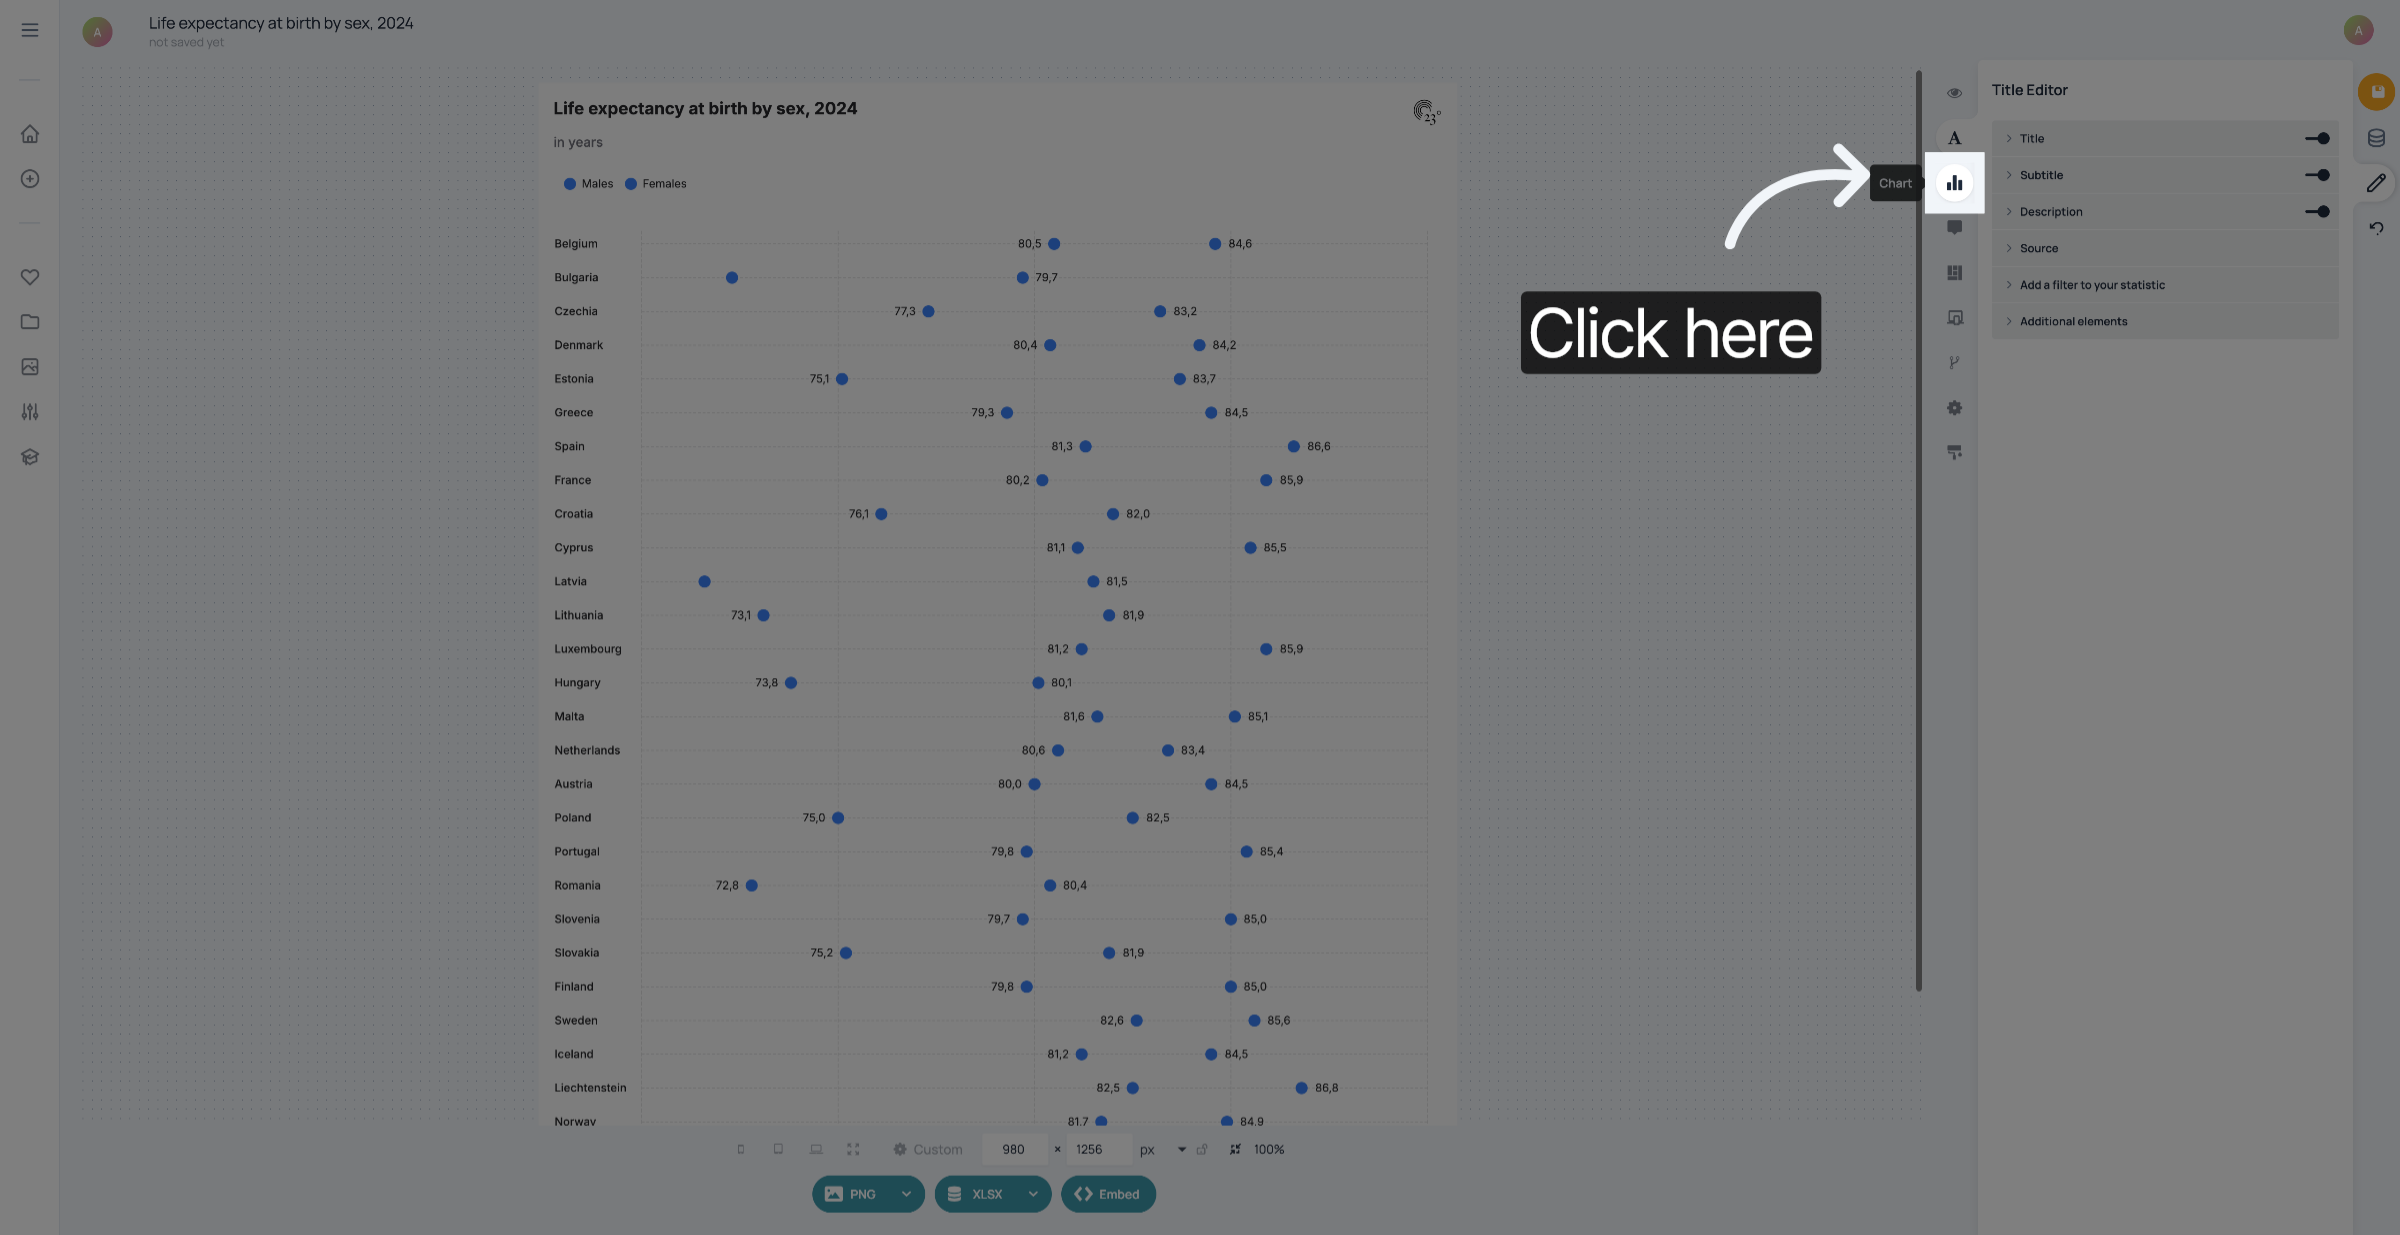
Go to the chart editor
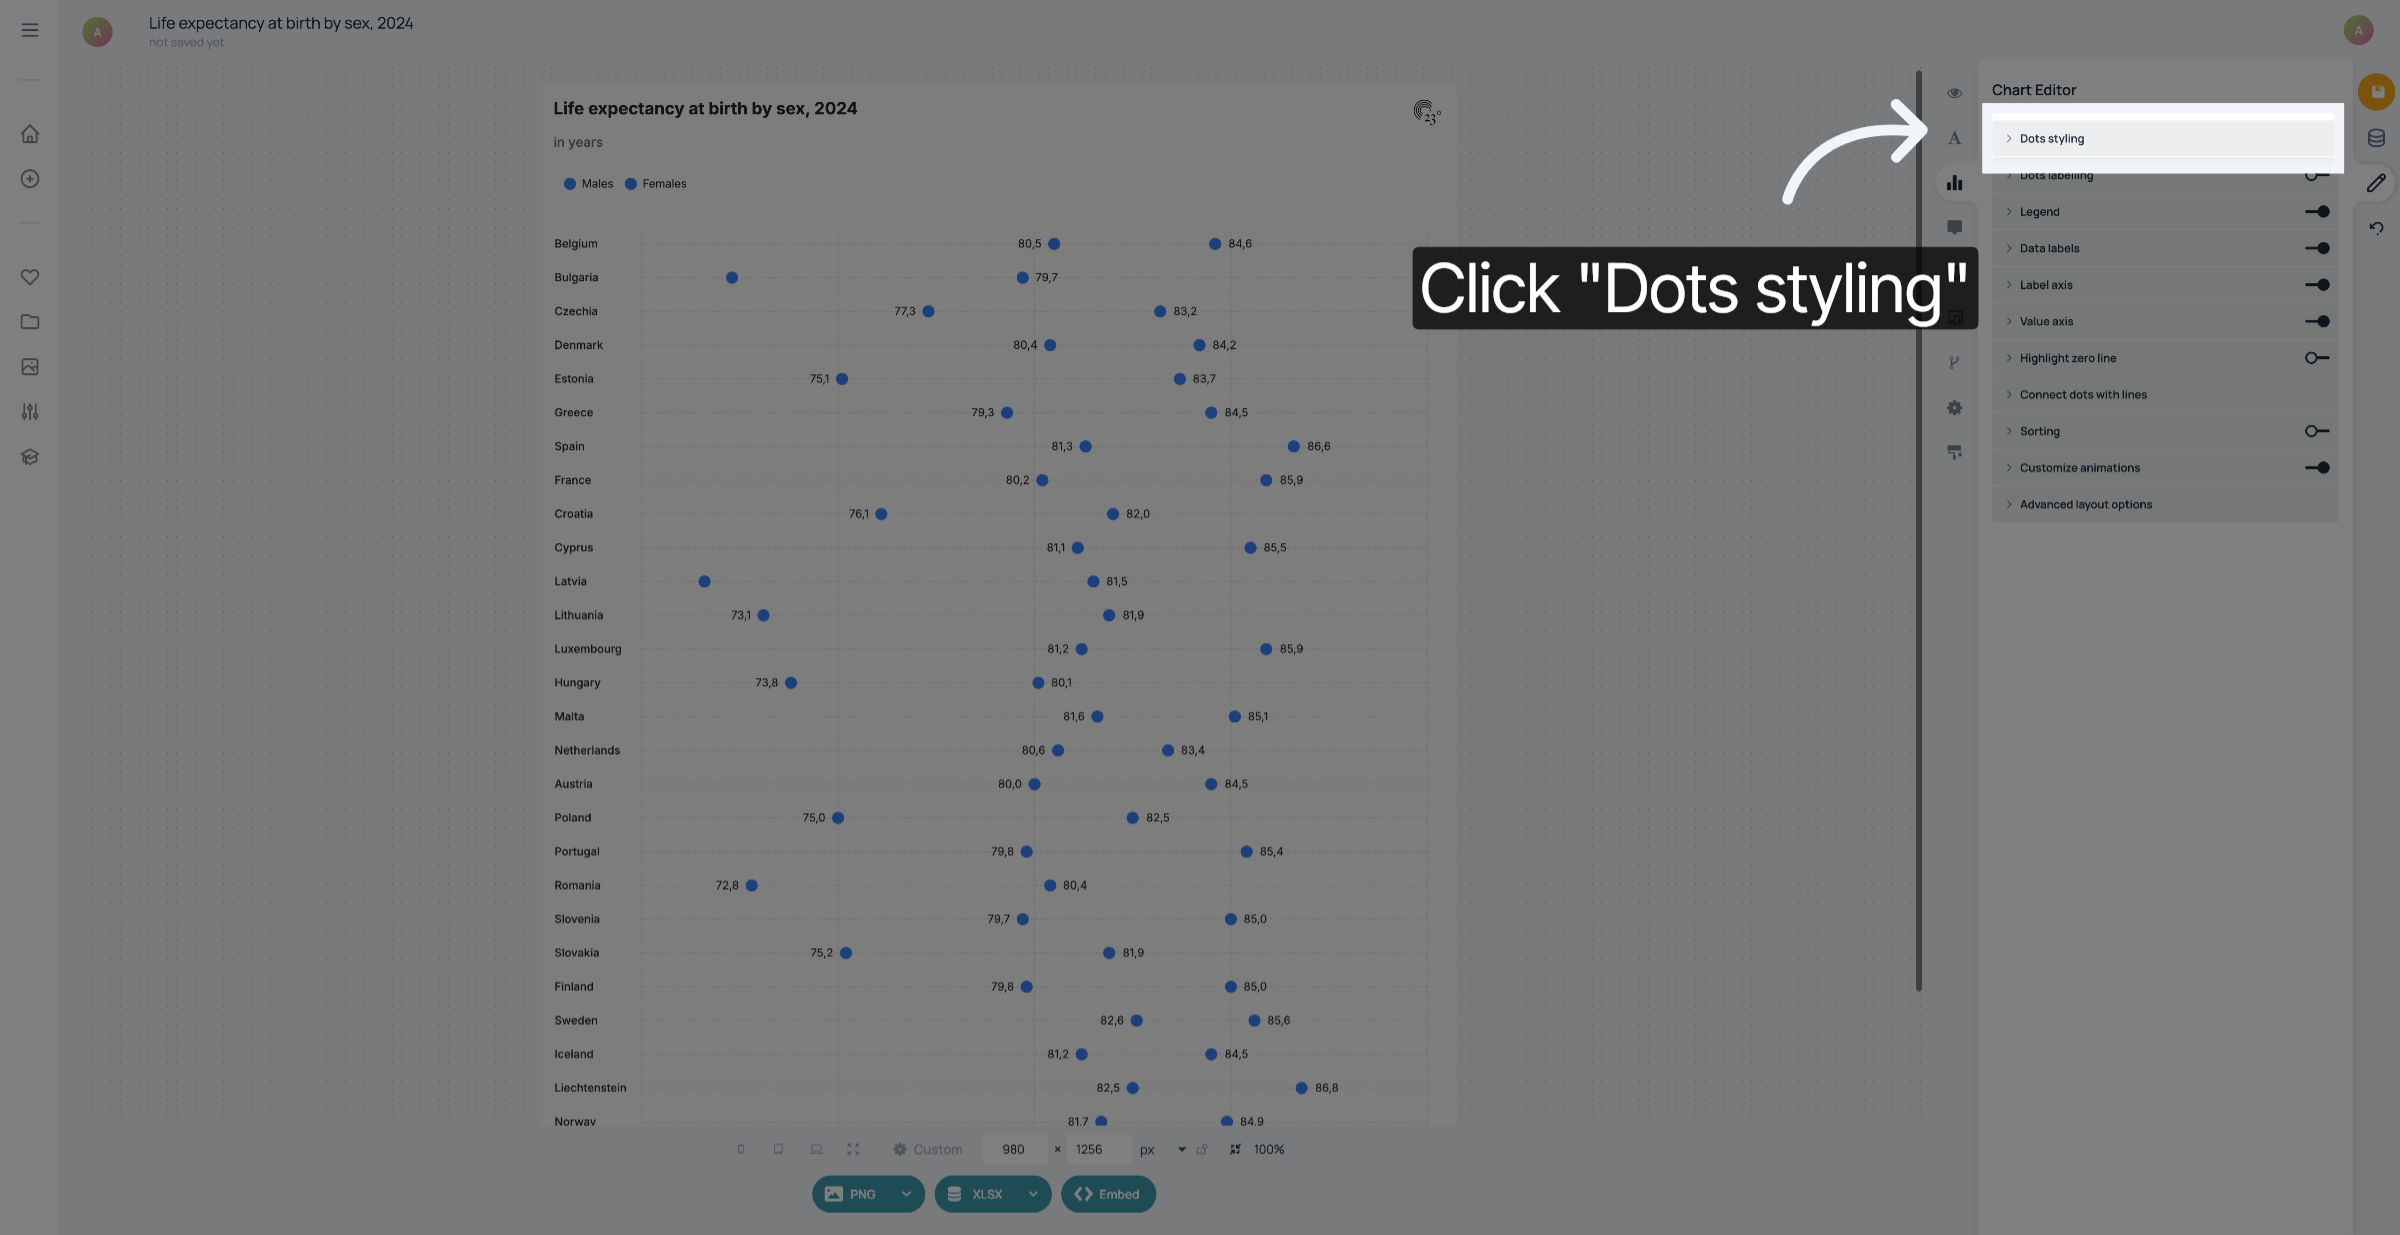
2. Click "Dots styling"

Click "Dots styling".

Click 'Dots styling'
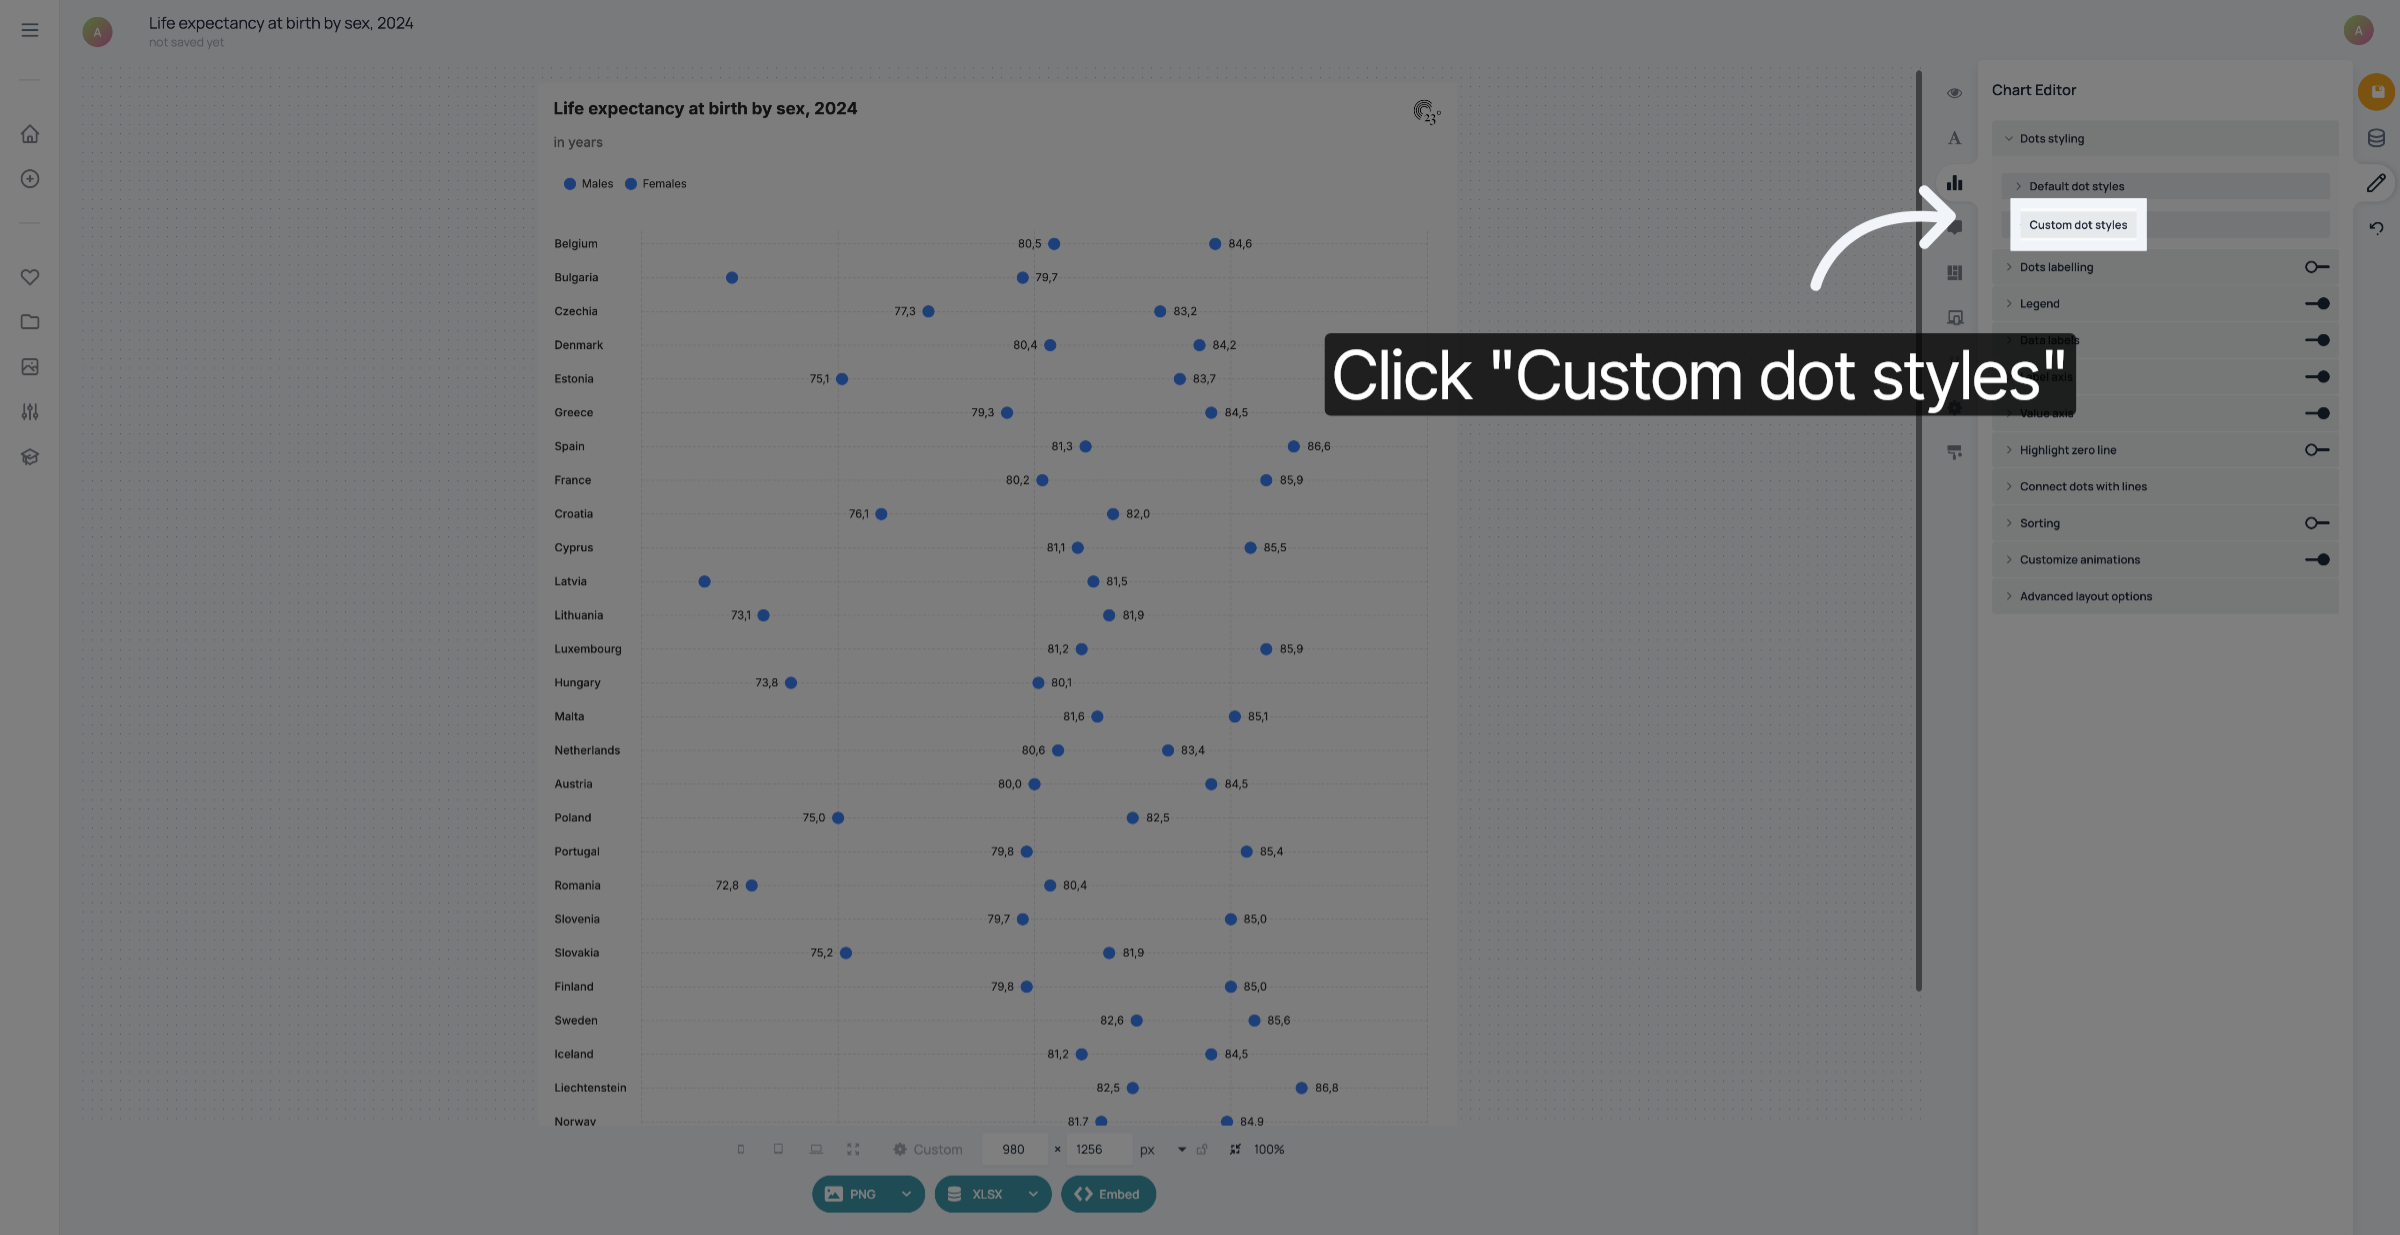
3. Click "Custom dot styles"

Click "Custom dot styles".

Click 'Custom dot styles'
4. Select the column you want to colour by

Unter "Select field", click the column in your dataset that you want to colour by. You can also type it in
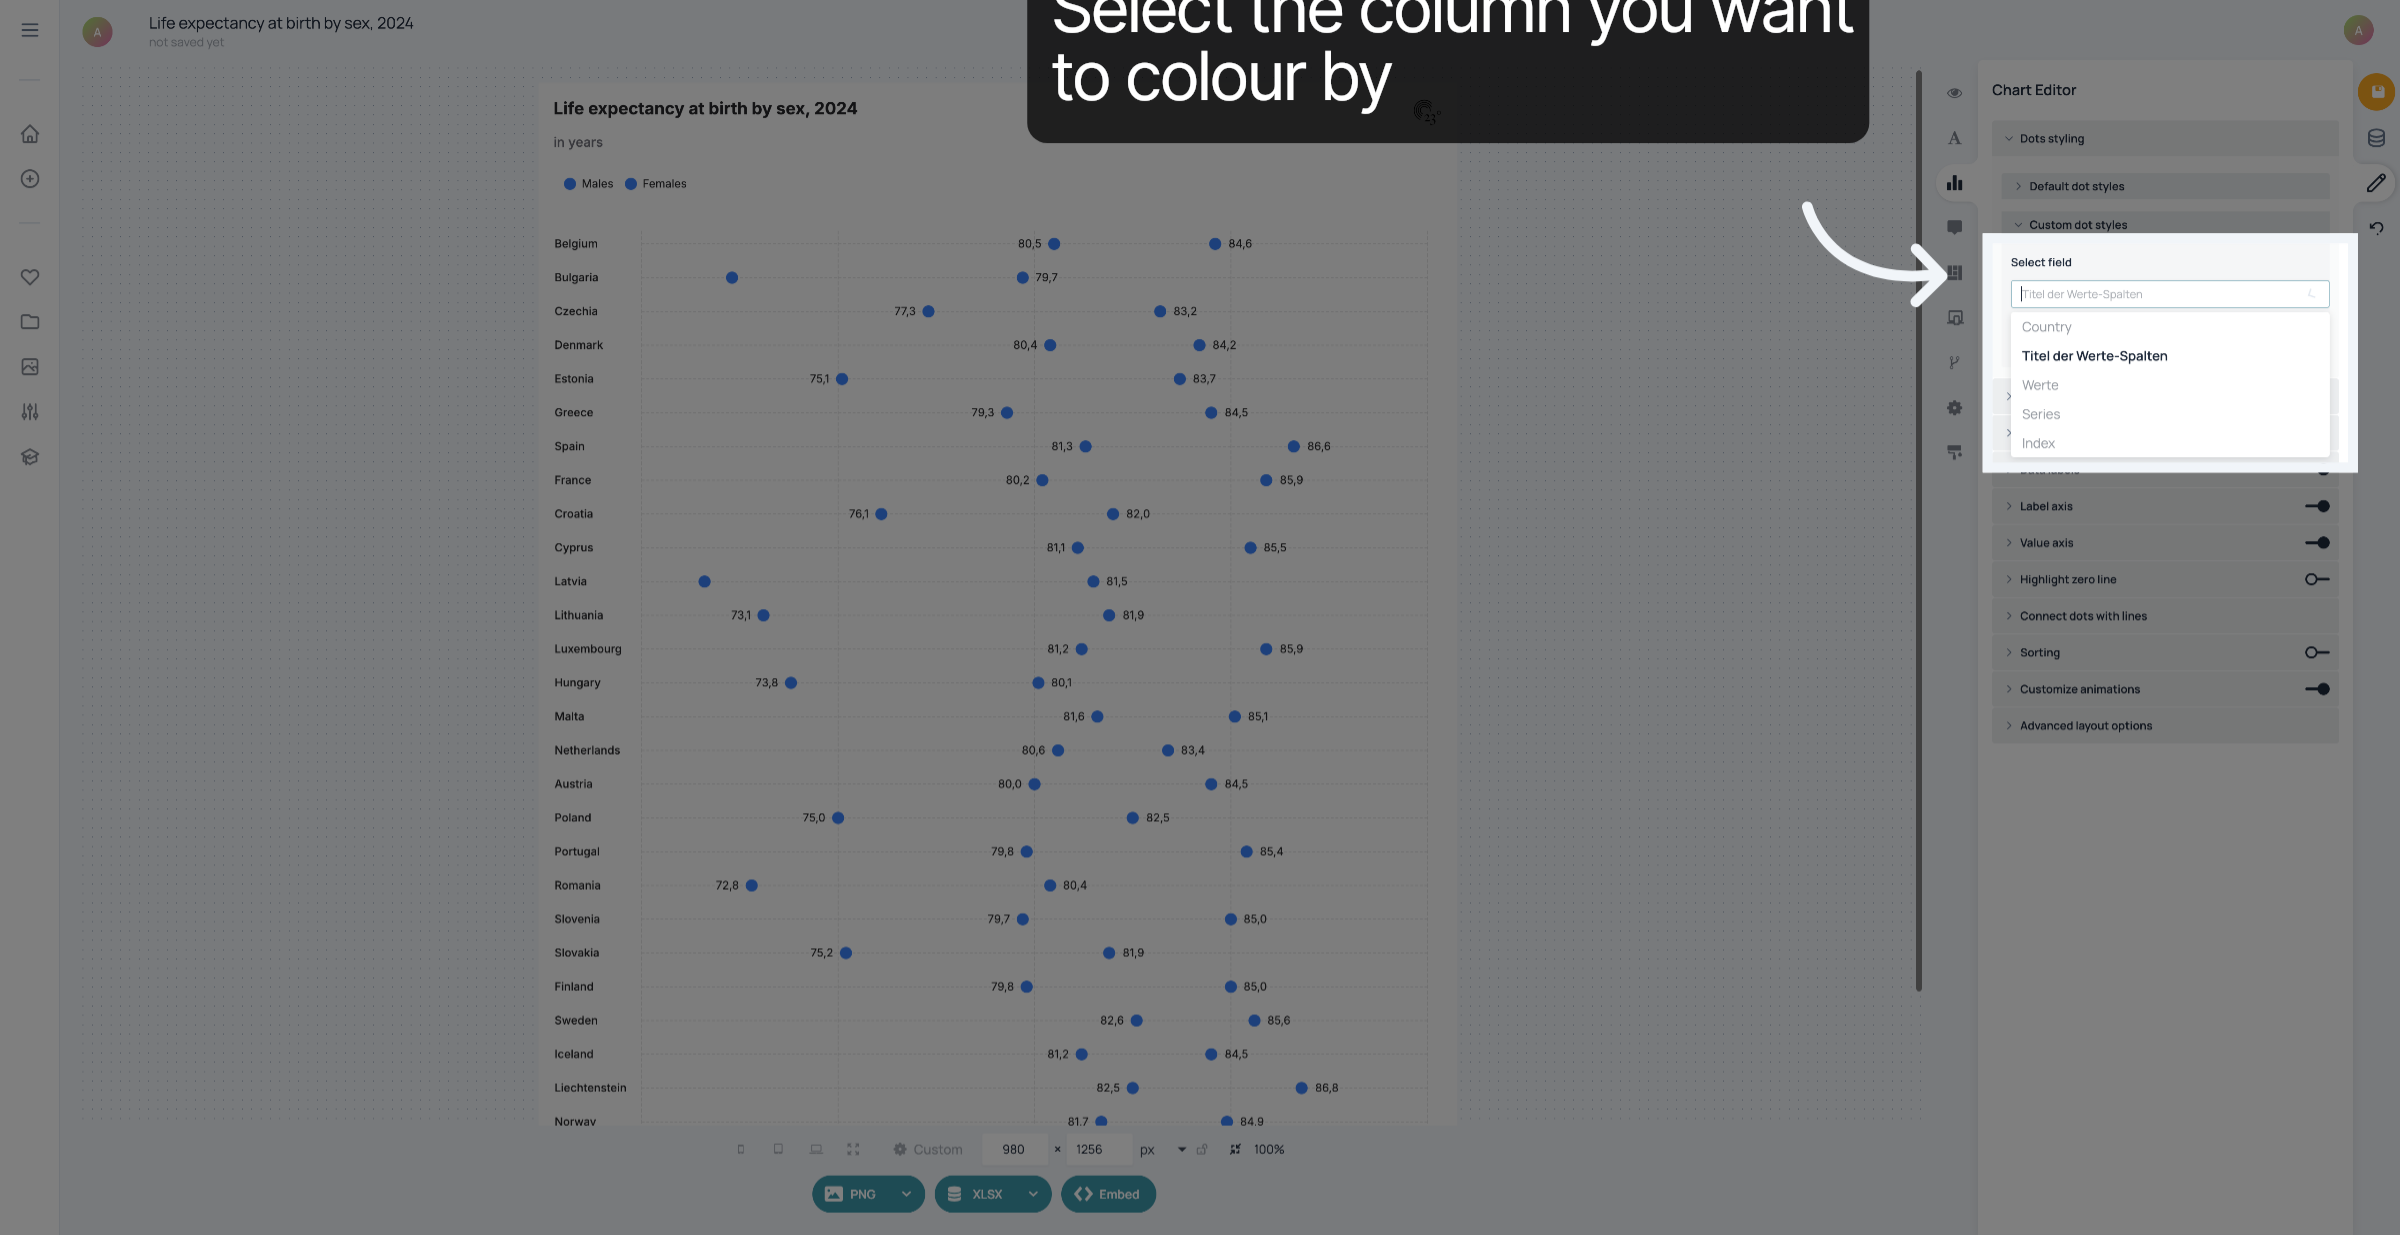
Select the column you want to colour by
5. Choose Value Column Title

Click "Titel der Werte-Spalten" to select the title of the value columns for styling.
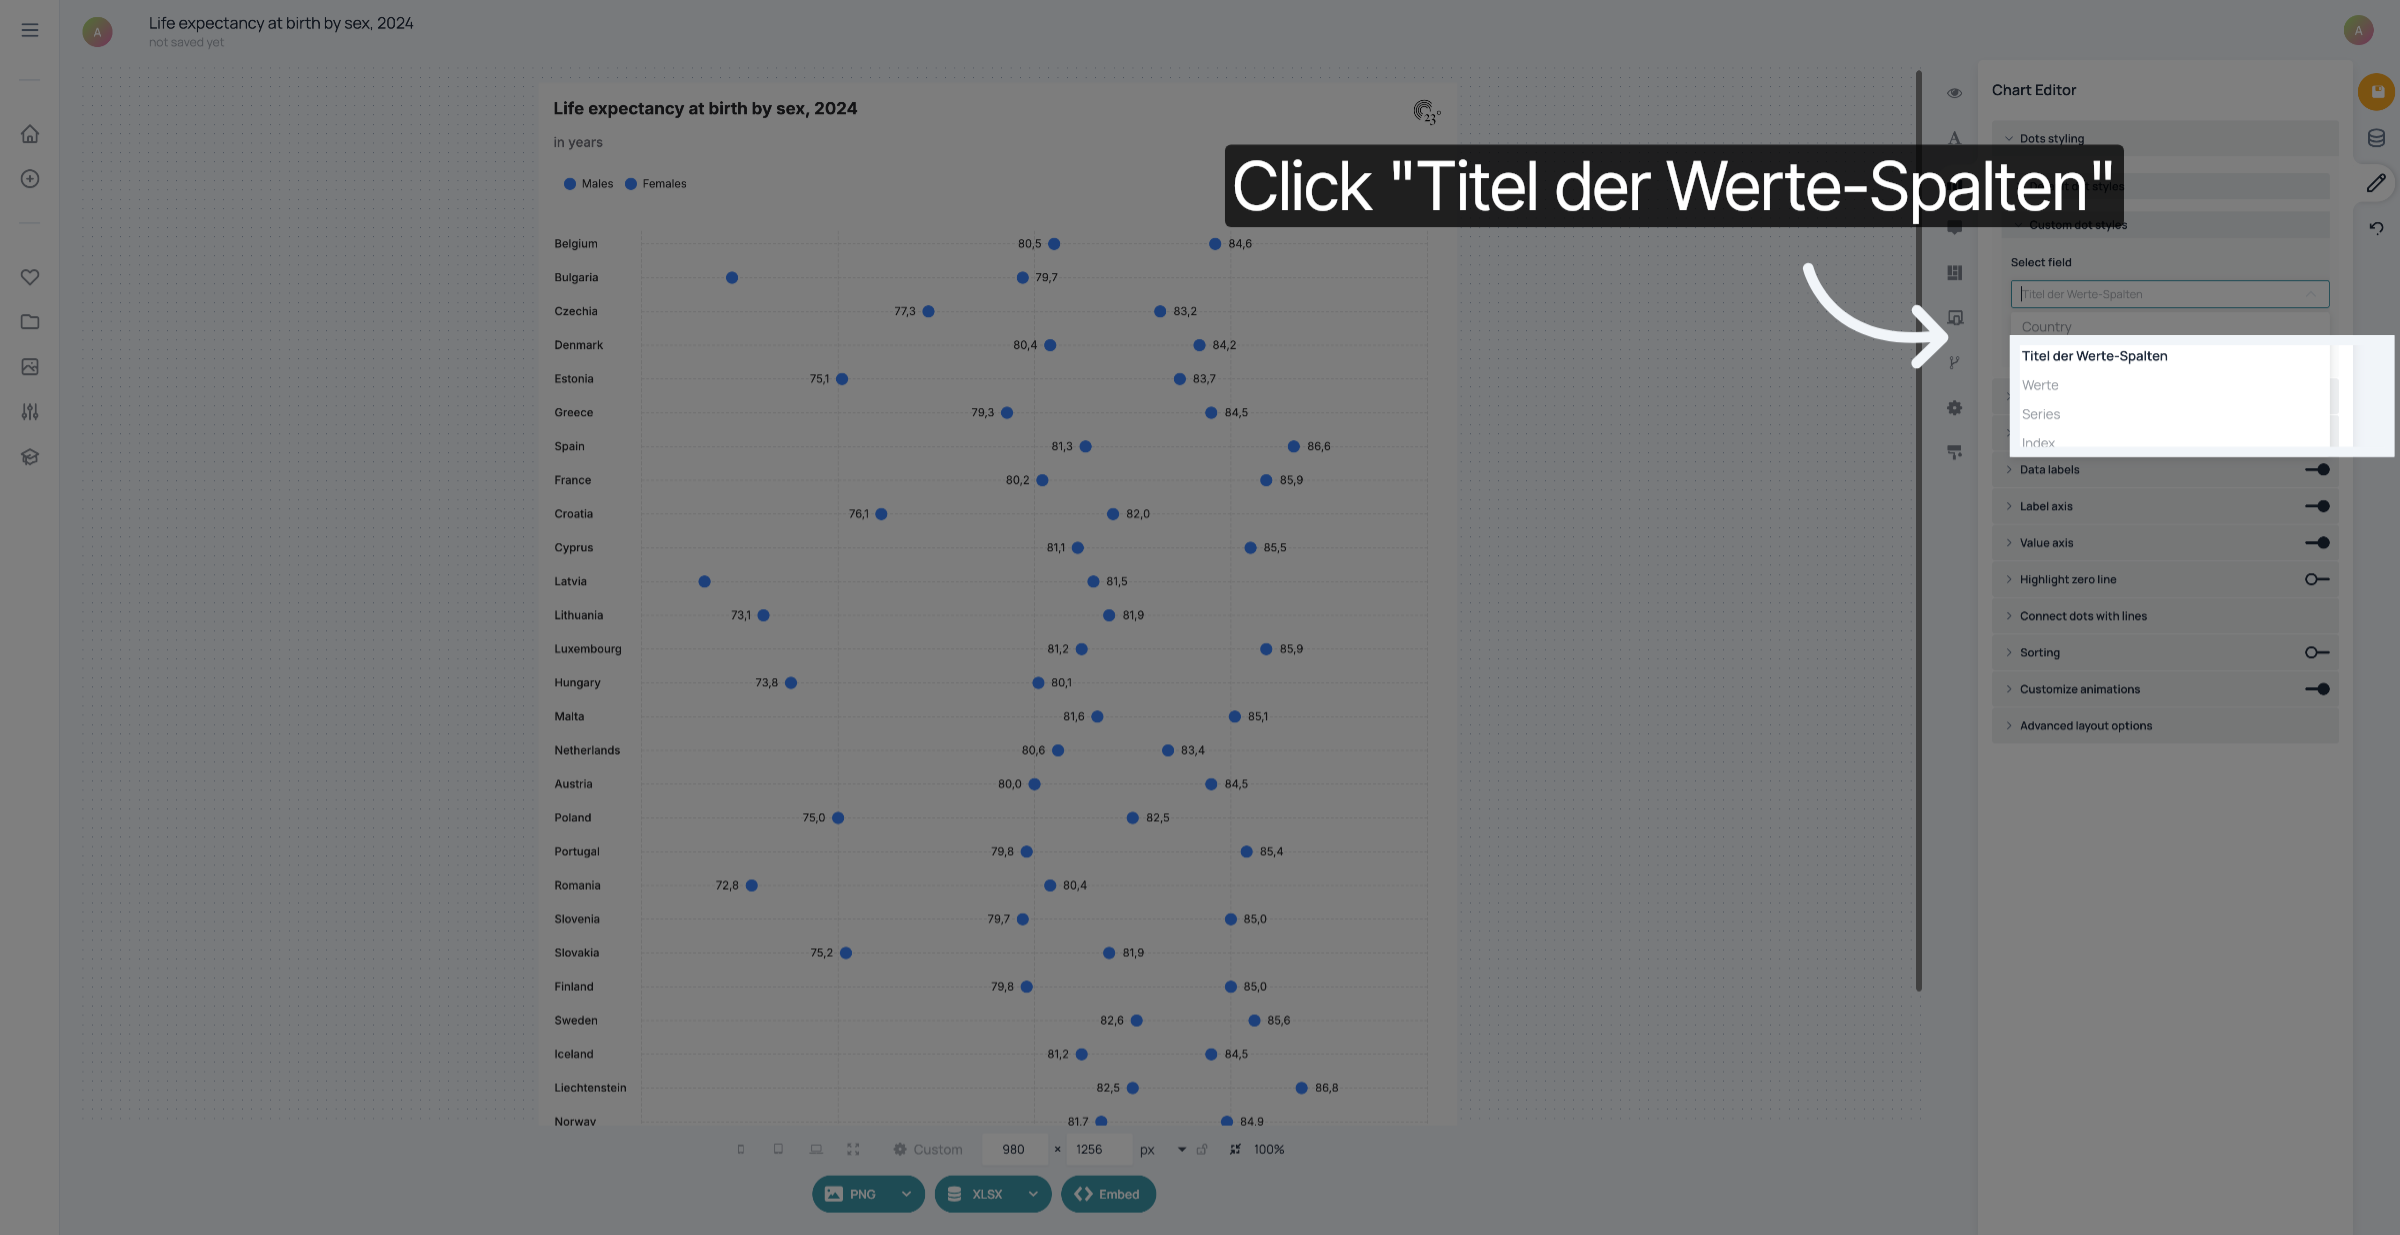
Choose Value Column Title
6. Add the categories you want to colour by

Click the plus sign to add the categories you want to colour by.
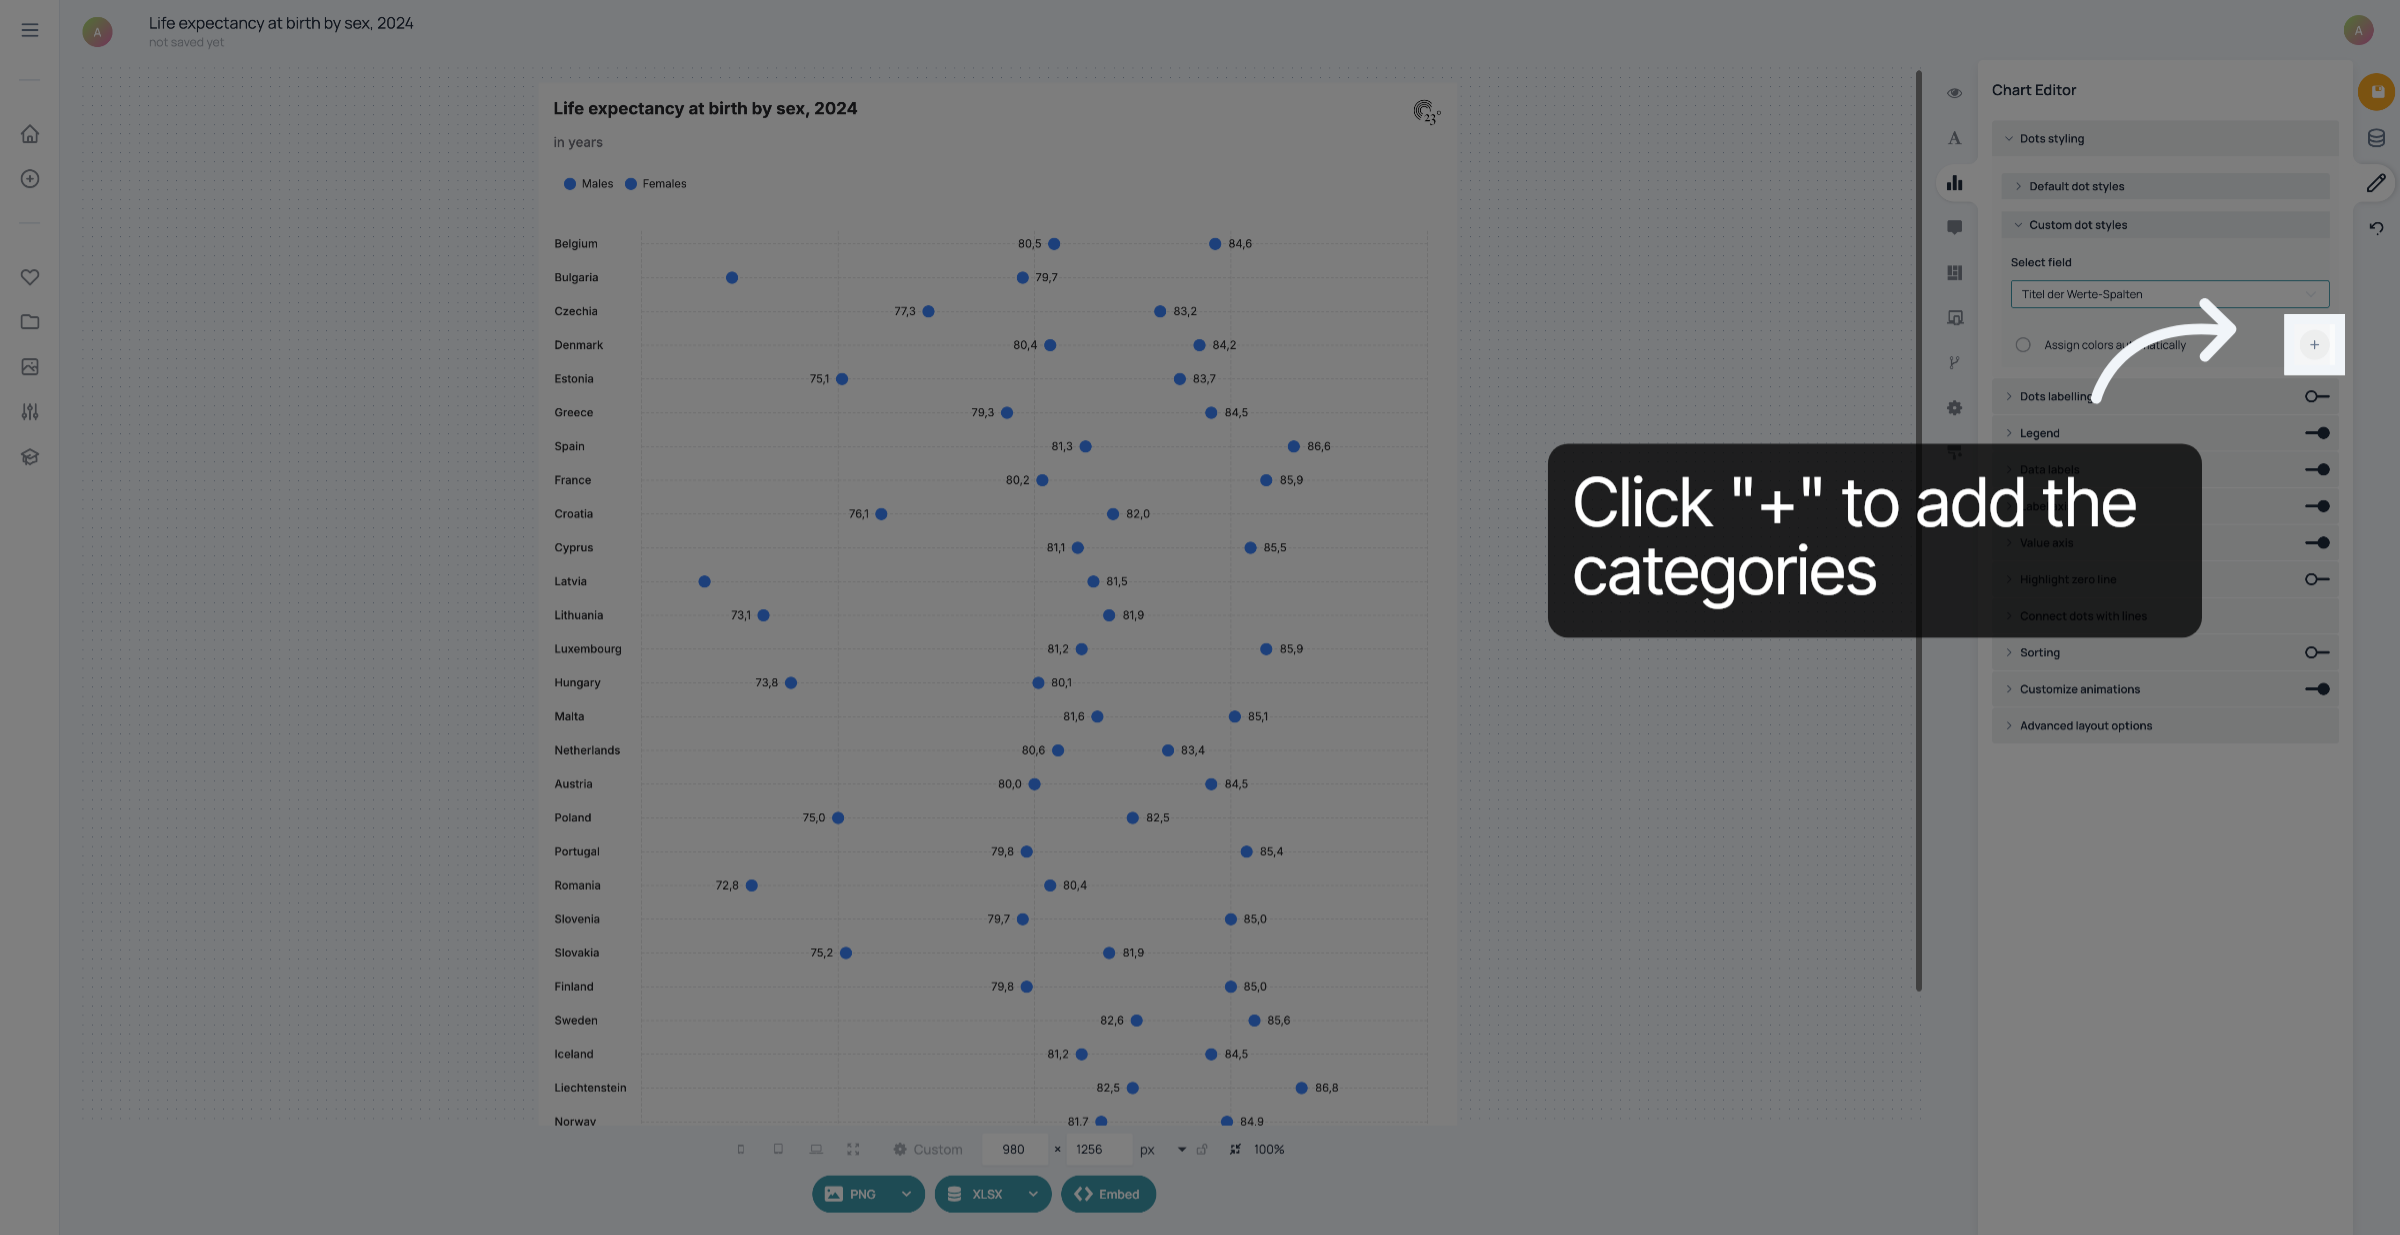
Add the categories you want to colour by
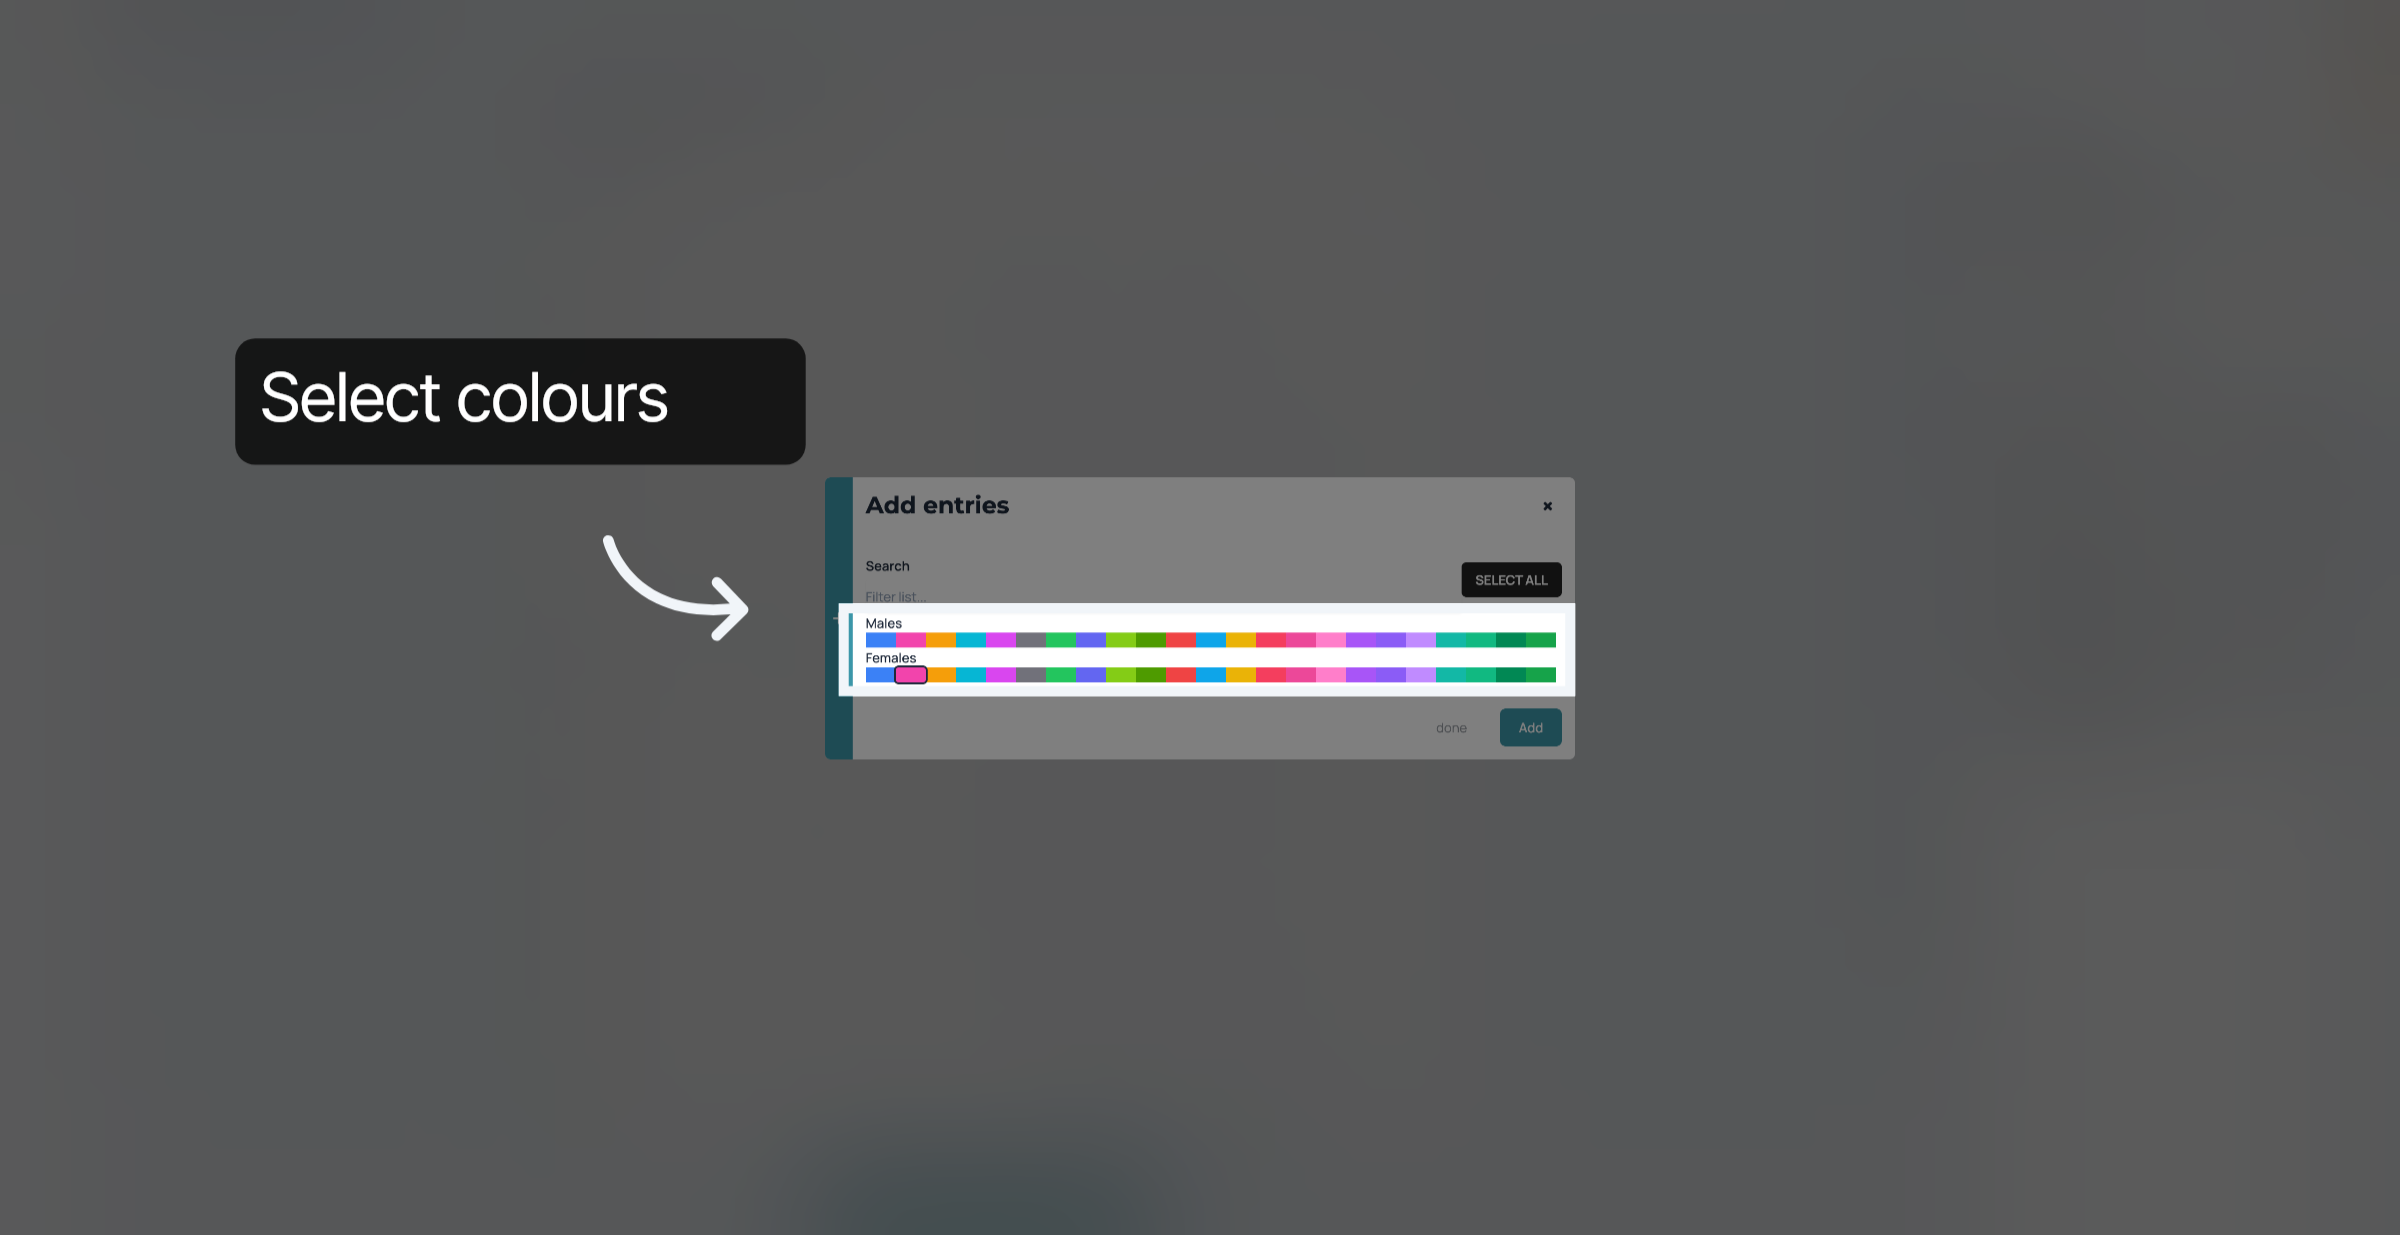
7. Select colours

Select a colour for each category.

Select colours
Select colours
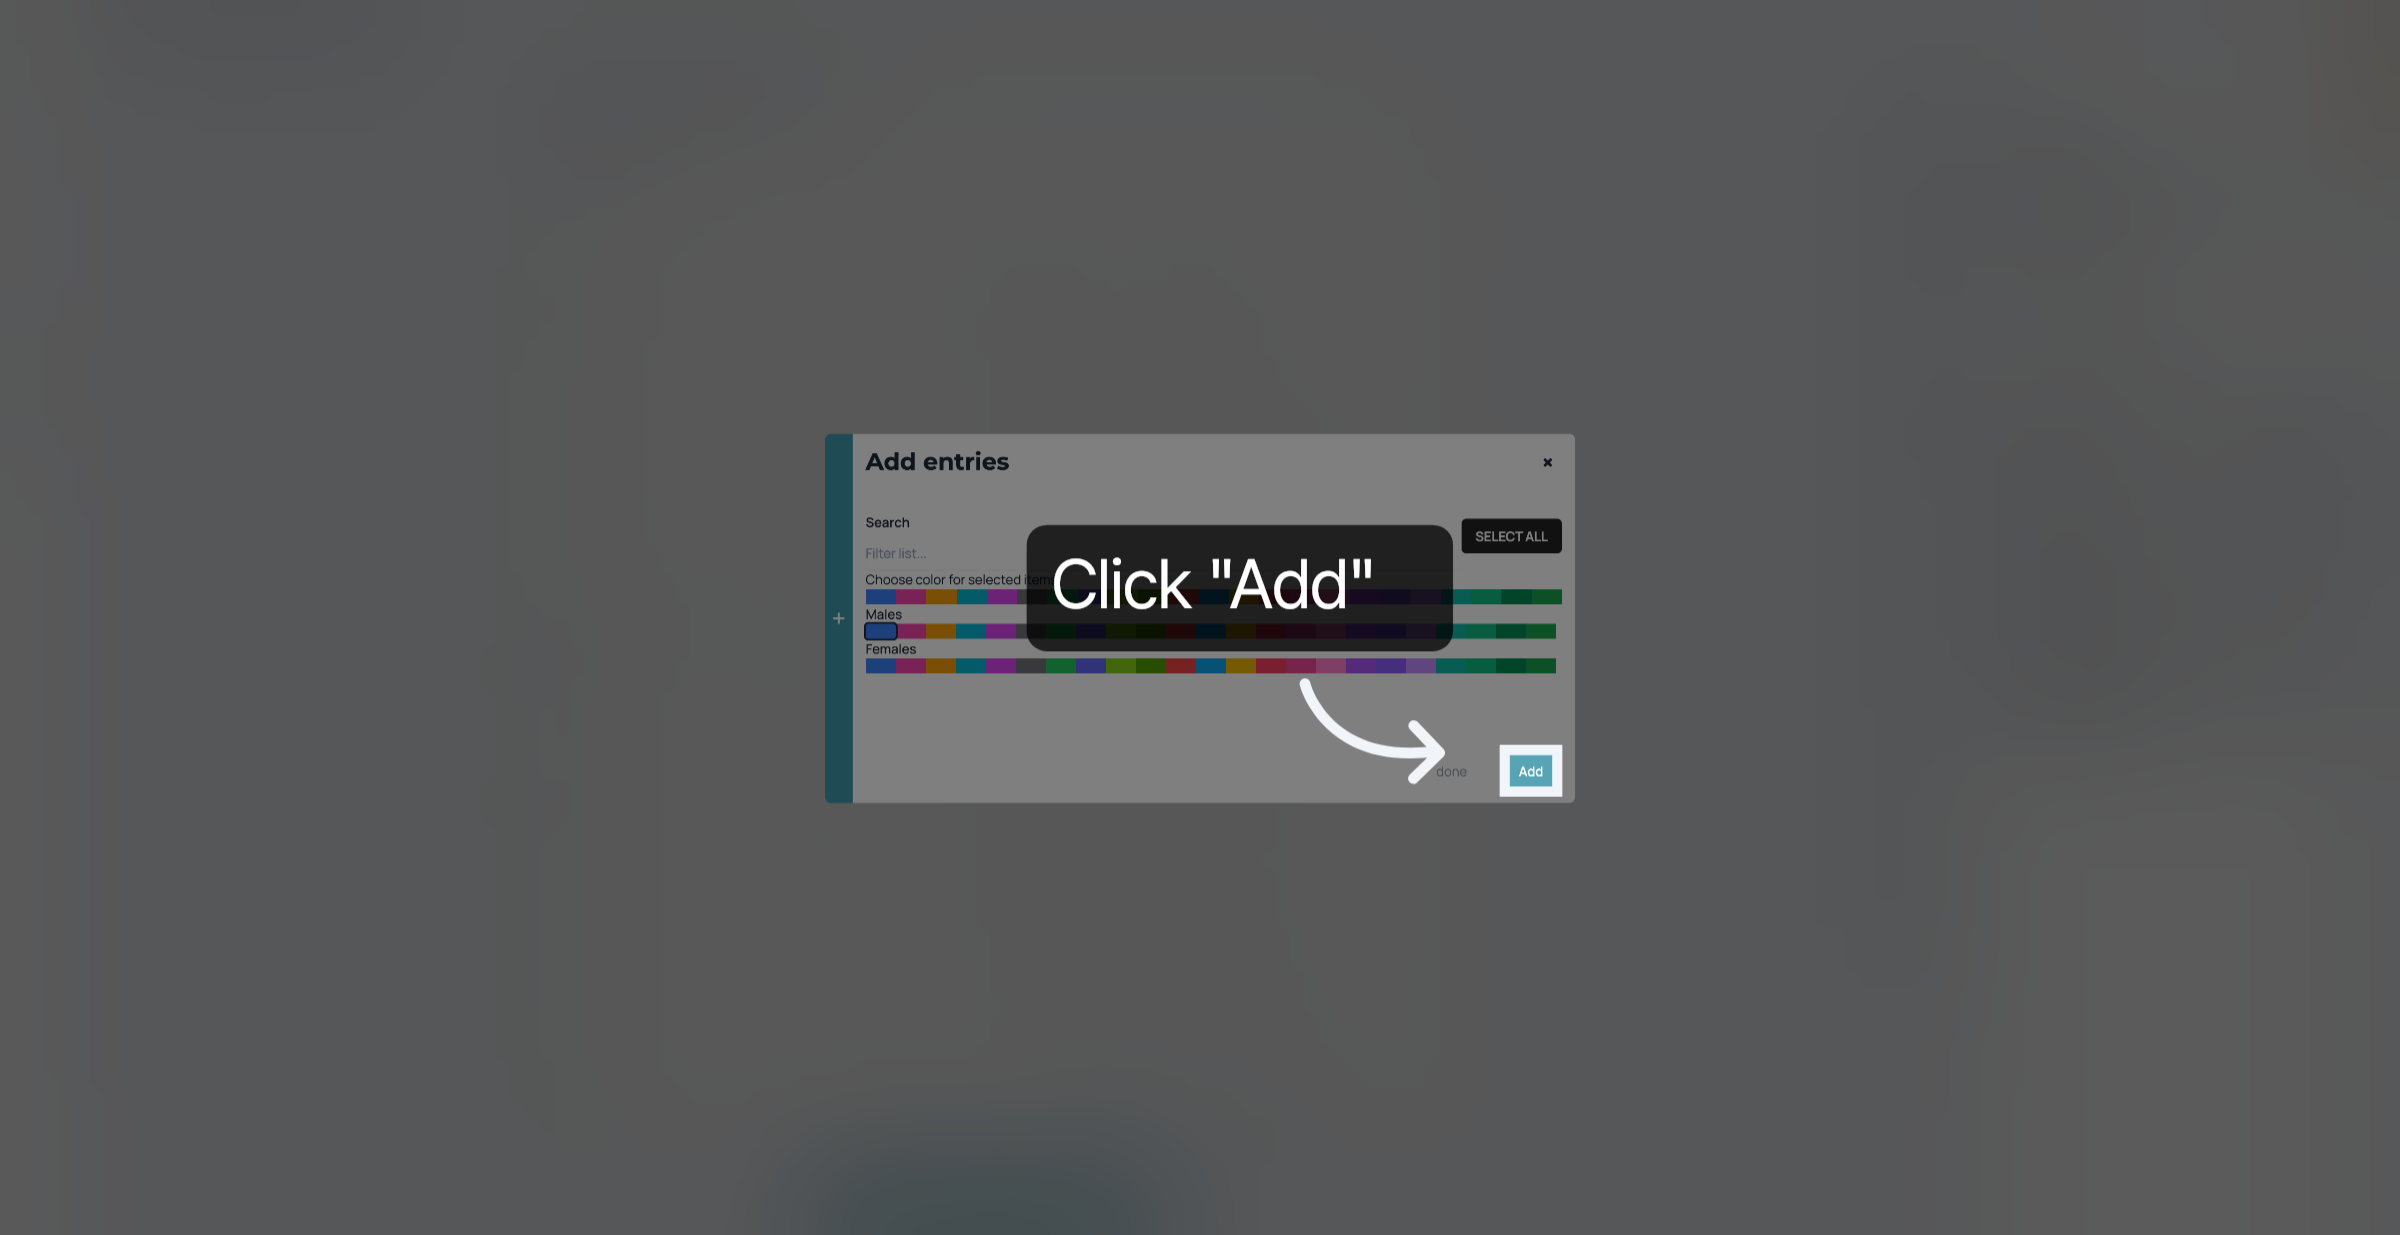
8. Click "Add"

Click "Add" to add the entries.

Click 'Add'
Click 'Add'
9. Change symbol

To change the dot into a different symbol, click the pen.
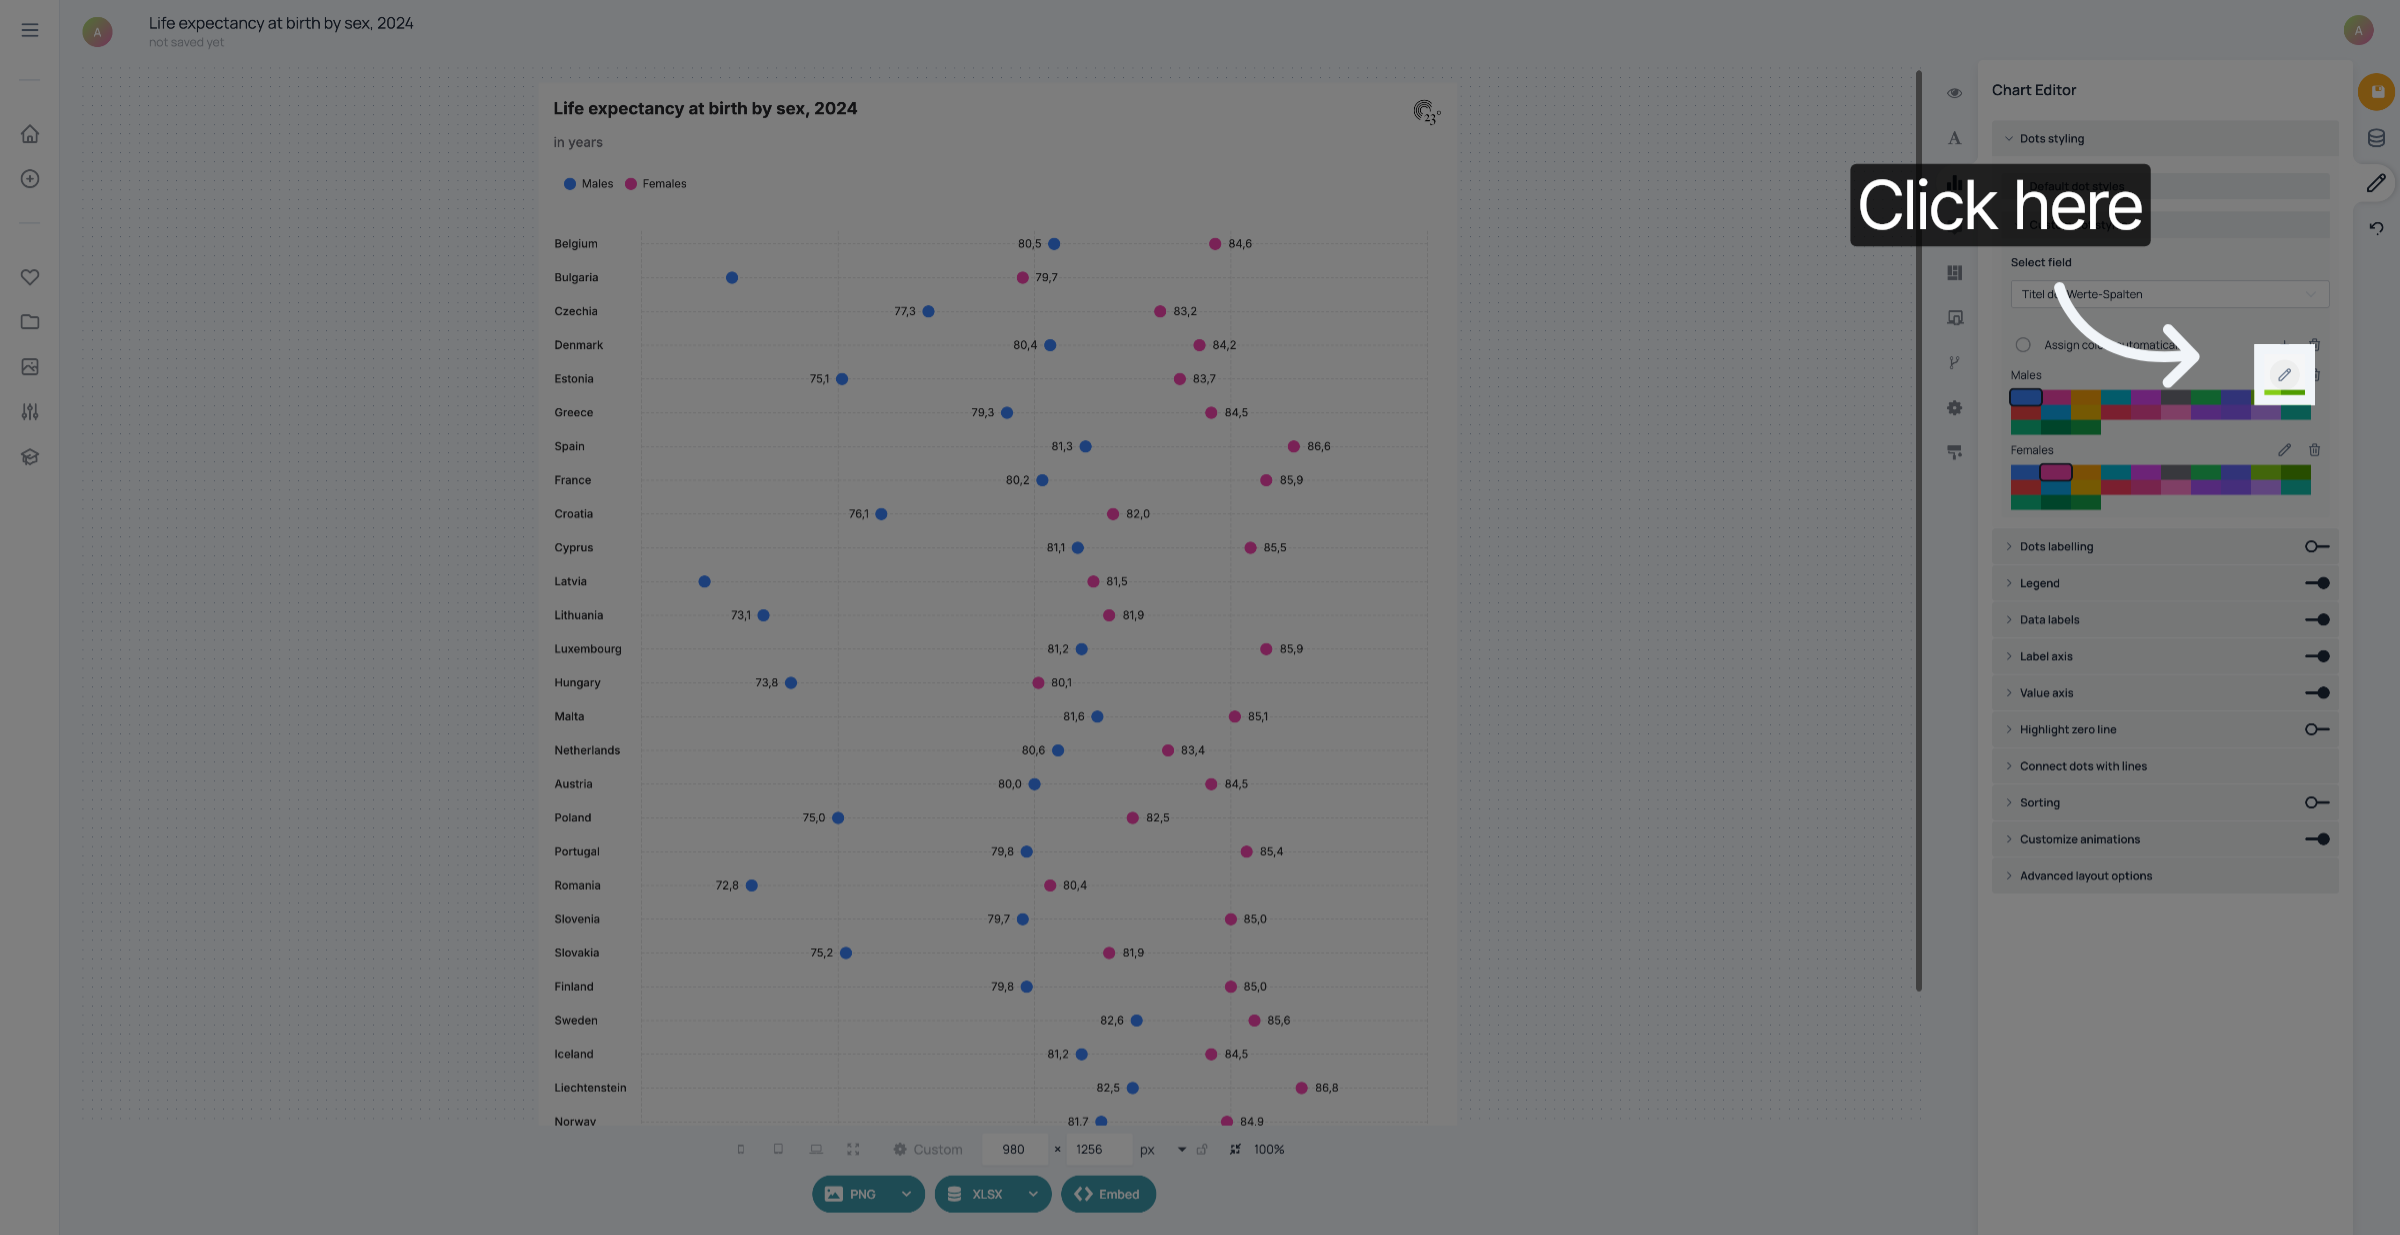
Change symbol
Change symbol
10. Change symbol

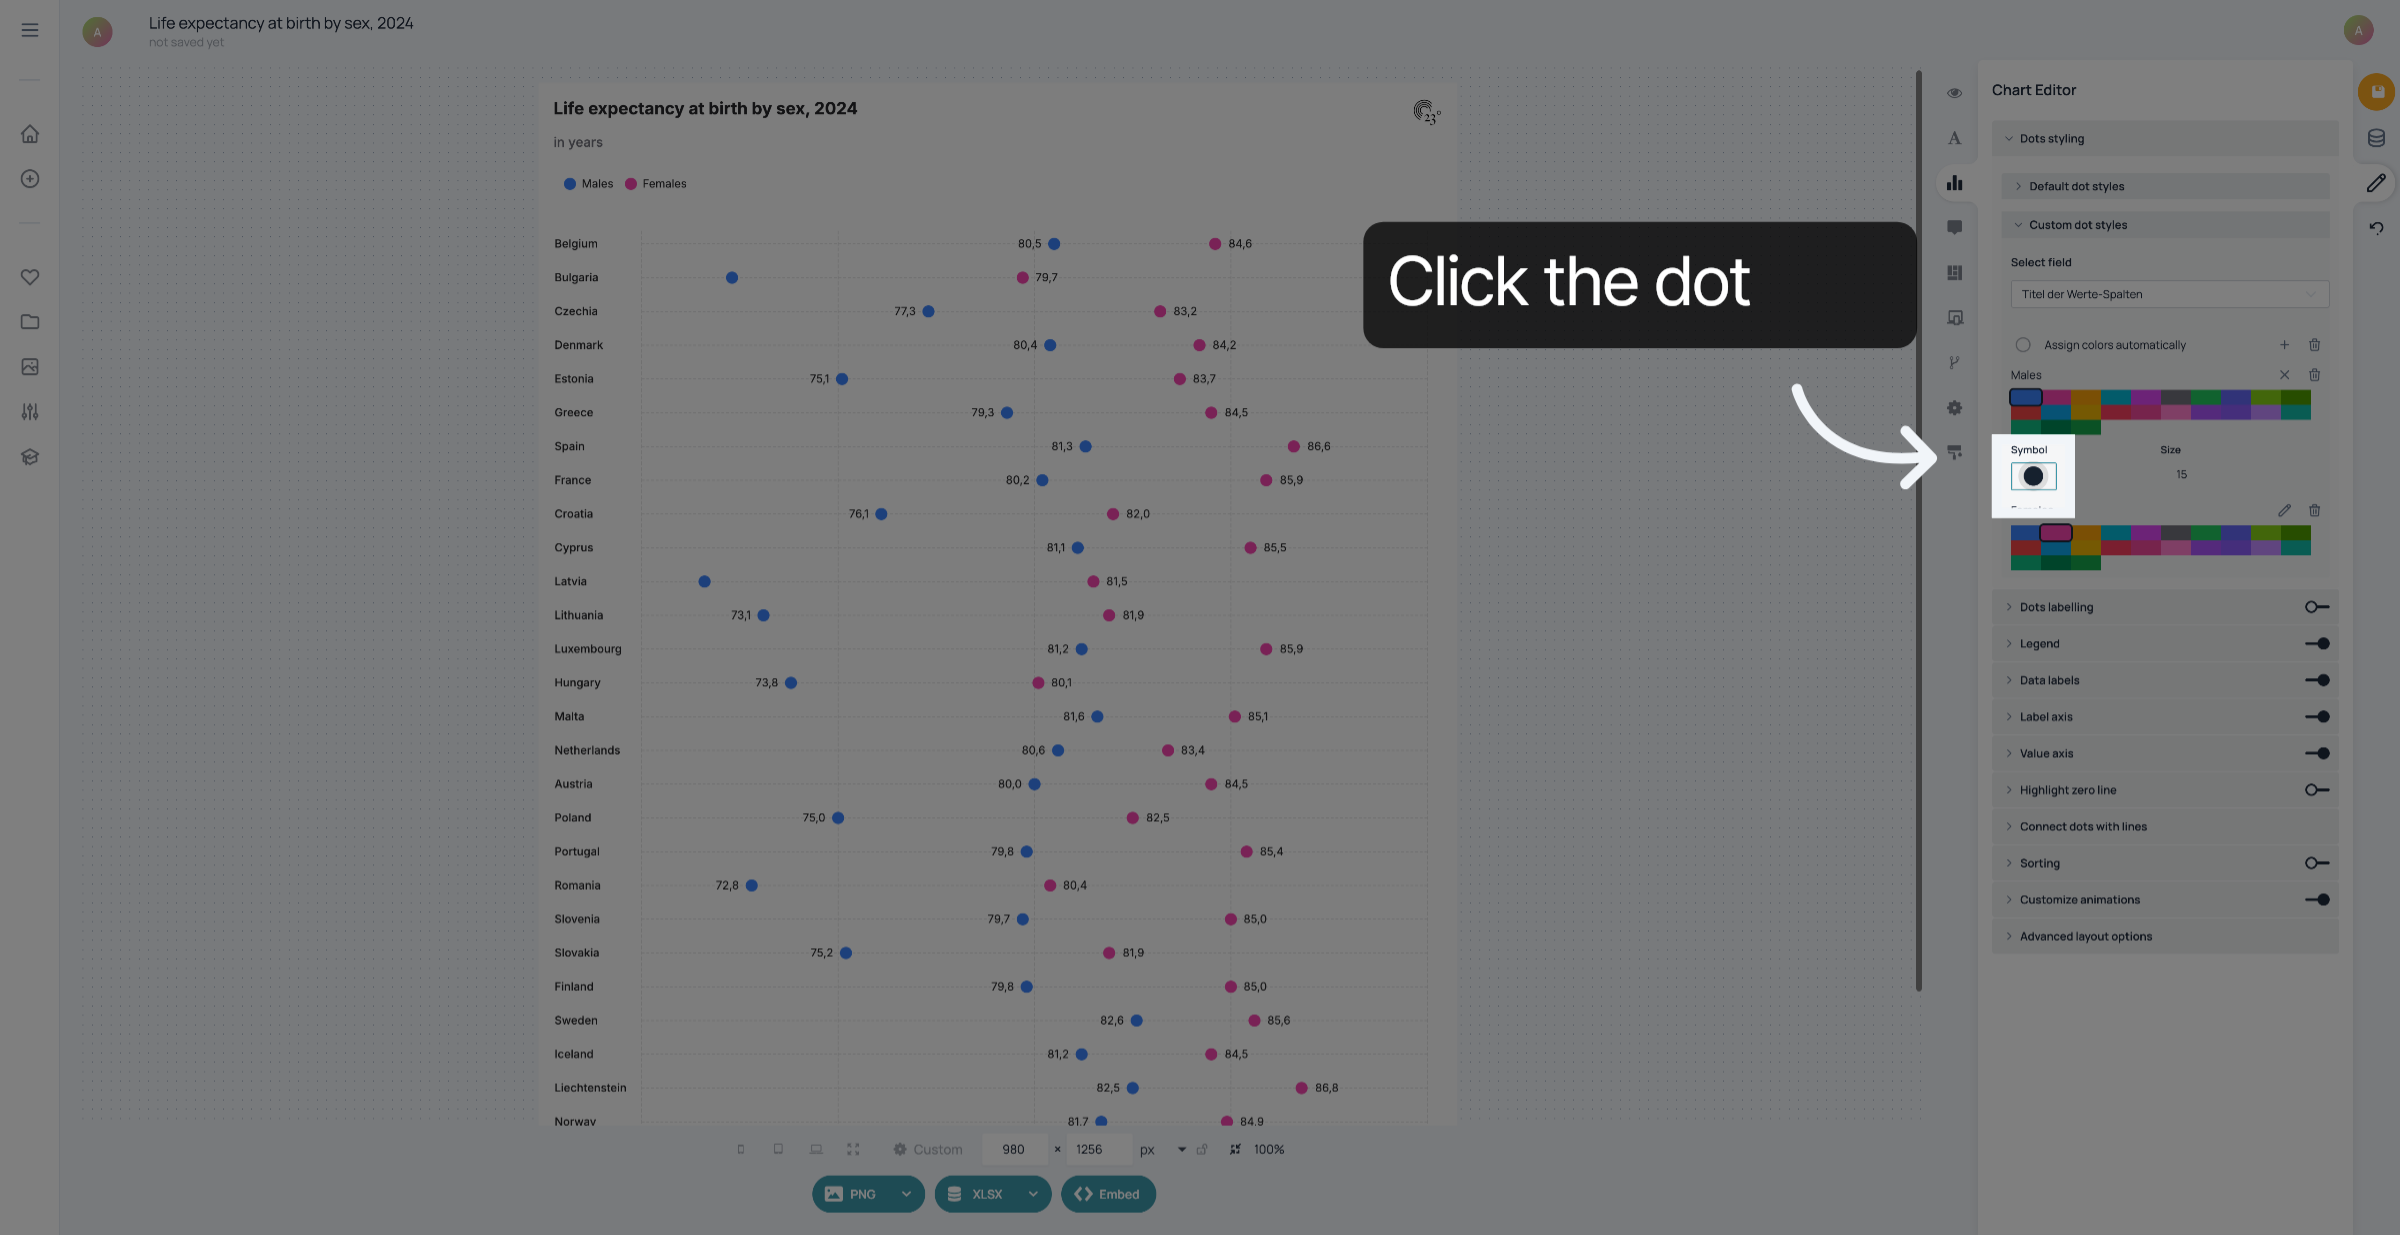
Click the dot to change the symbol.

Change symbol
Change symbol
11. Select symbol

Select the symbol that matches your category.
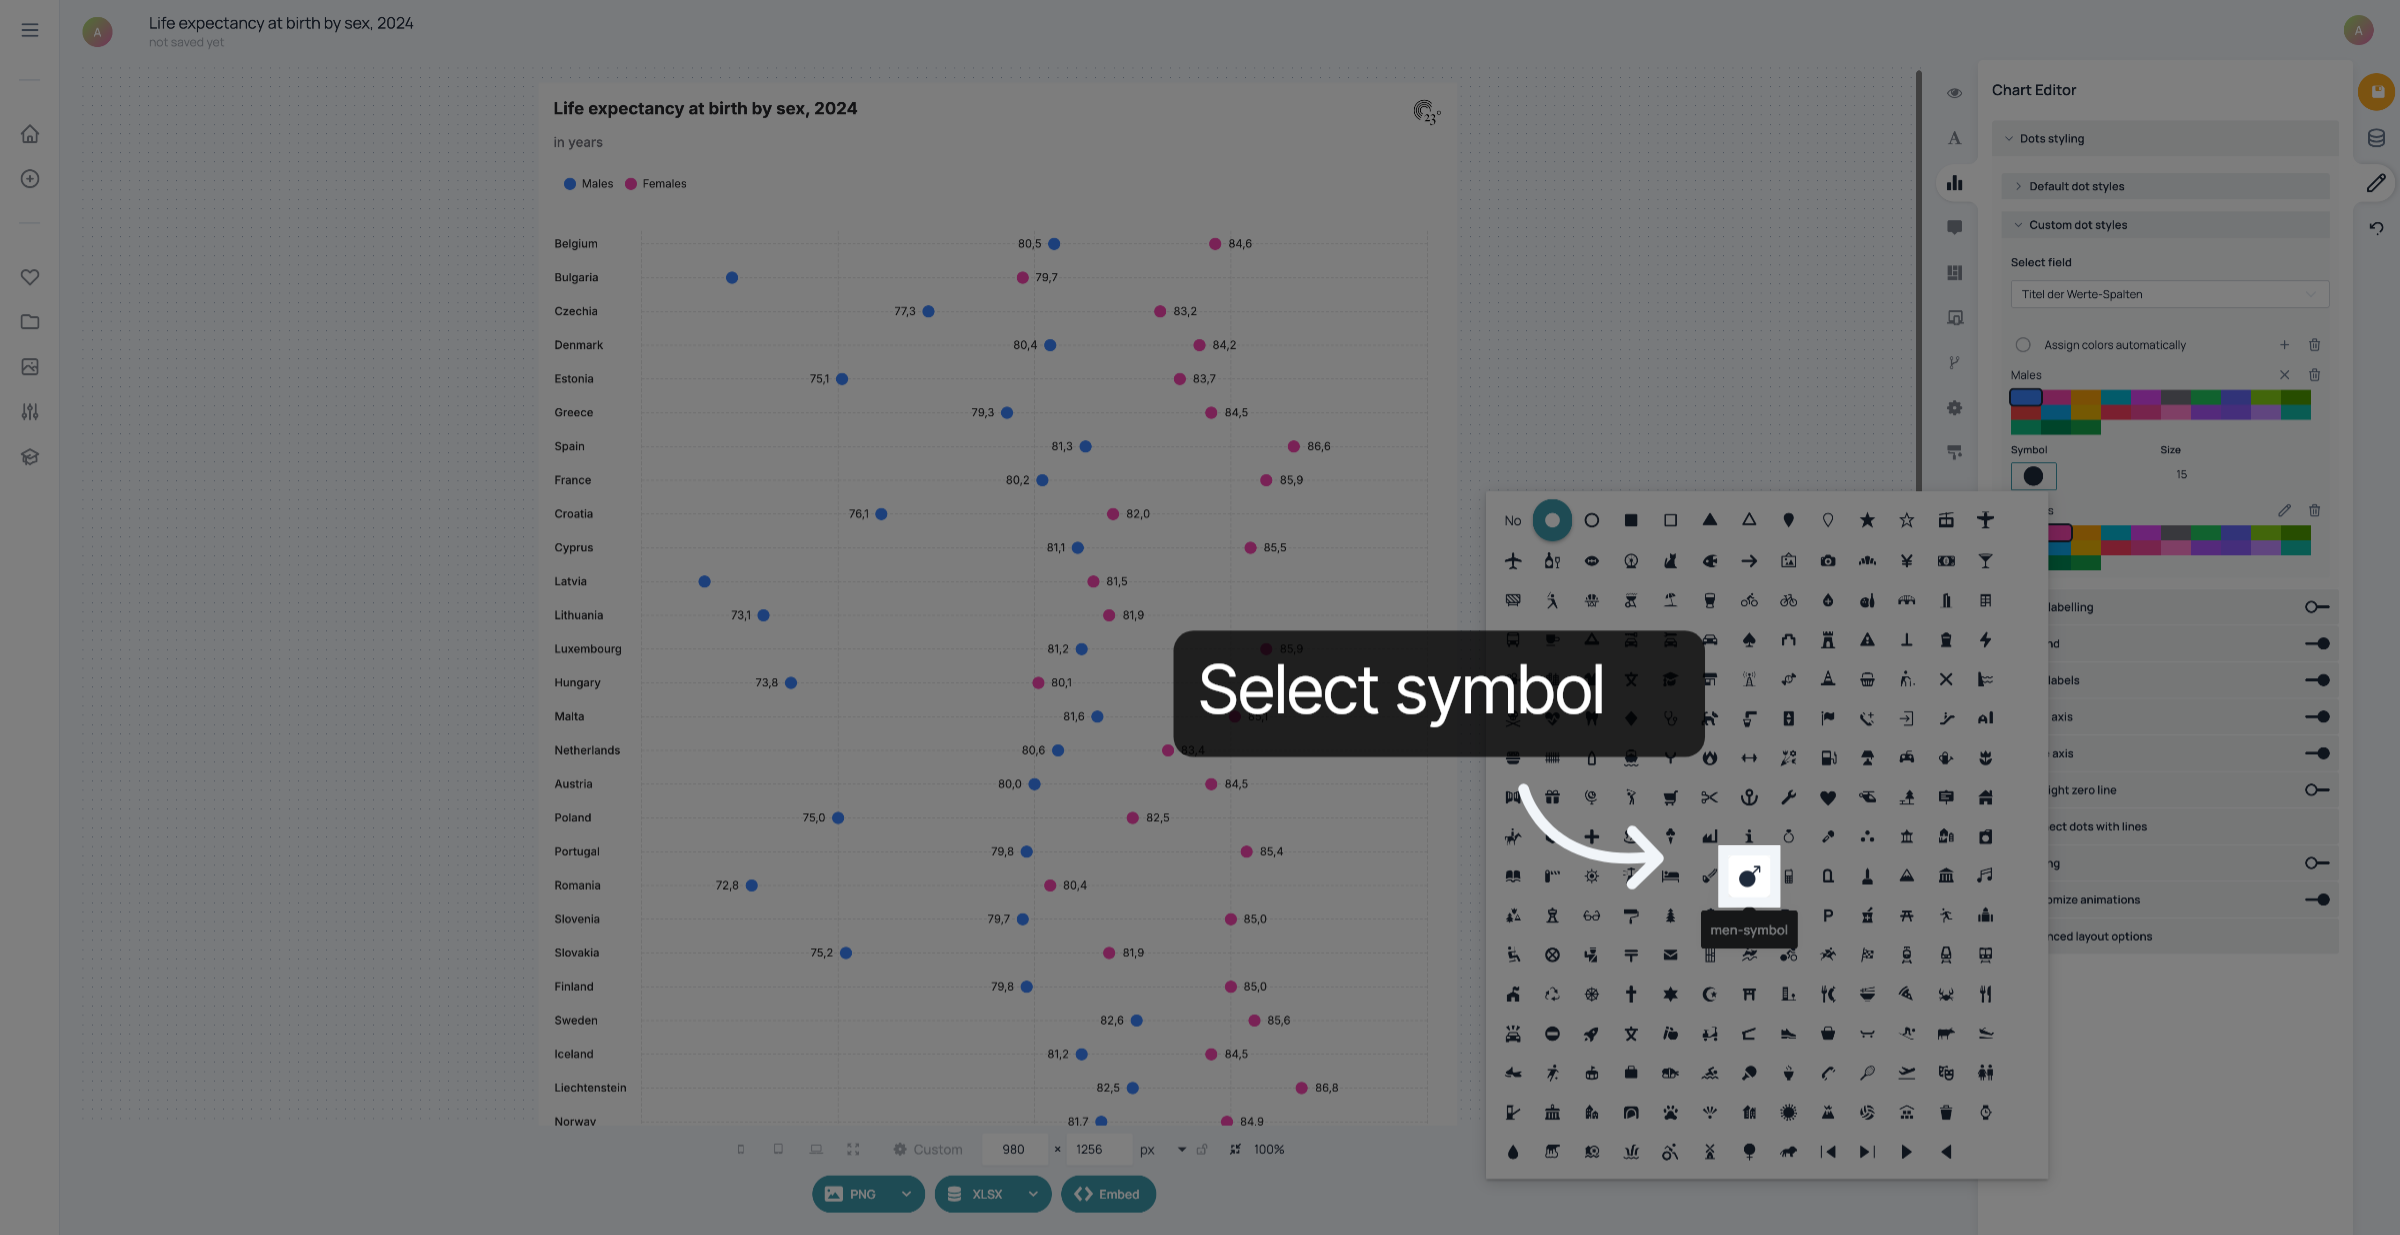
Select symbol
Select symbol
12. Continue Style Customization

Click the indicated area to proceed with dot style adjustments.
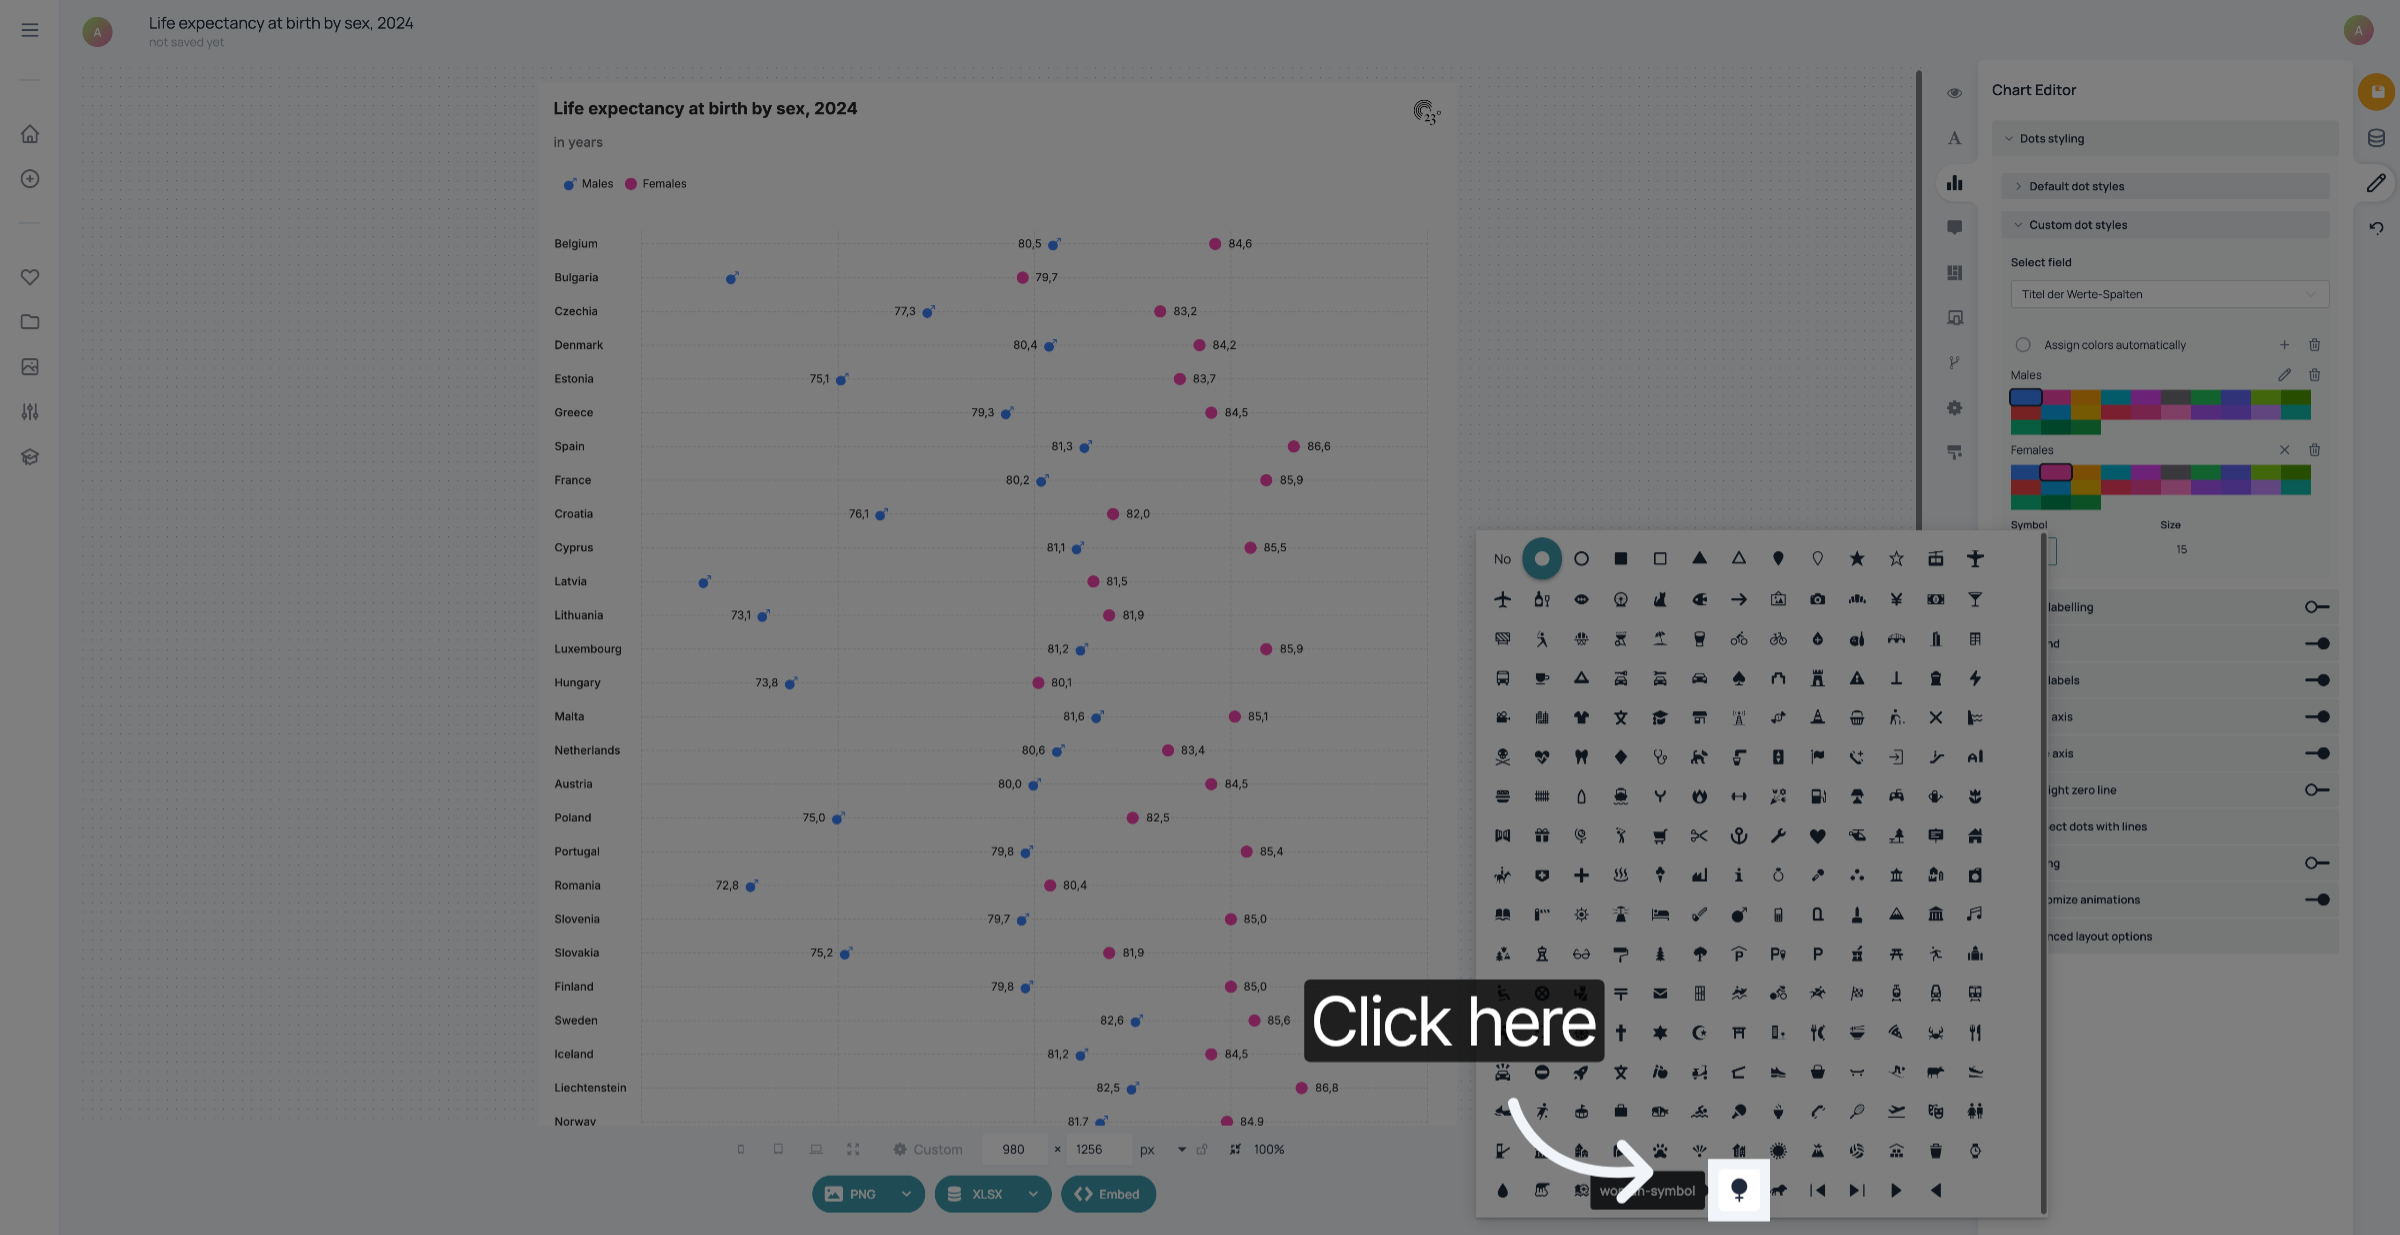
Continue Style Customization
13. Change size

Next to that, you can change the size of the symbol.
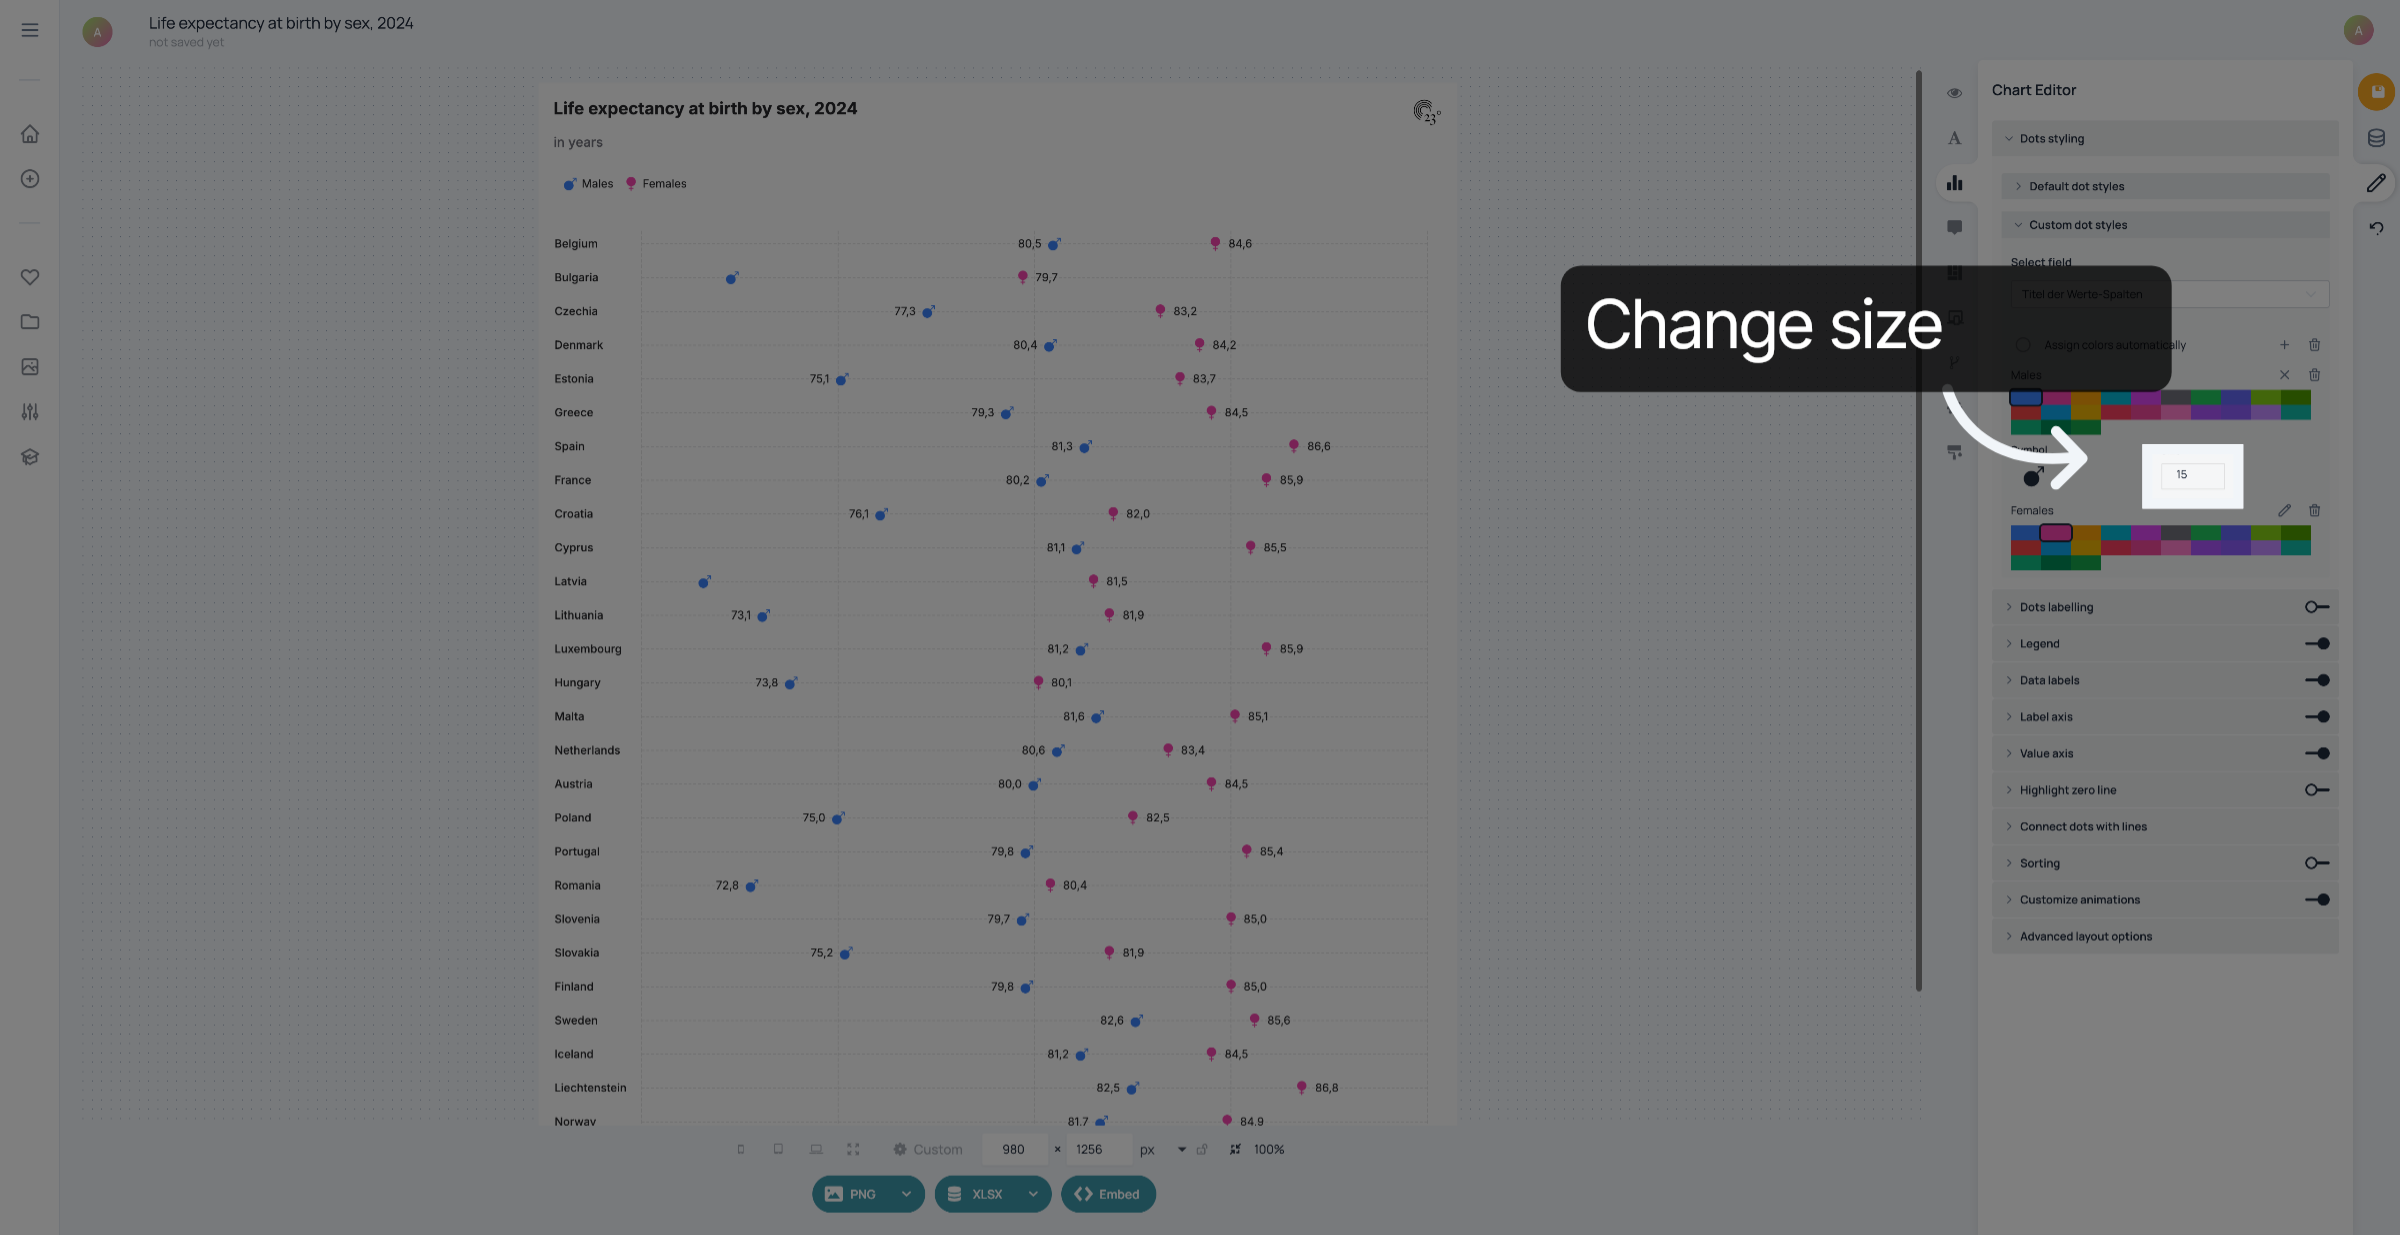
Change size
Change size
14. Save your changes

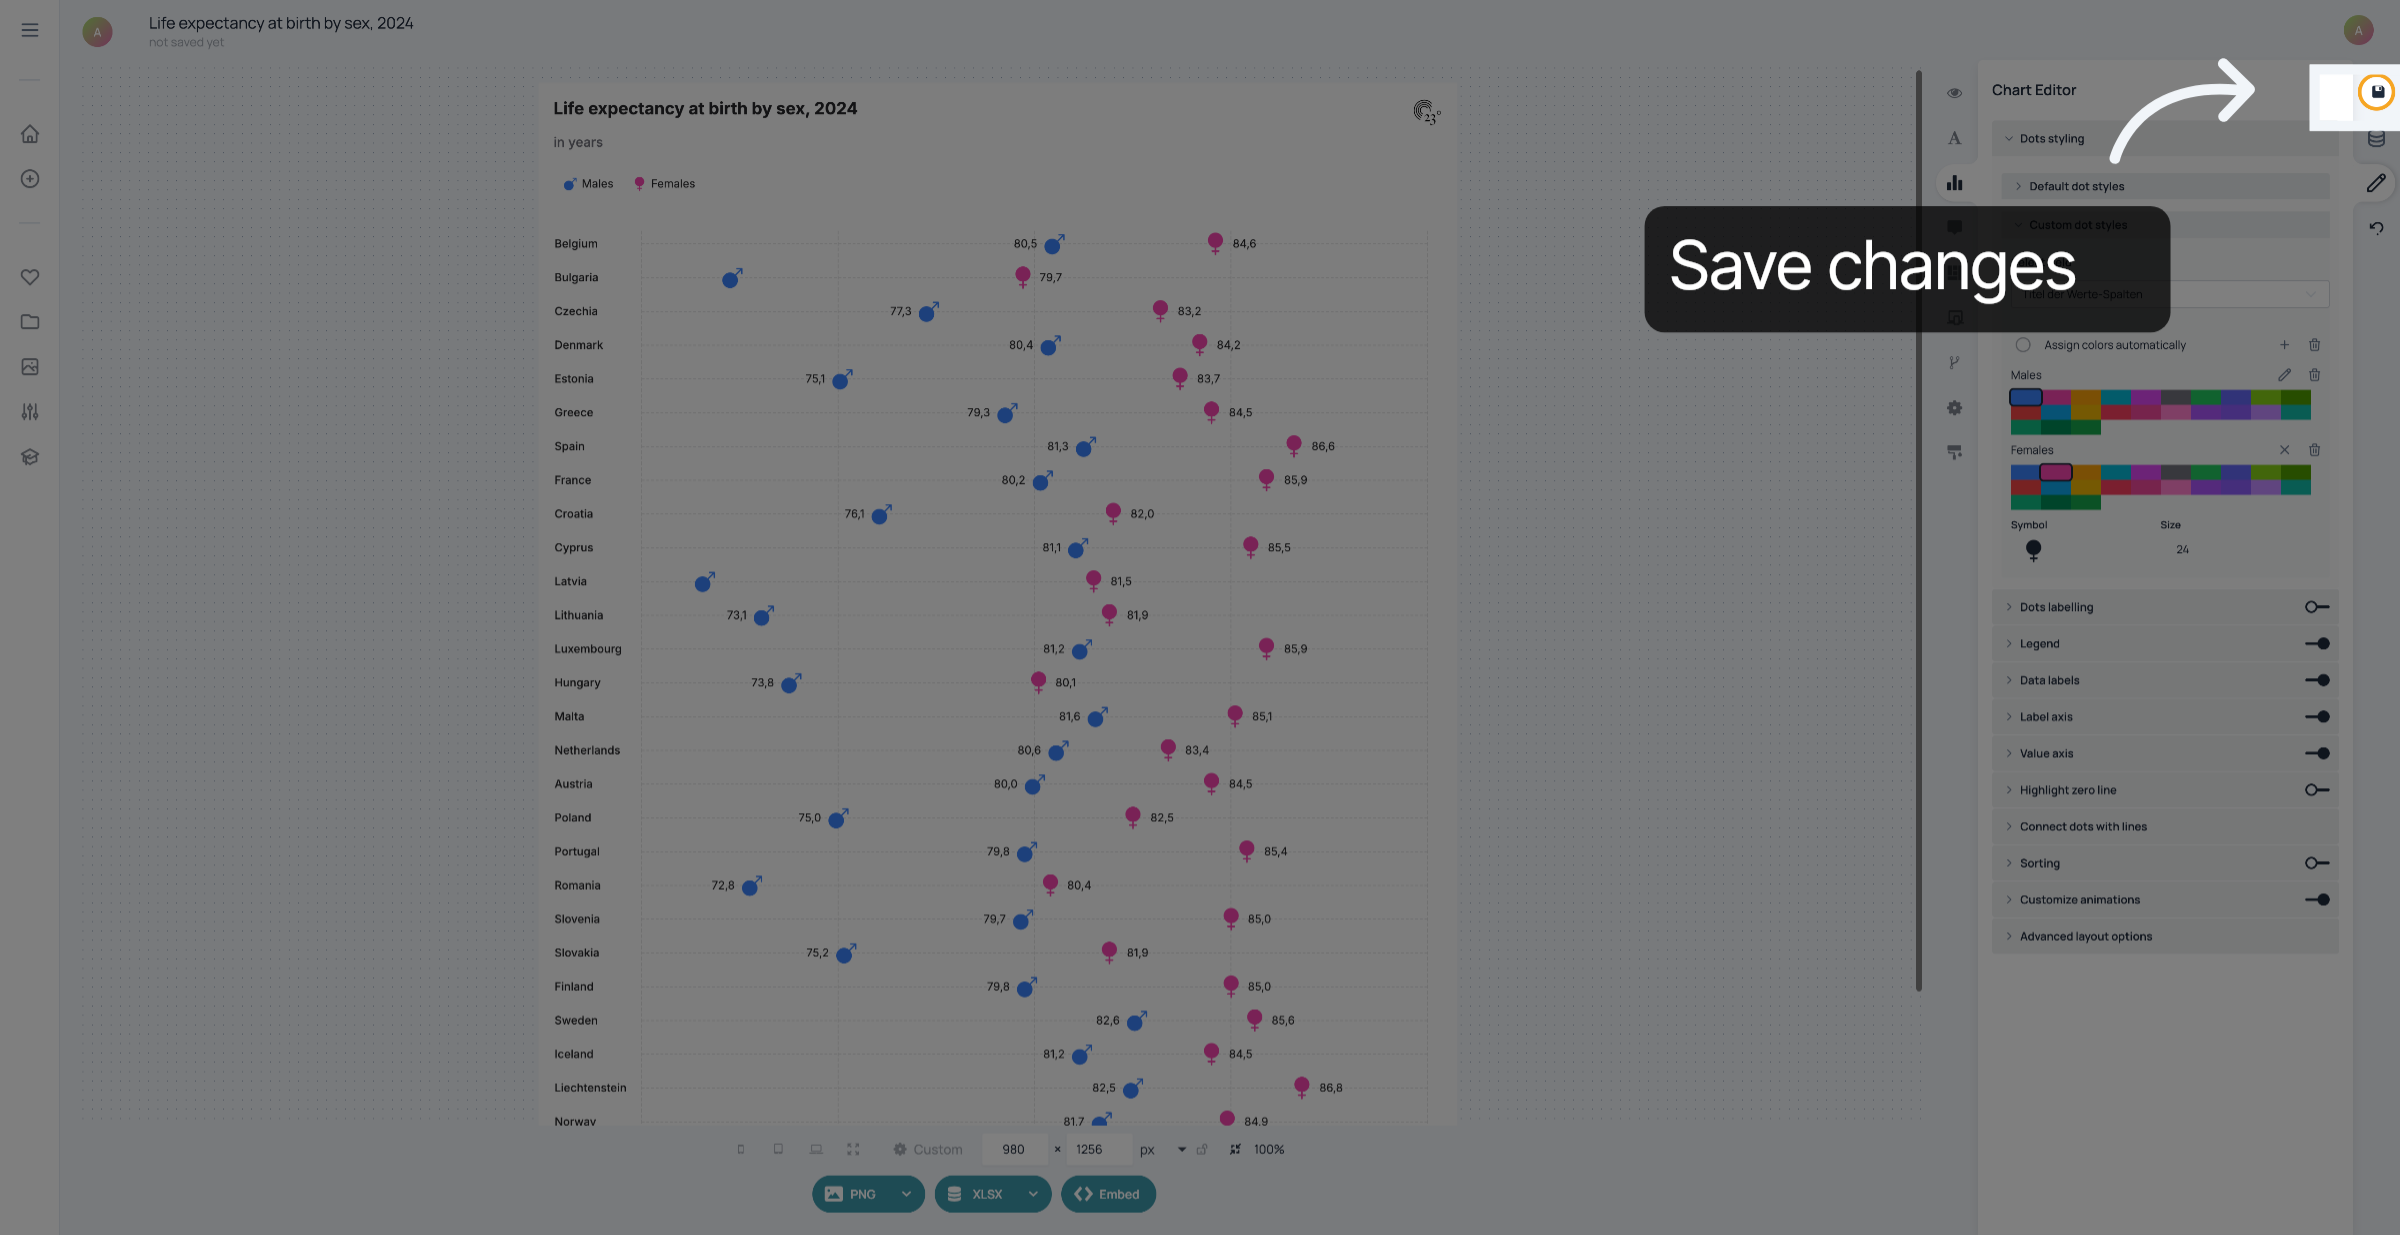
Save your changes.

Save your changes
Save your changes

You have successfully customized the style of the dots in your dotplot.