Filters: Dropdown
This tutorial demonstrates how to configure dropdown filters for charts in 23degrees.
You will learn to customize filter options to refine your chart data effectively.
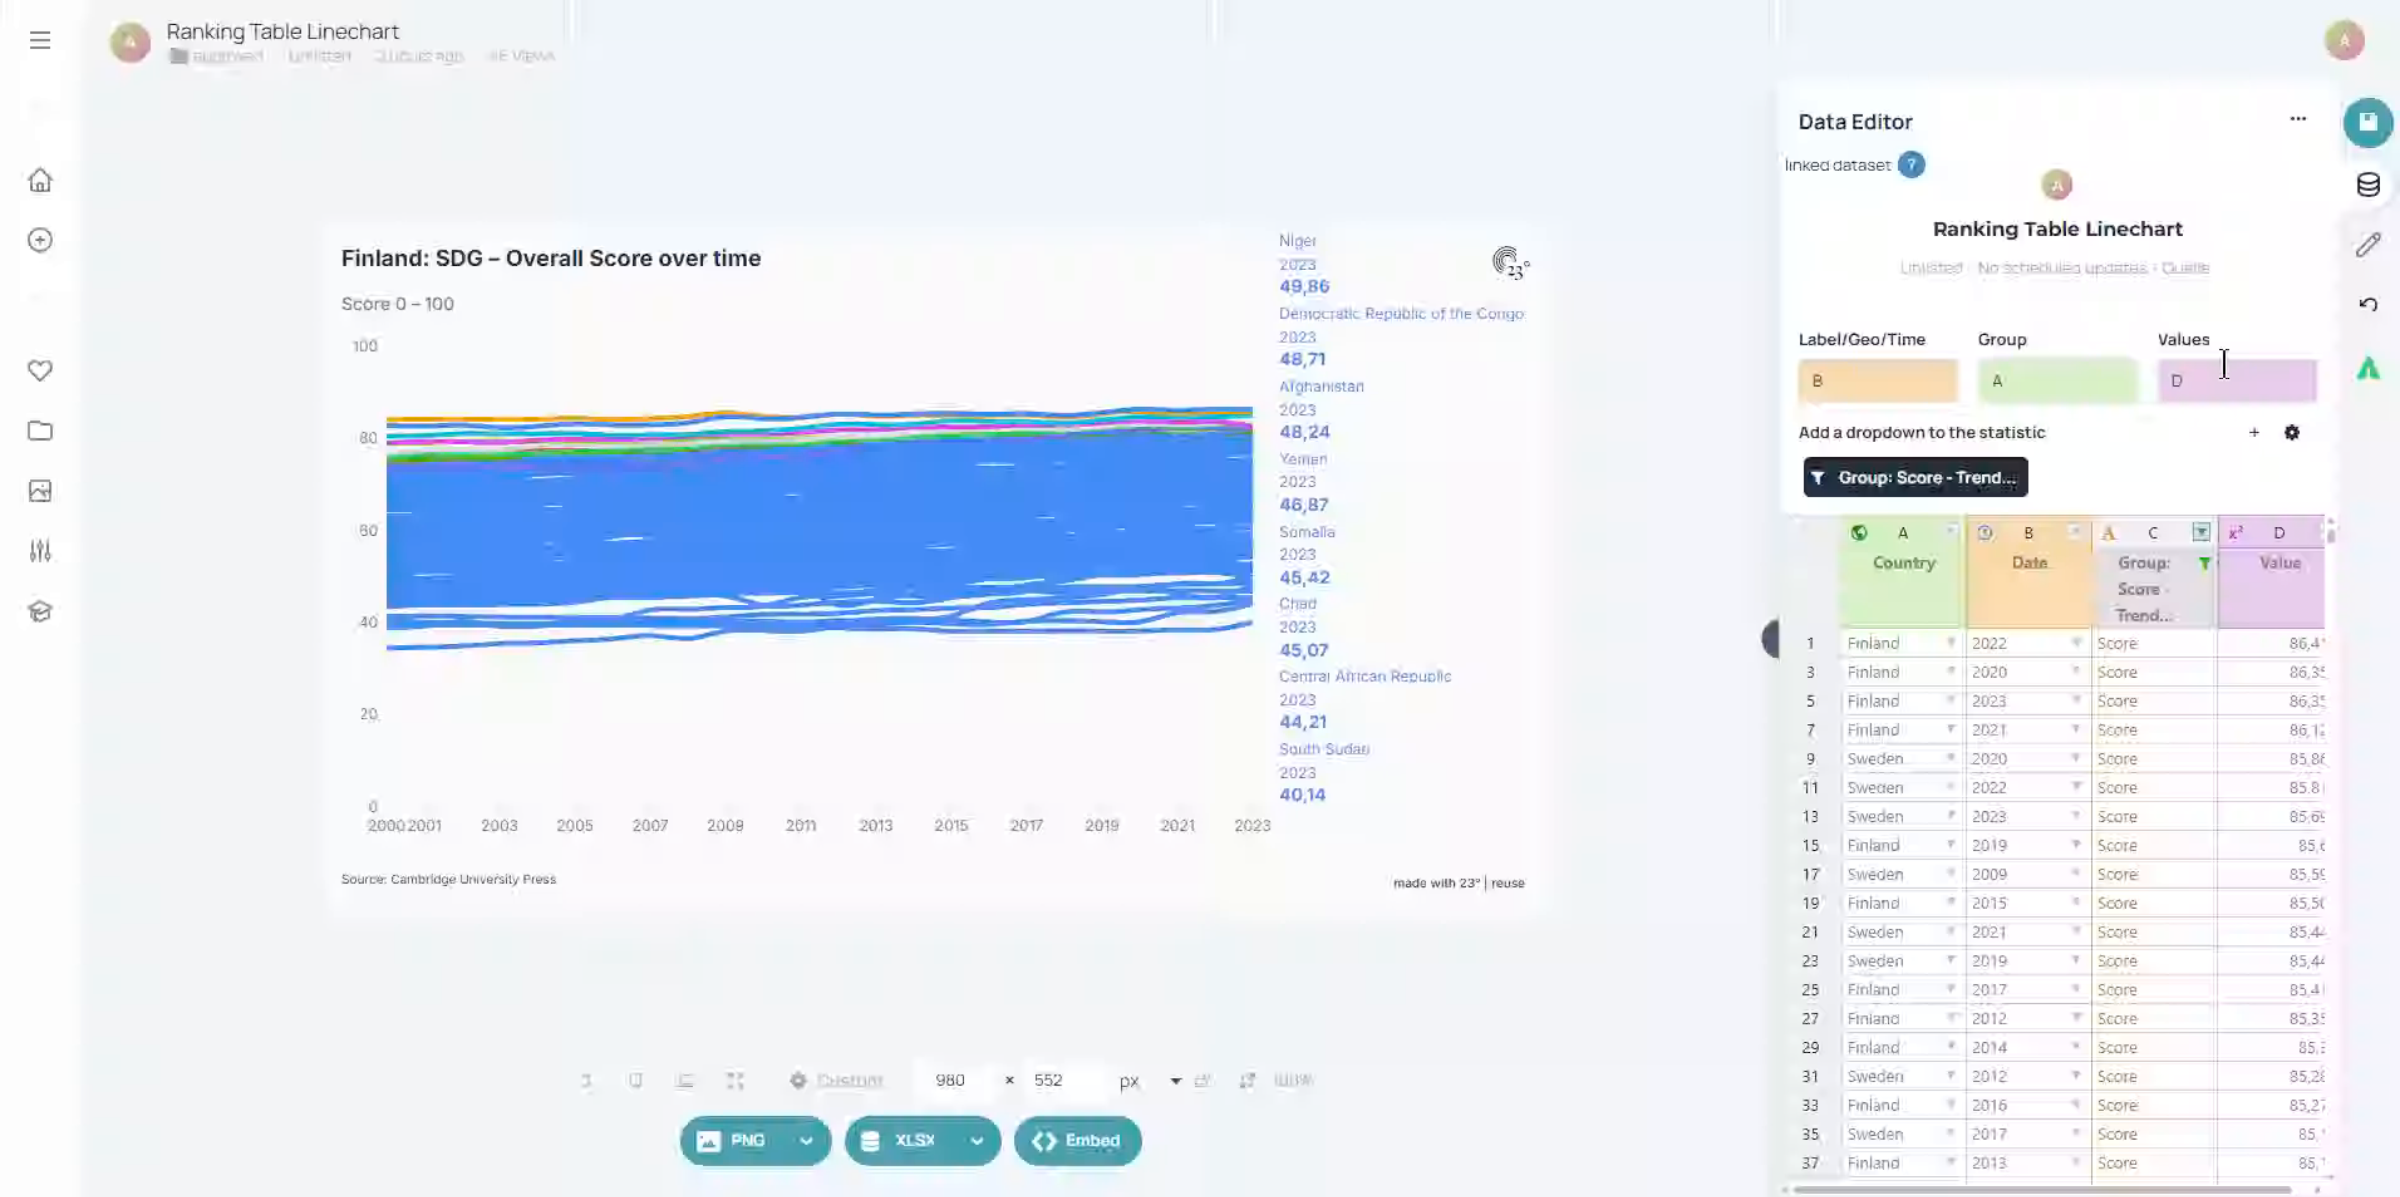
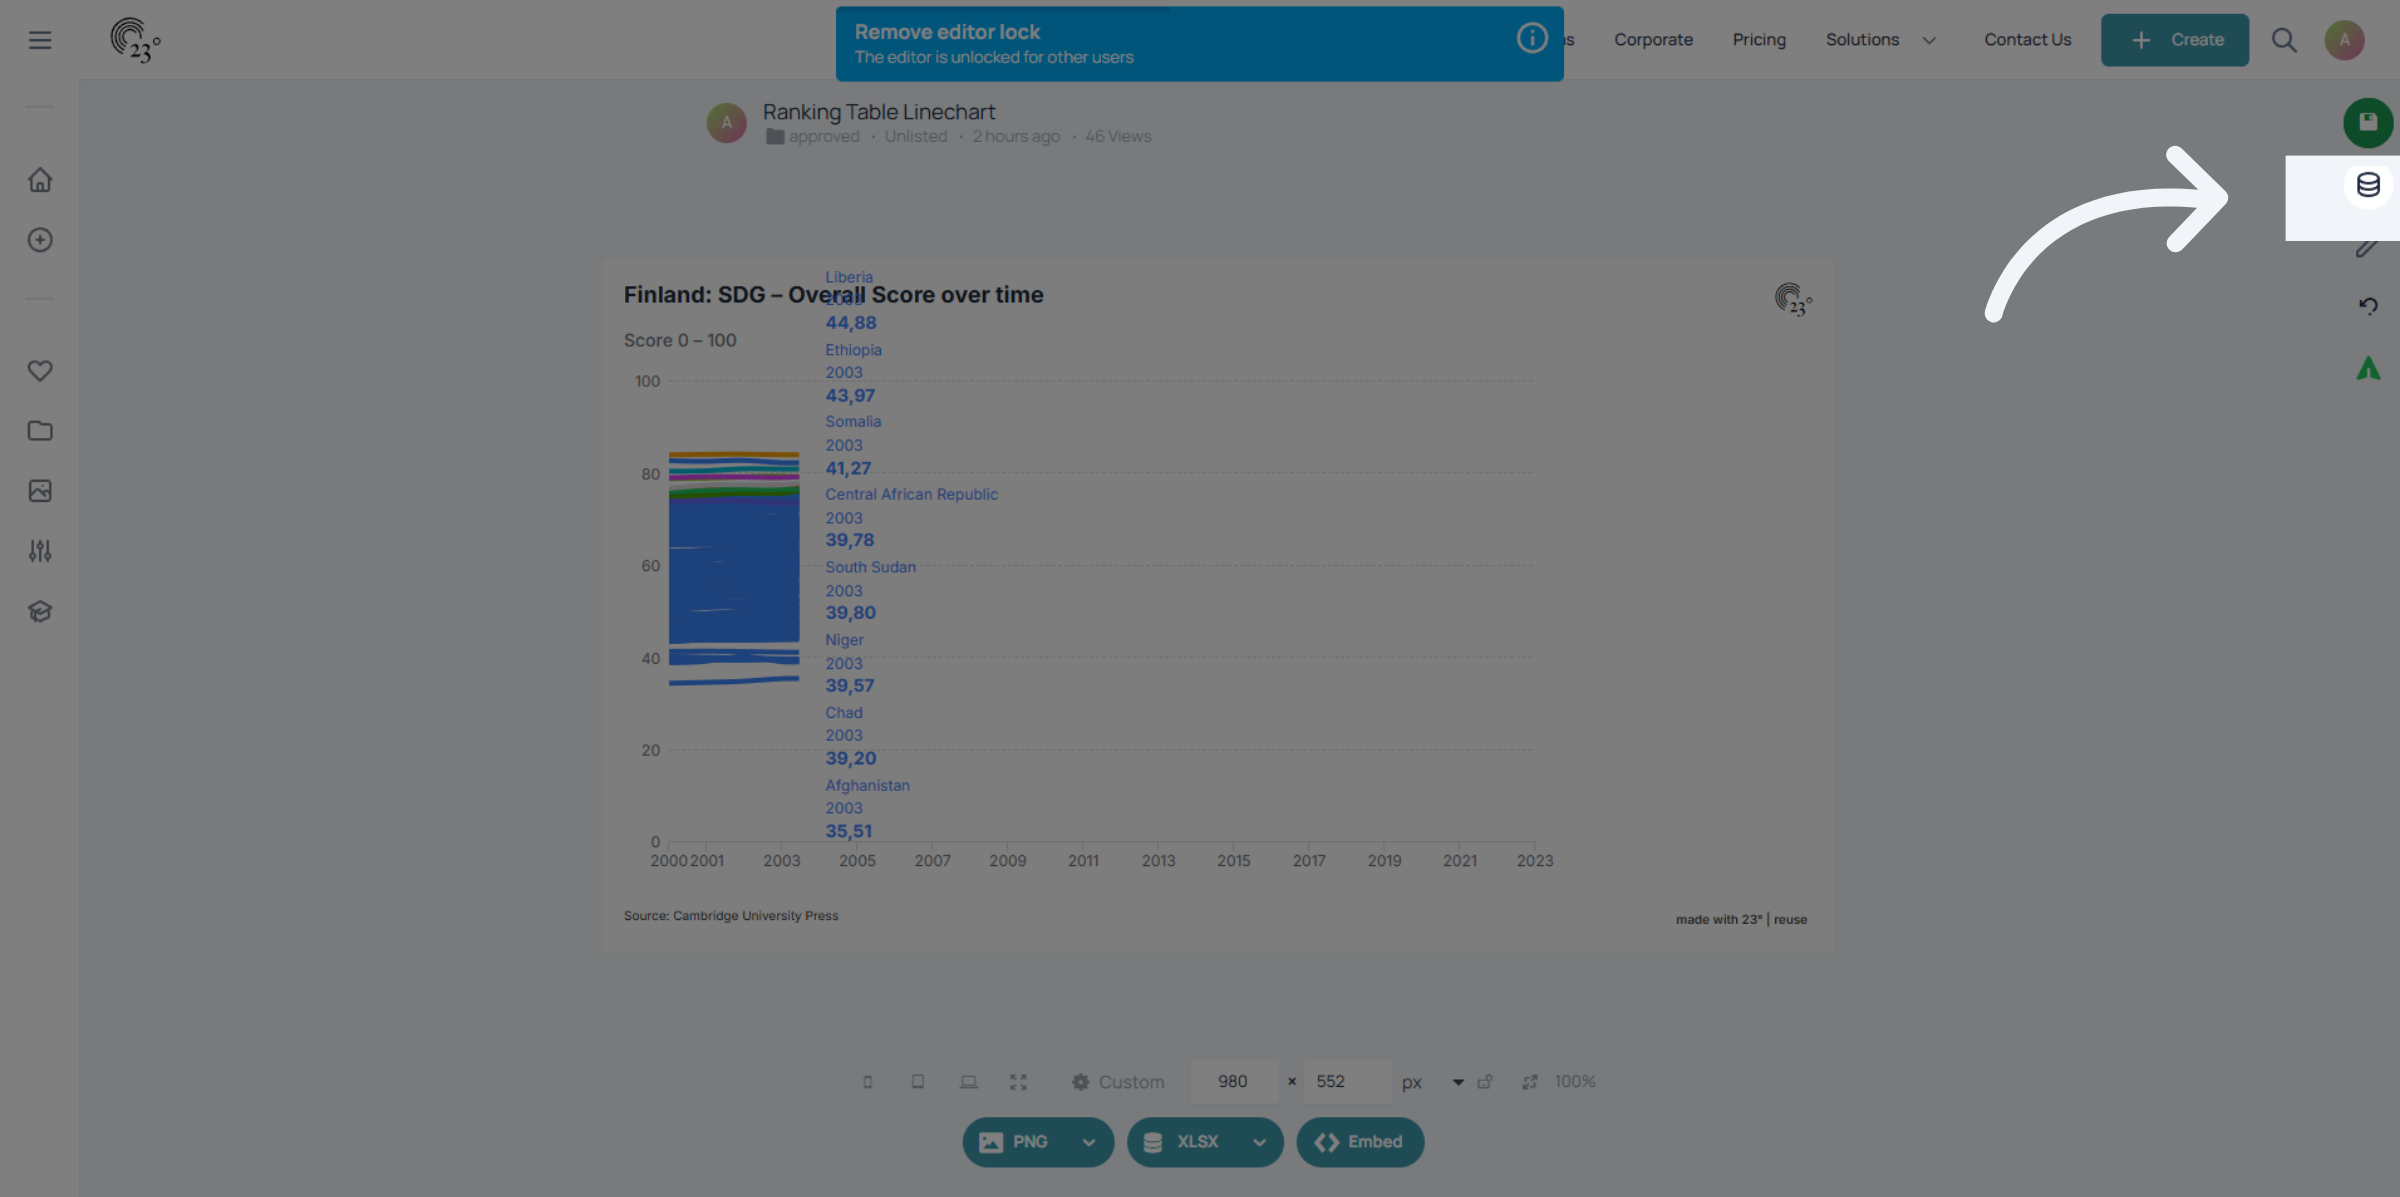
To add a dropdown filter first go to the data editor.
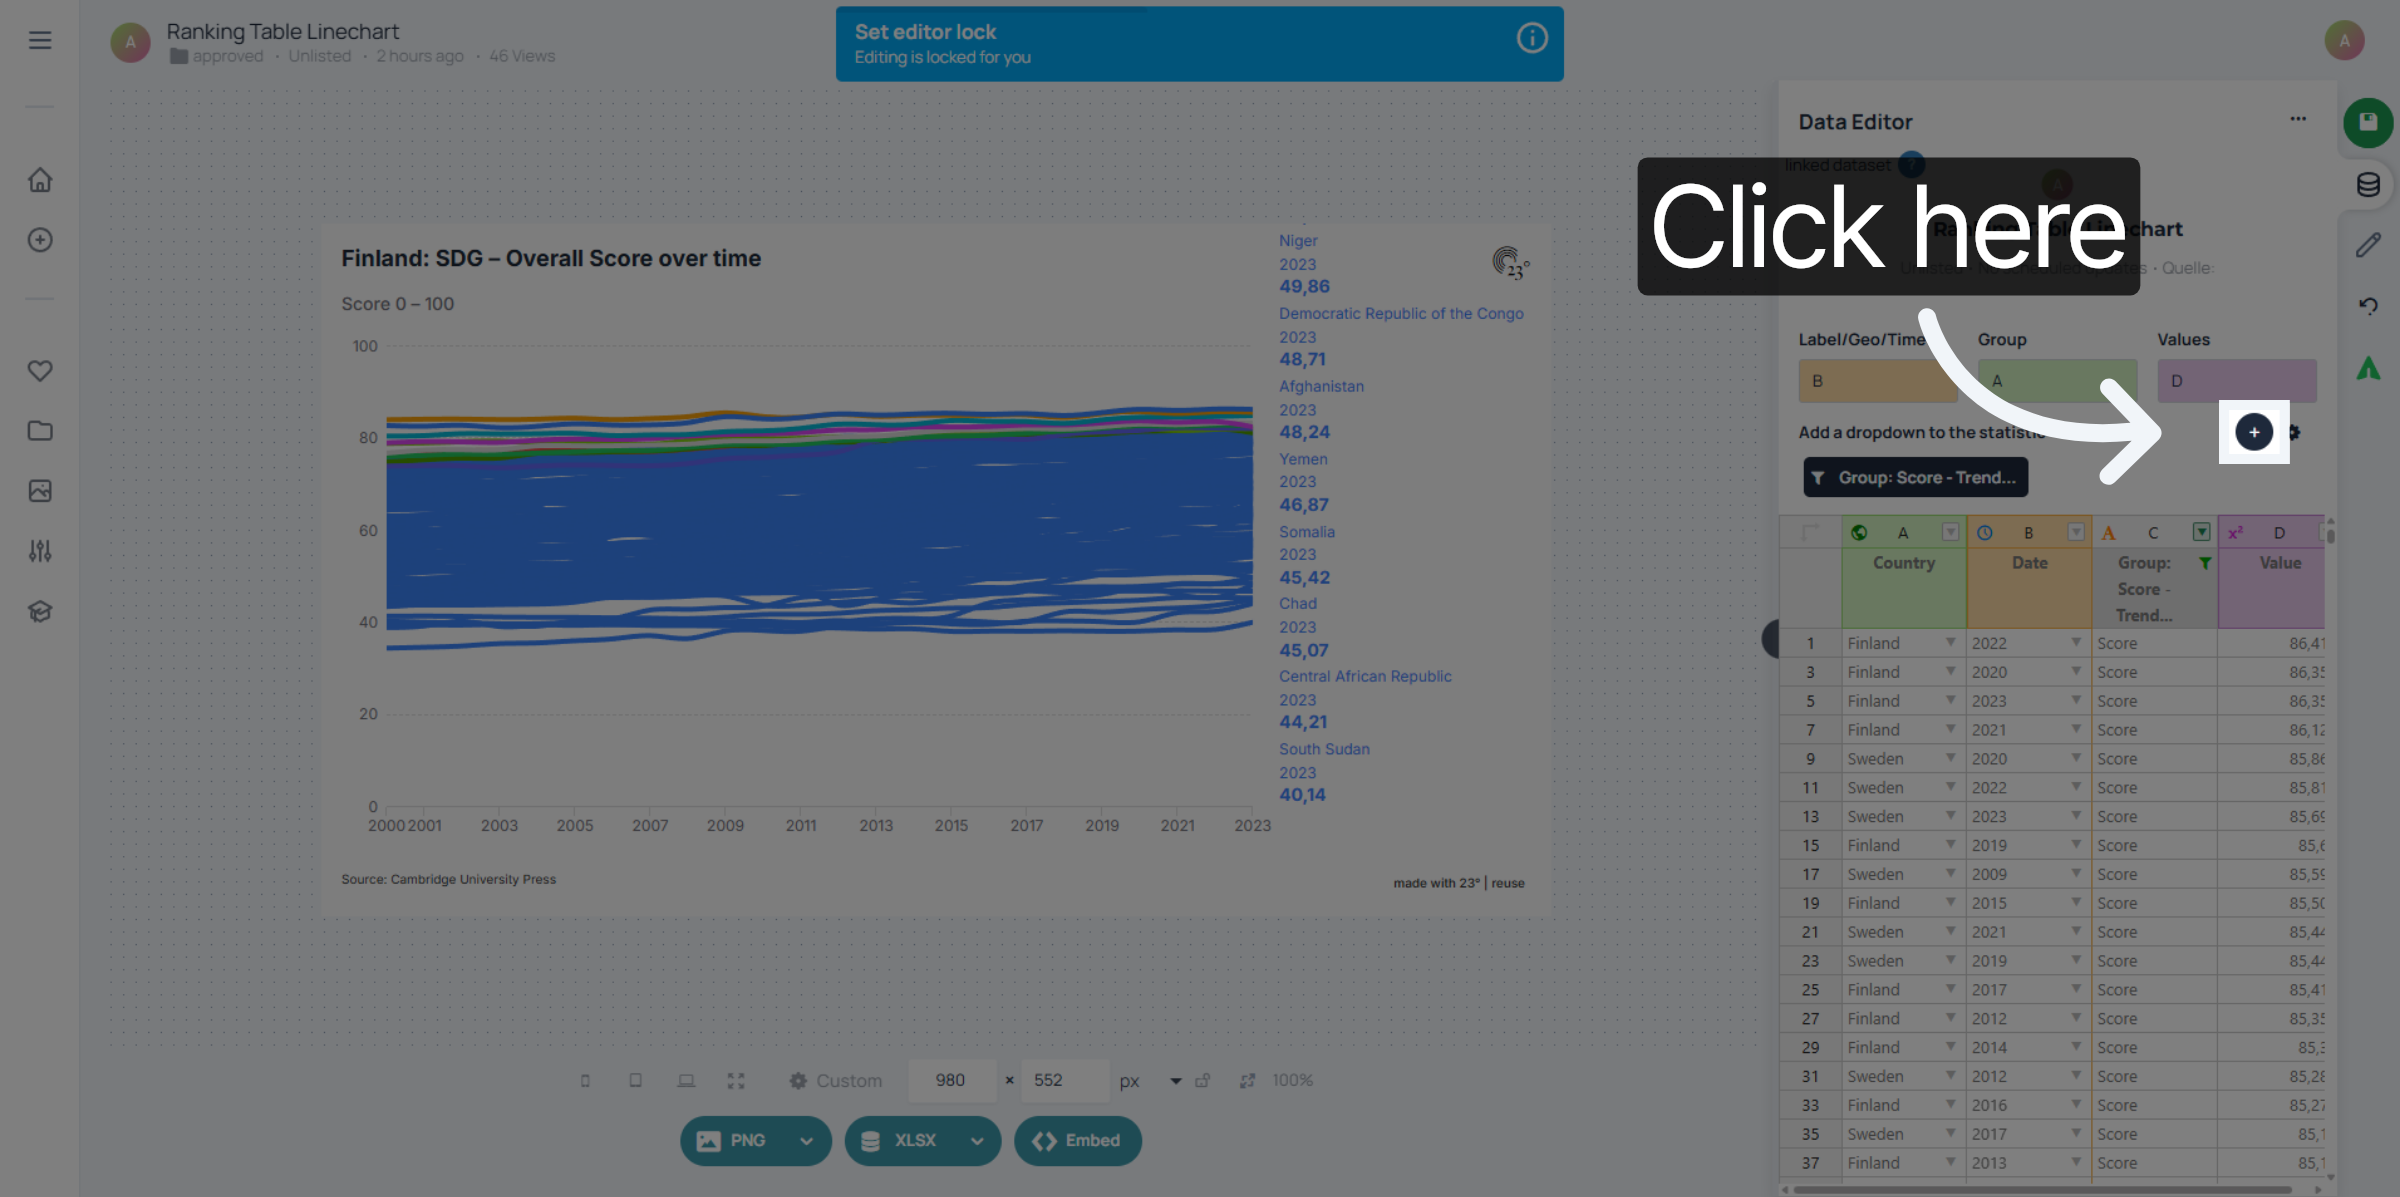
Click the + icon to add a filter.
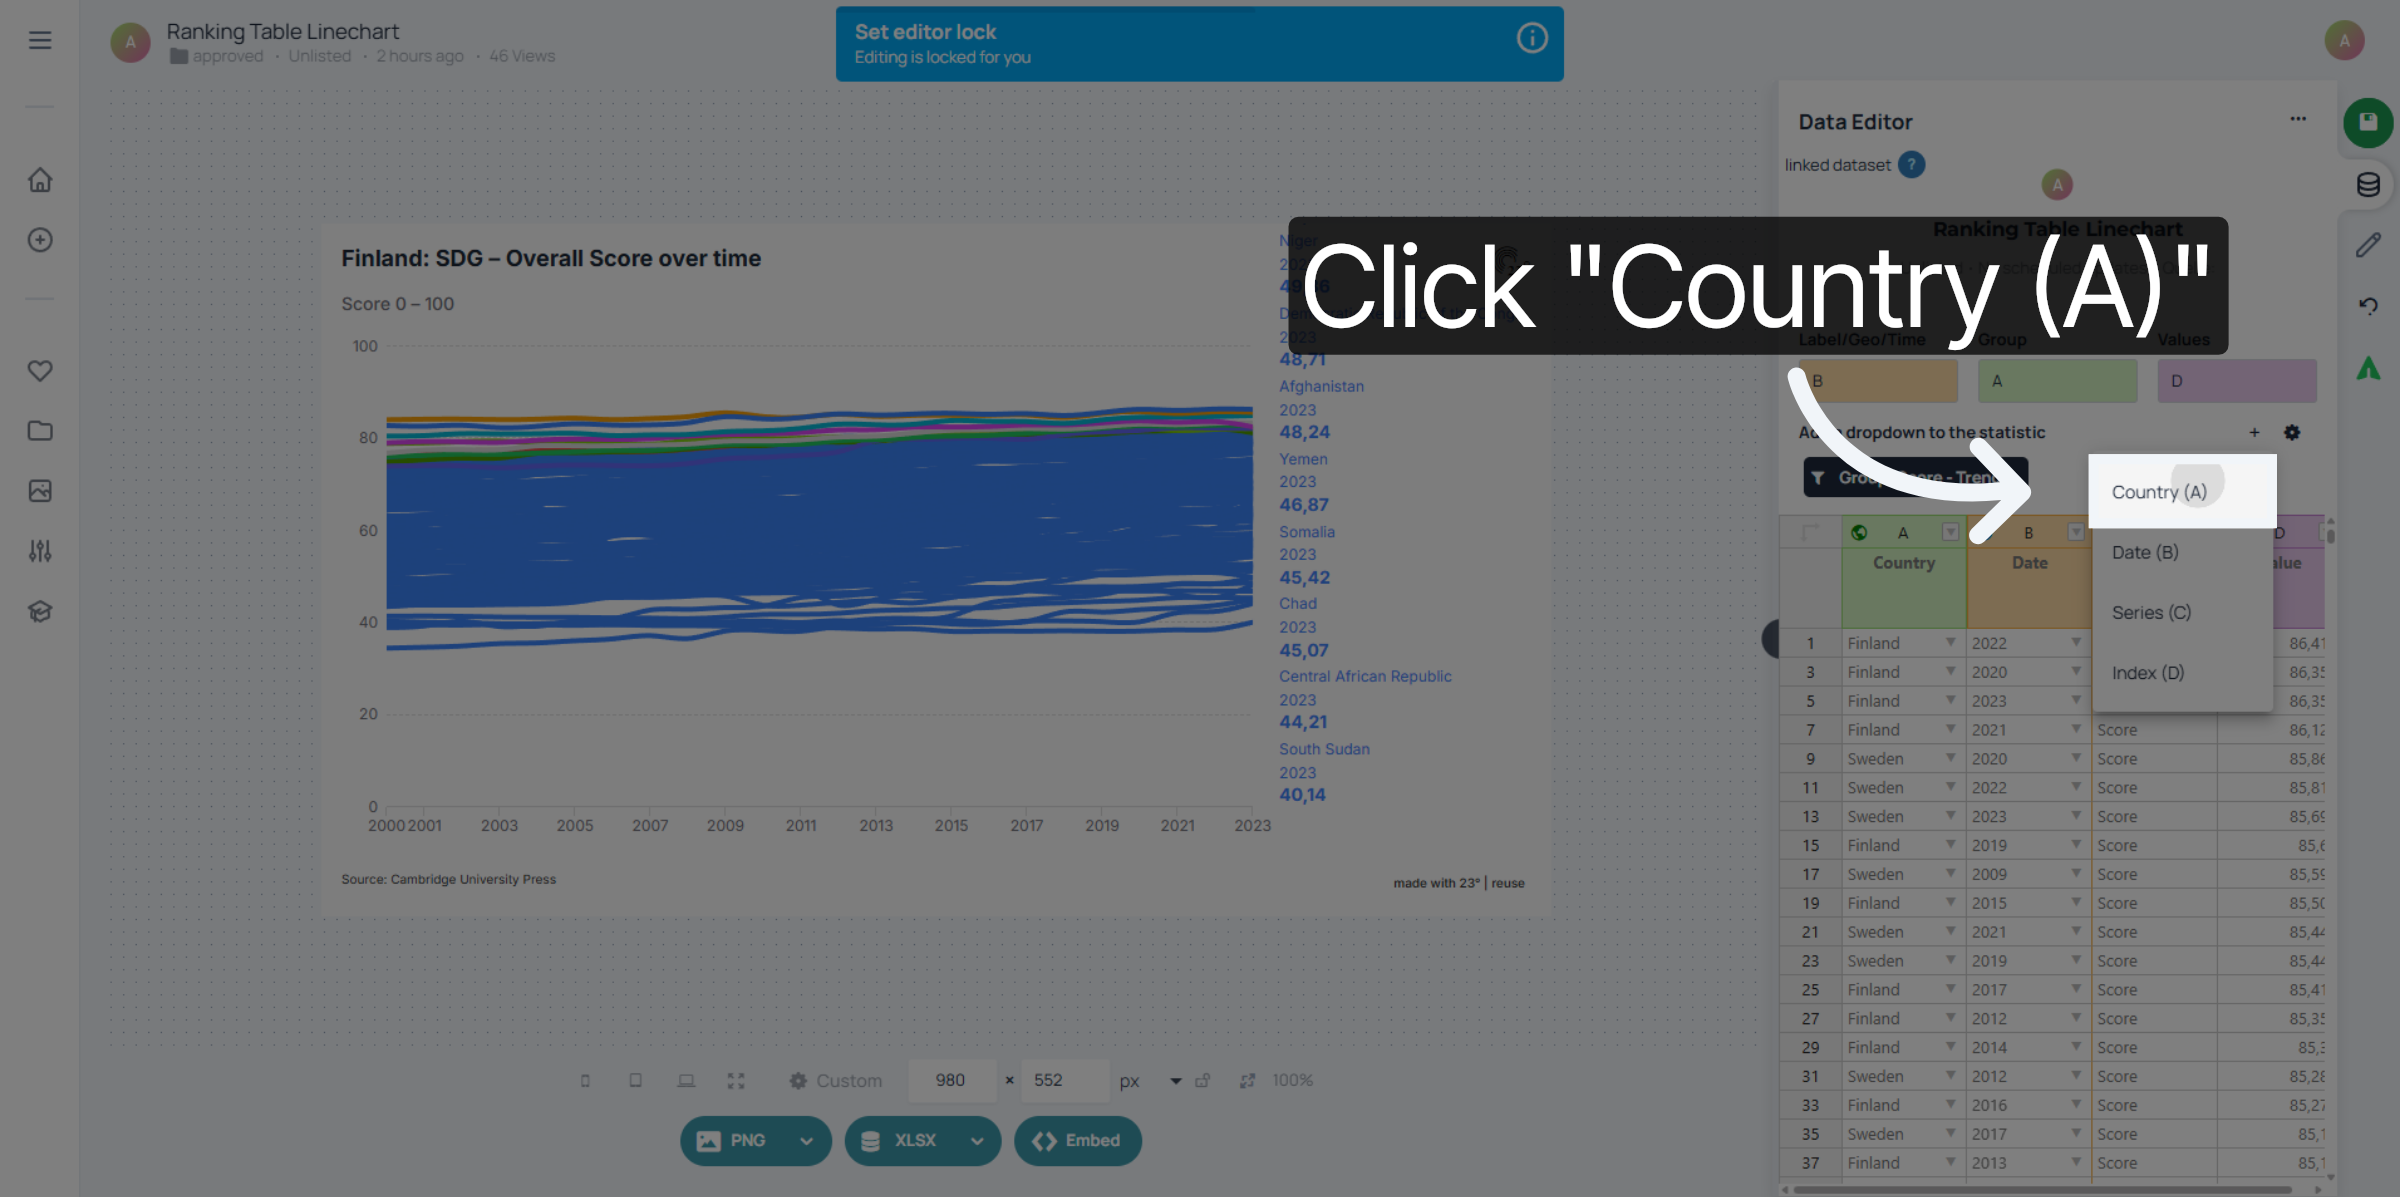
Select your column to filter by.
Your filter is now being displayed in the visualisation
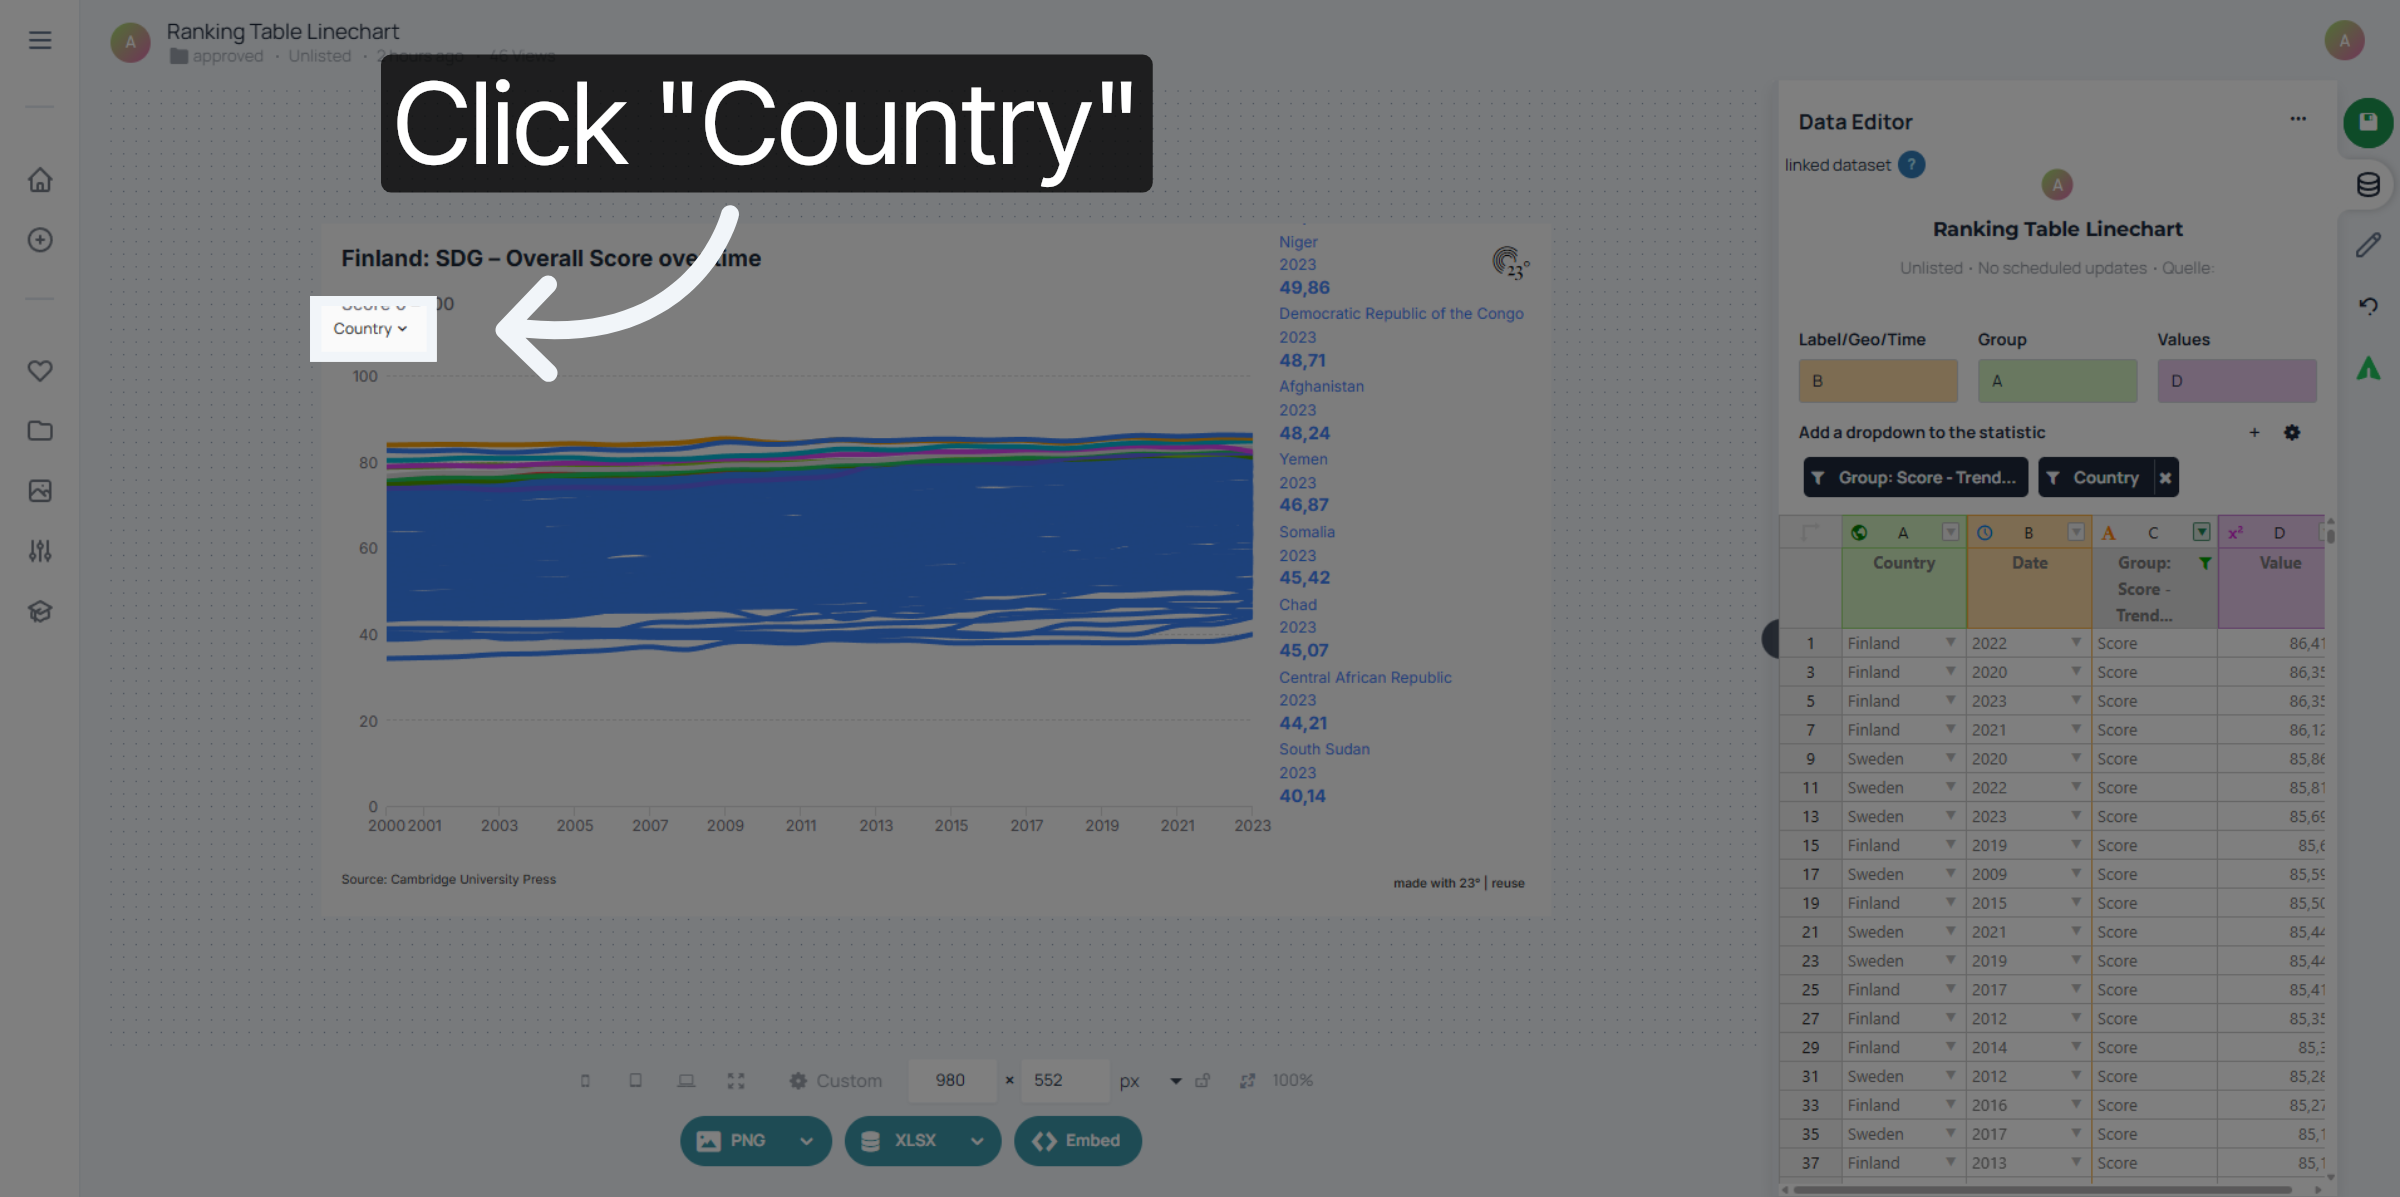
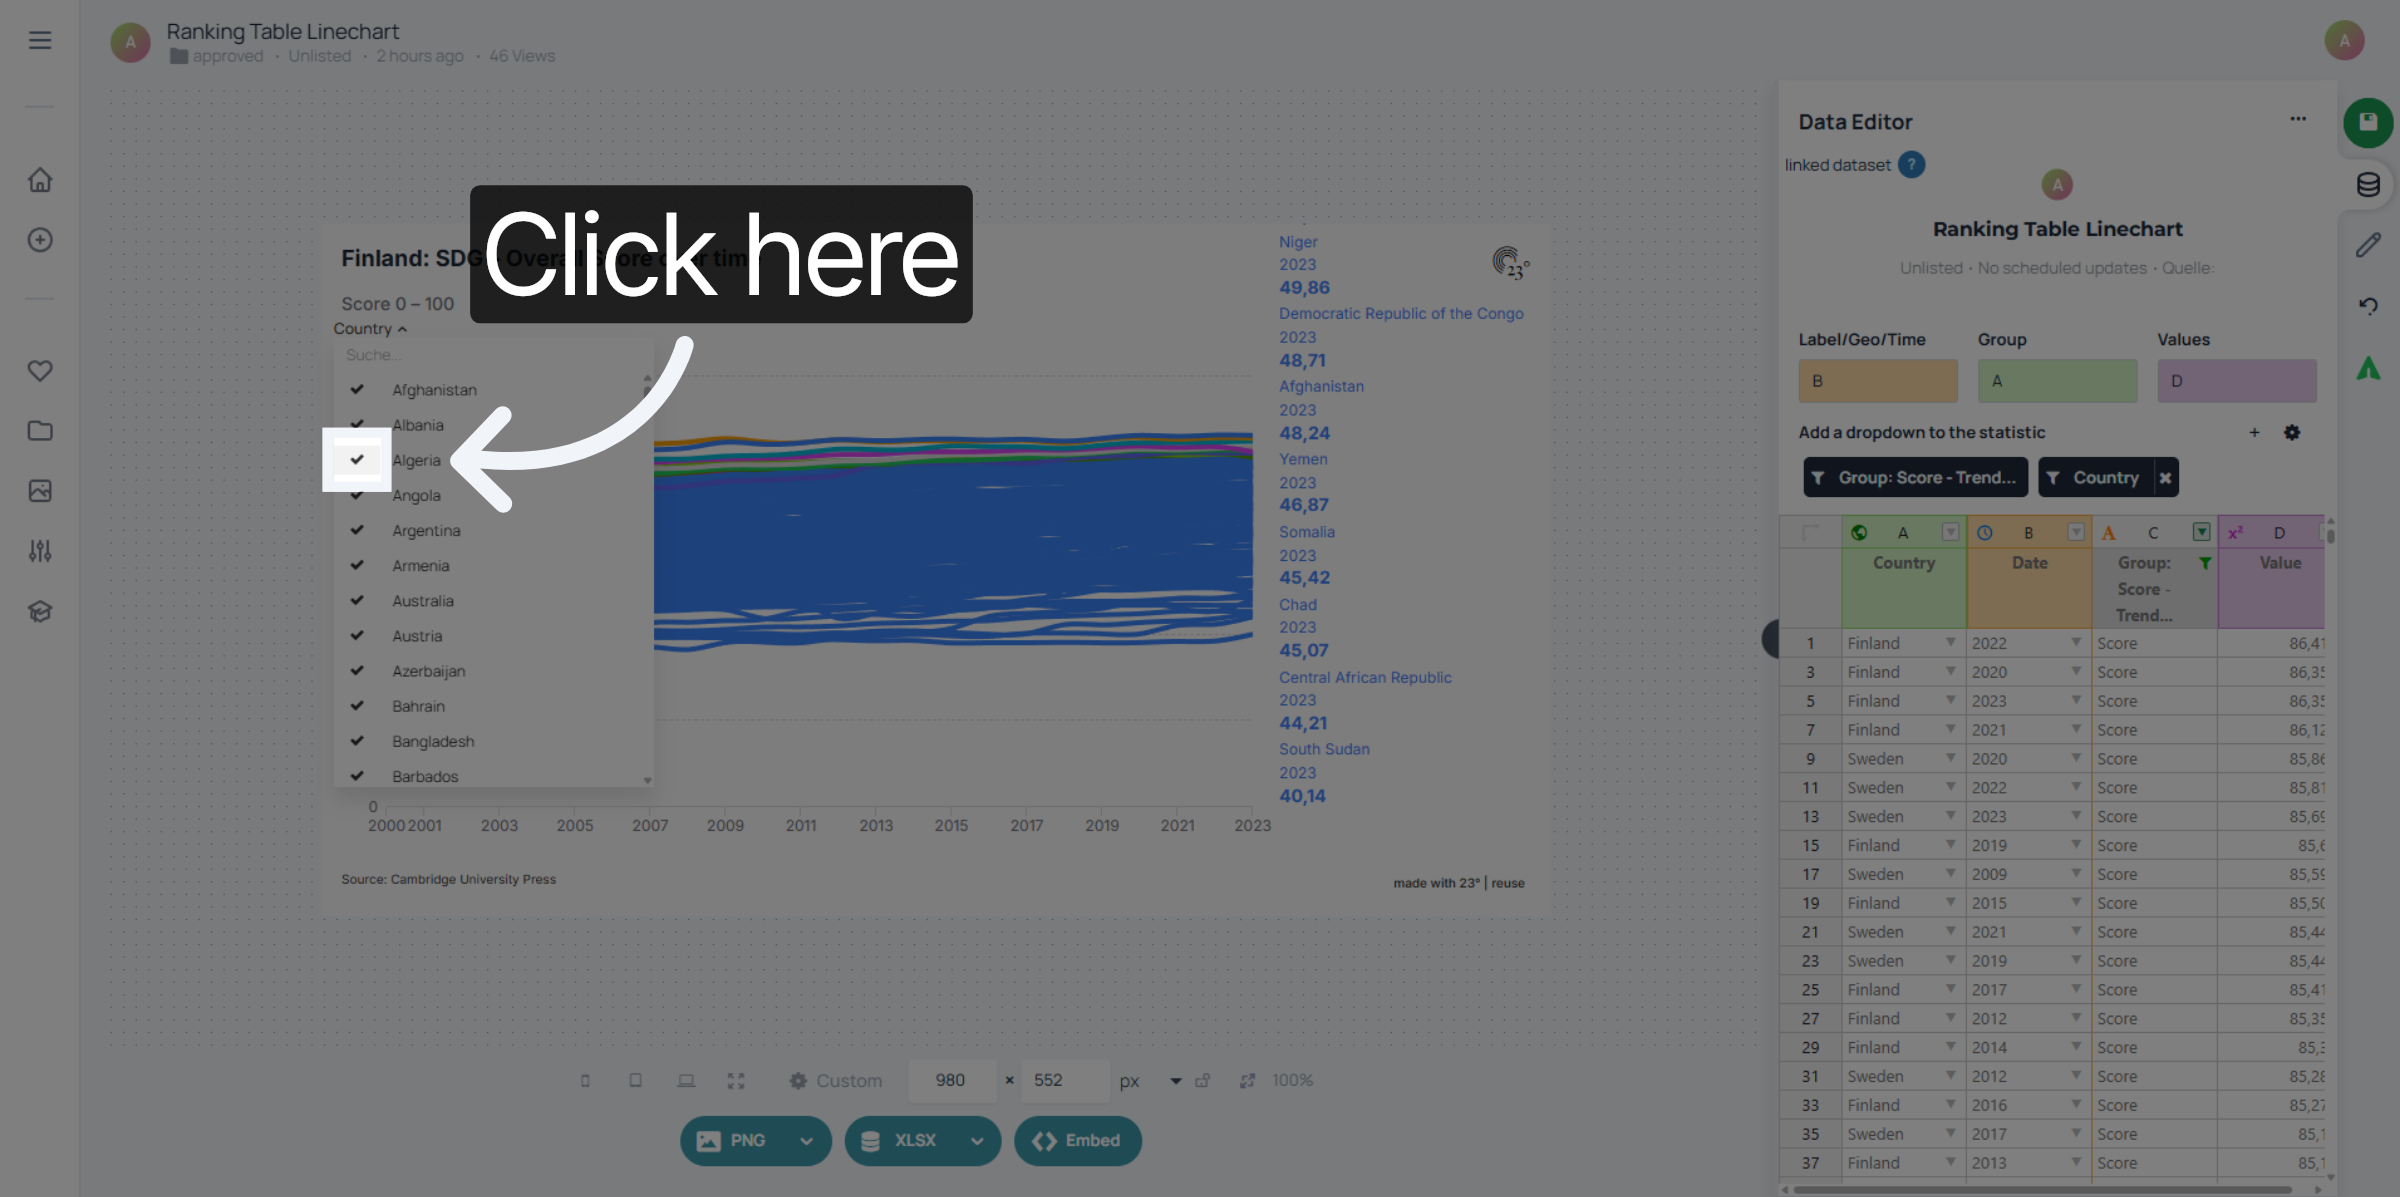
Per Default the filter is defined as a multi value filter. you can choose multiple items by clicking on the checkmarks for single selection you can click on the label
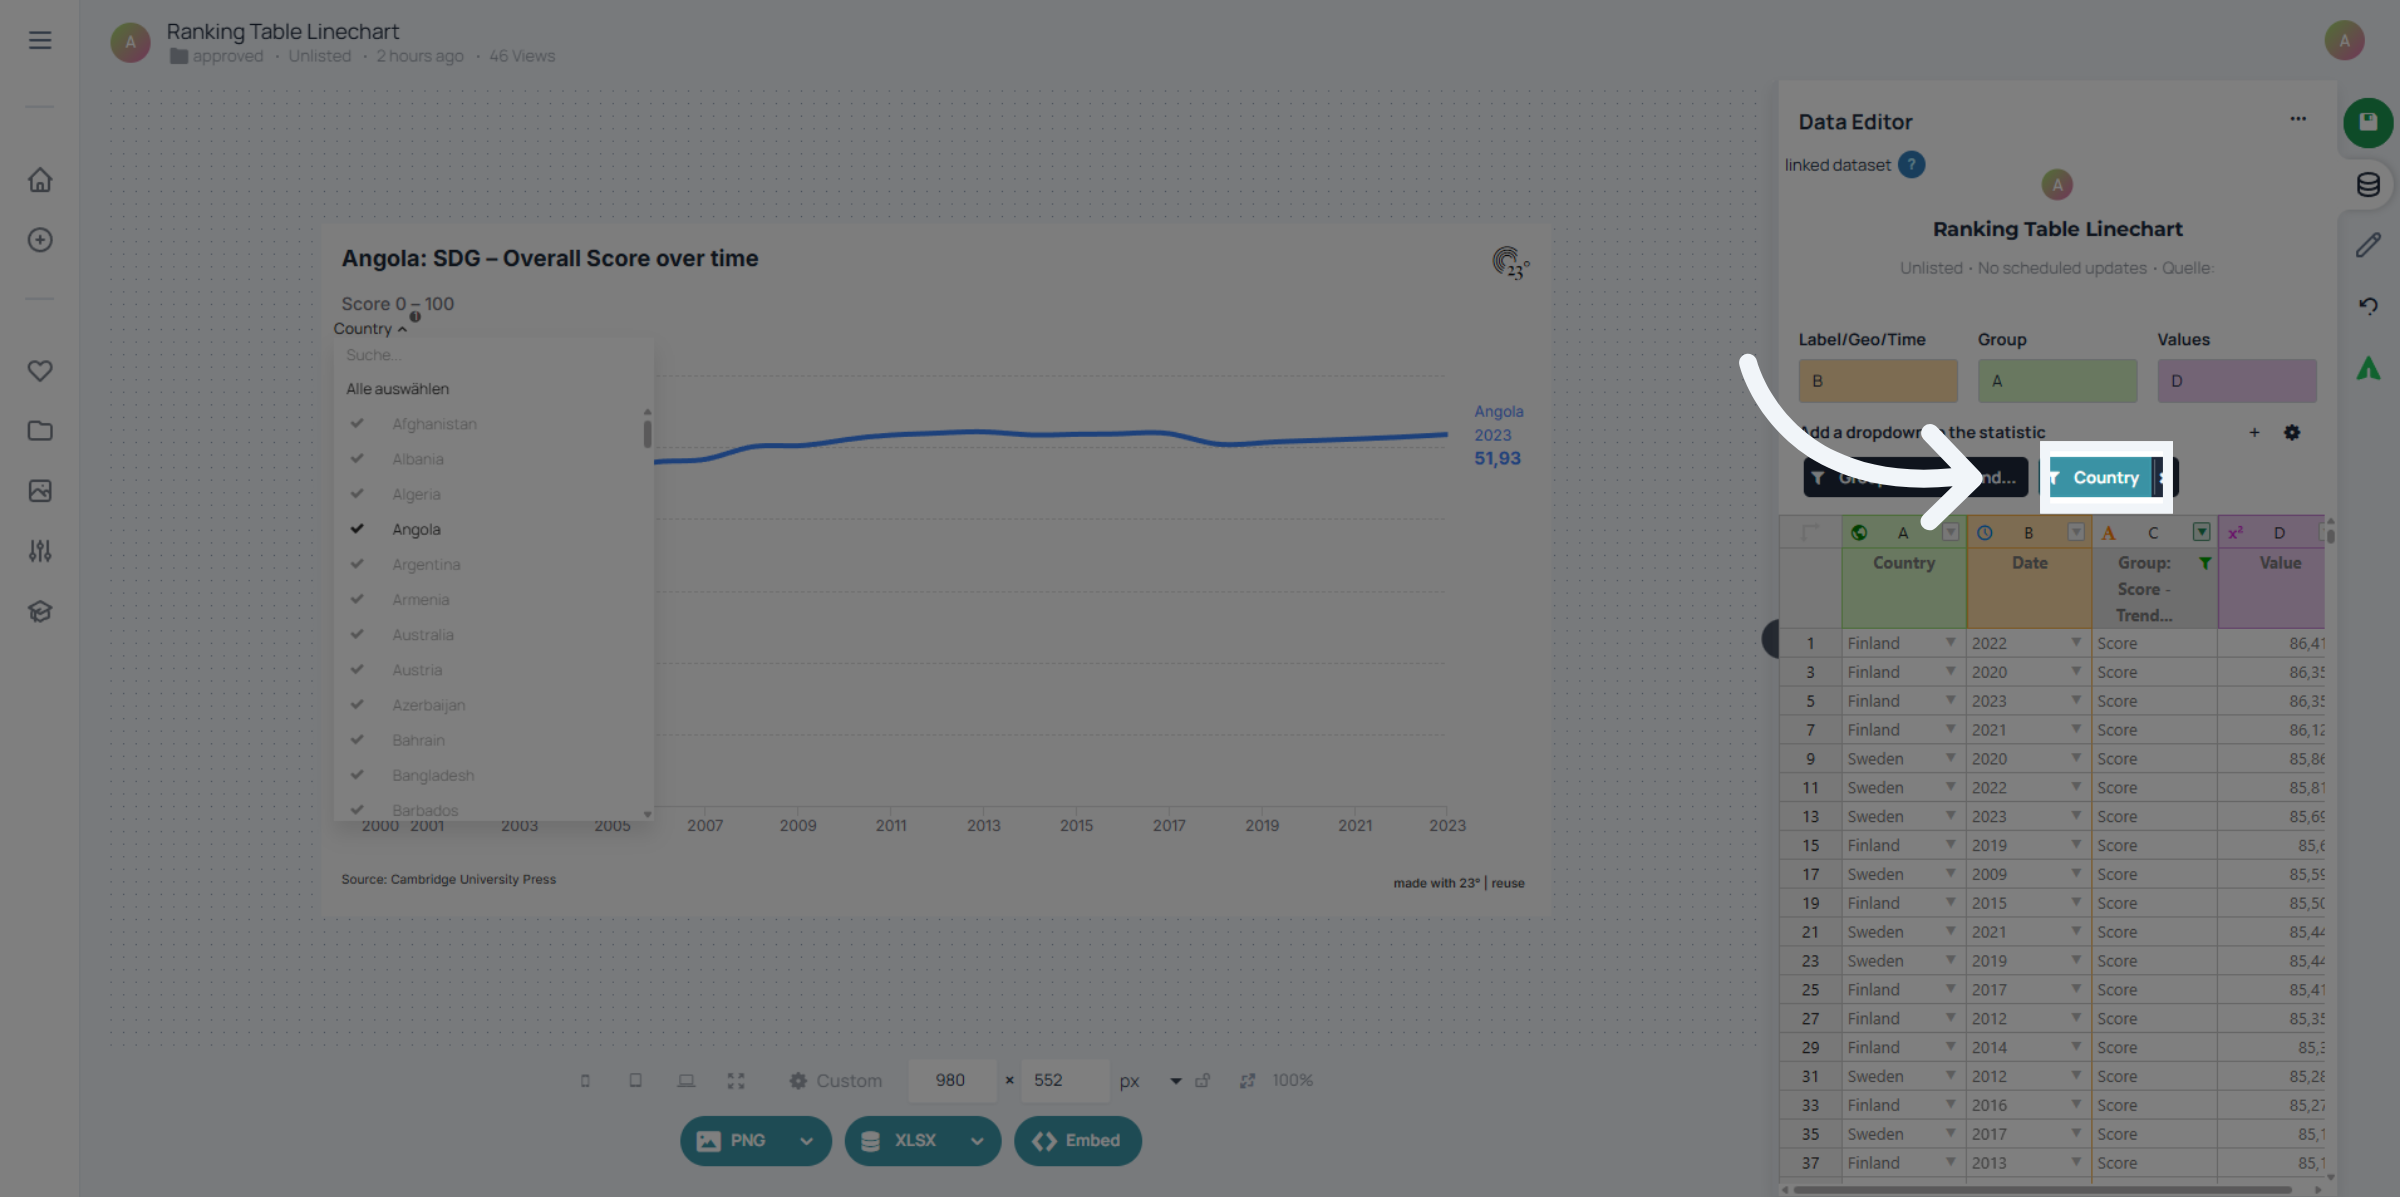
Click on the filter for more settings.
You can set your dropdown to either be a multi or single value filter.
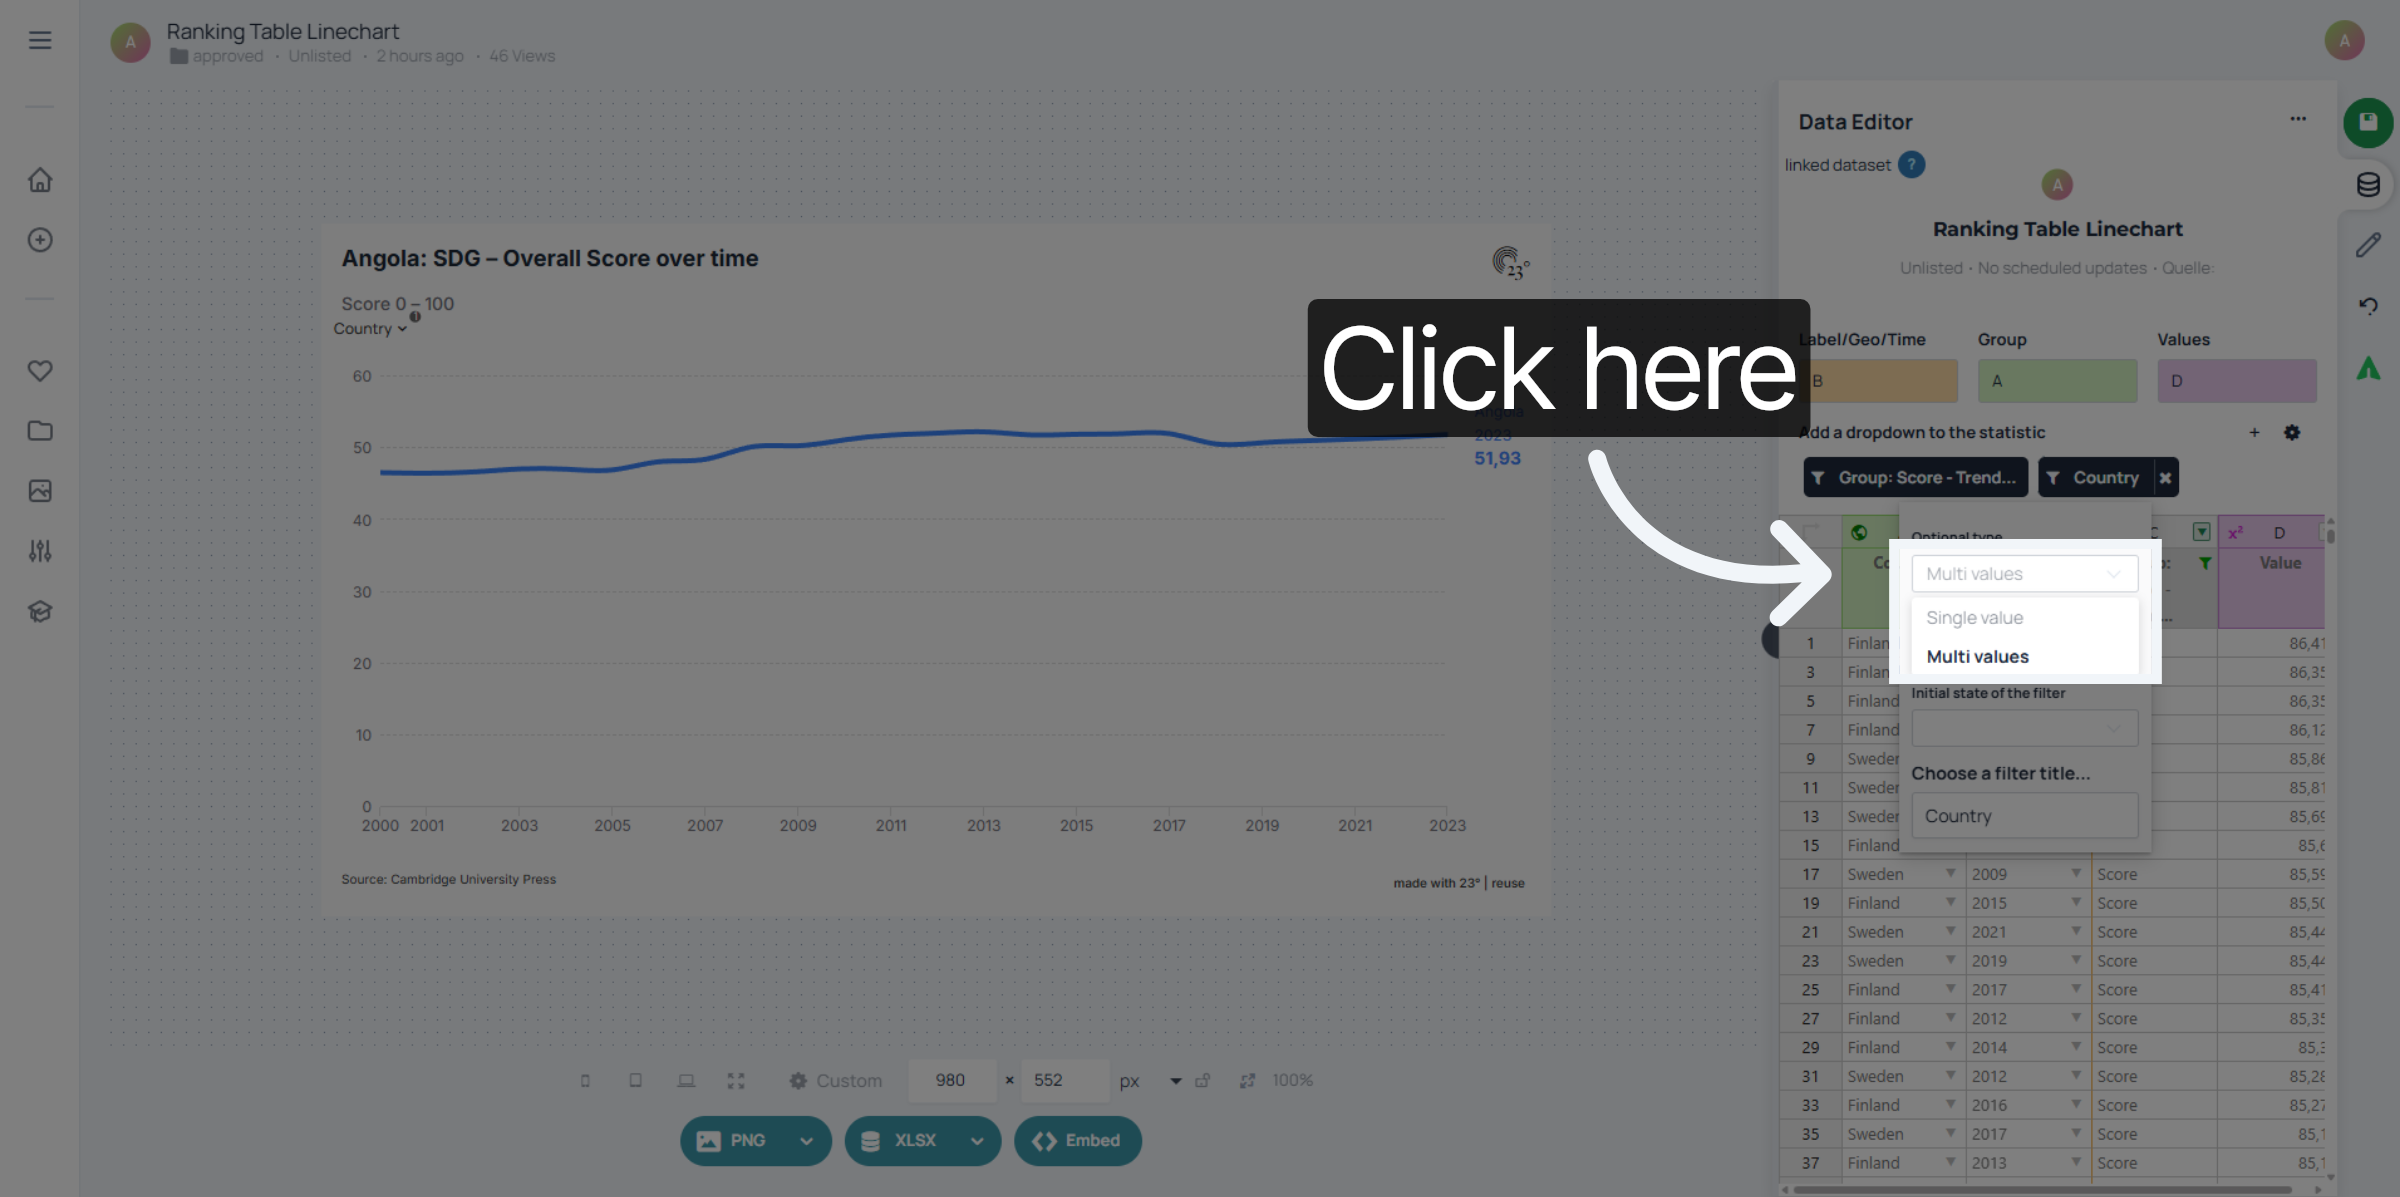
You can select first, last or custom entry as your default filter view.. For custom just select the label or region you want to display first and save the visualisation
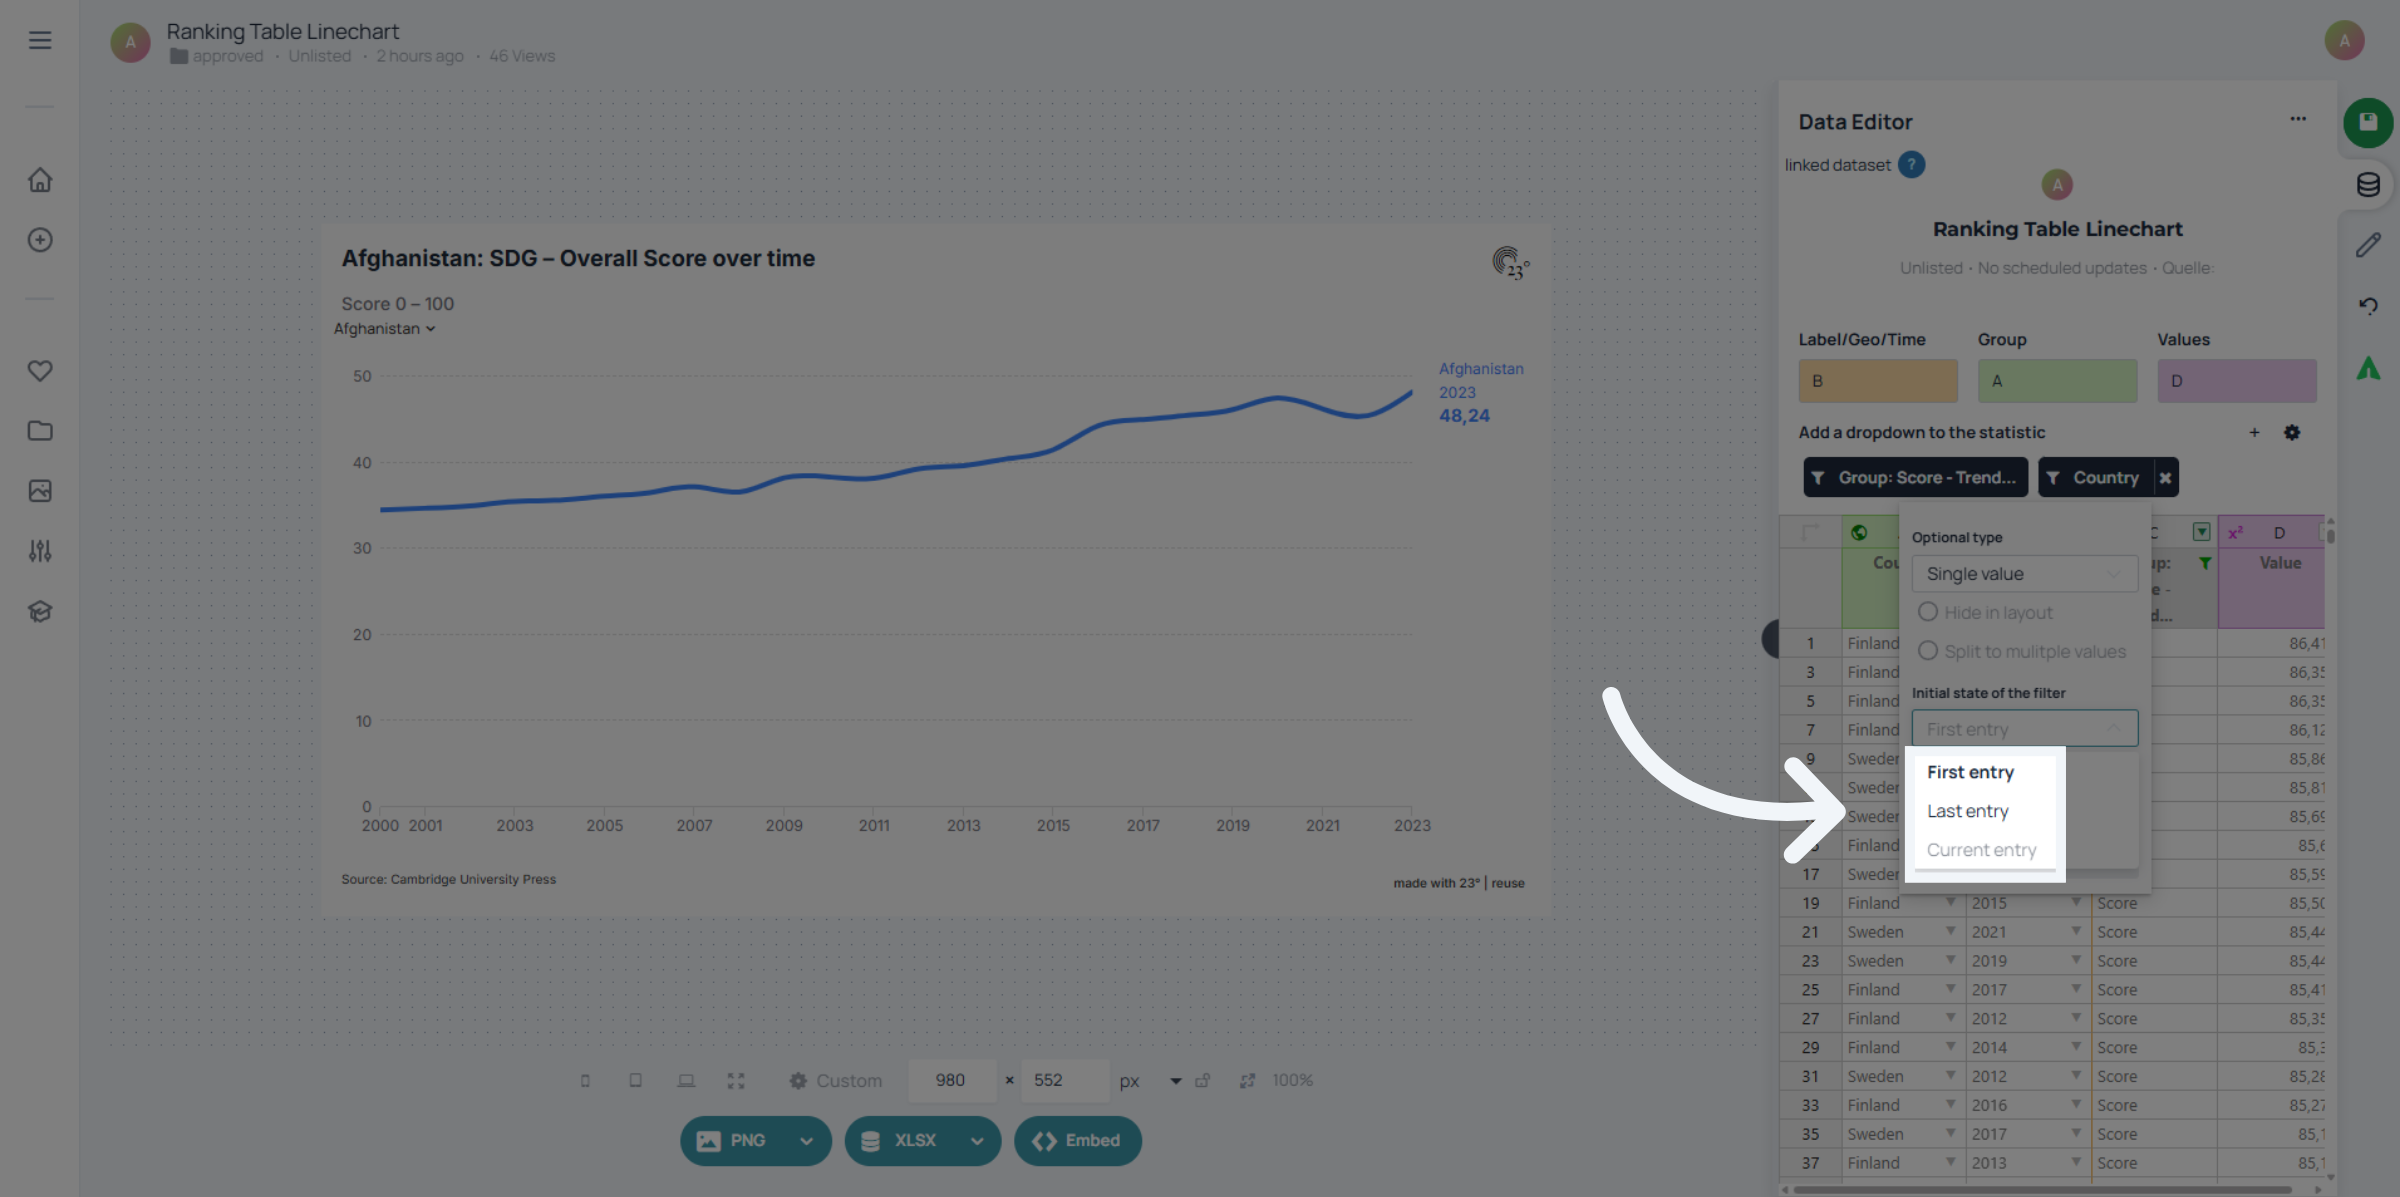
Click the Filter type option to modify filter behavior.
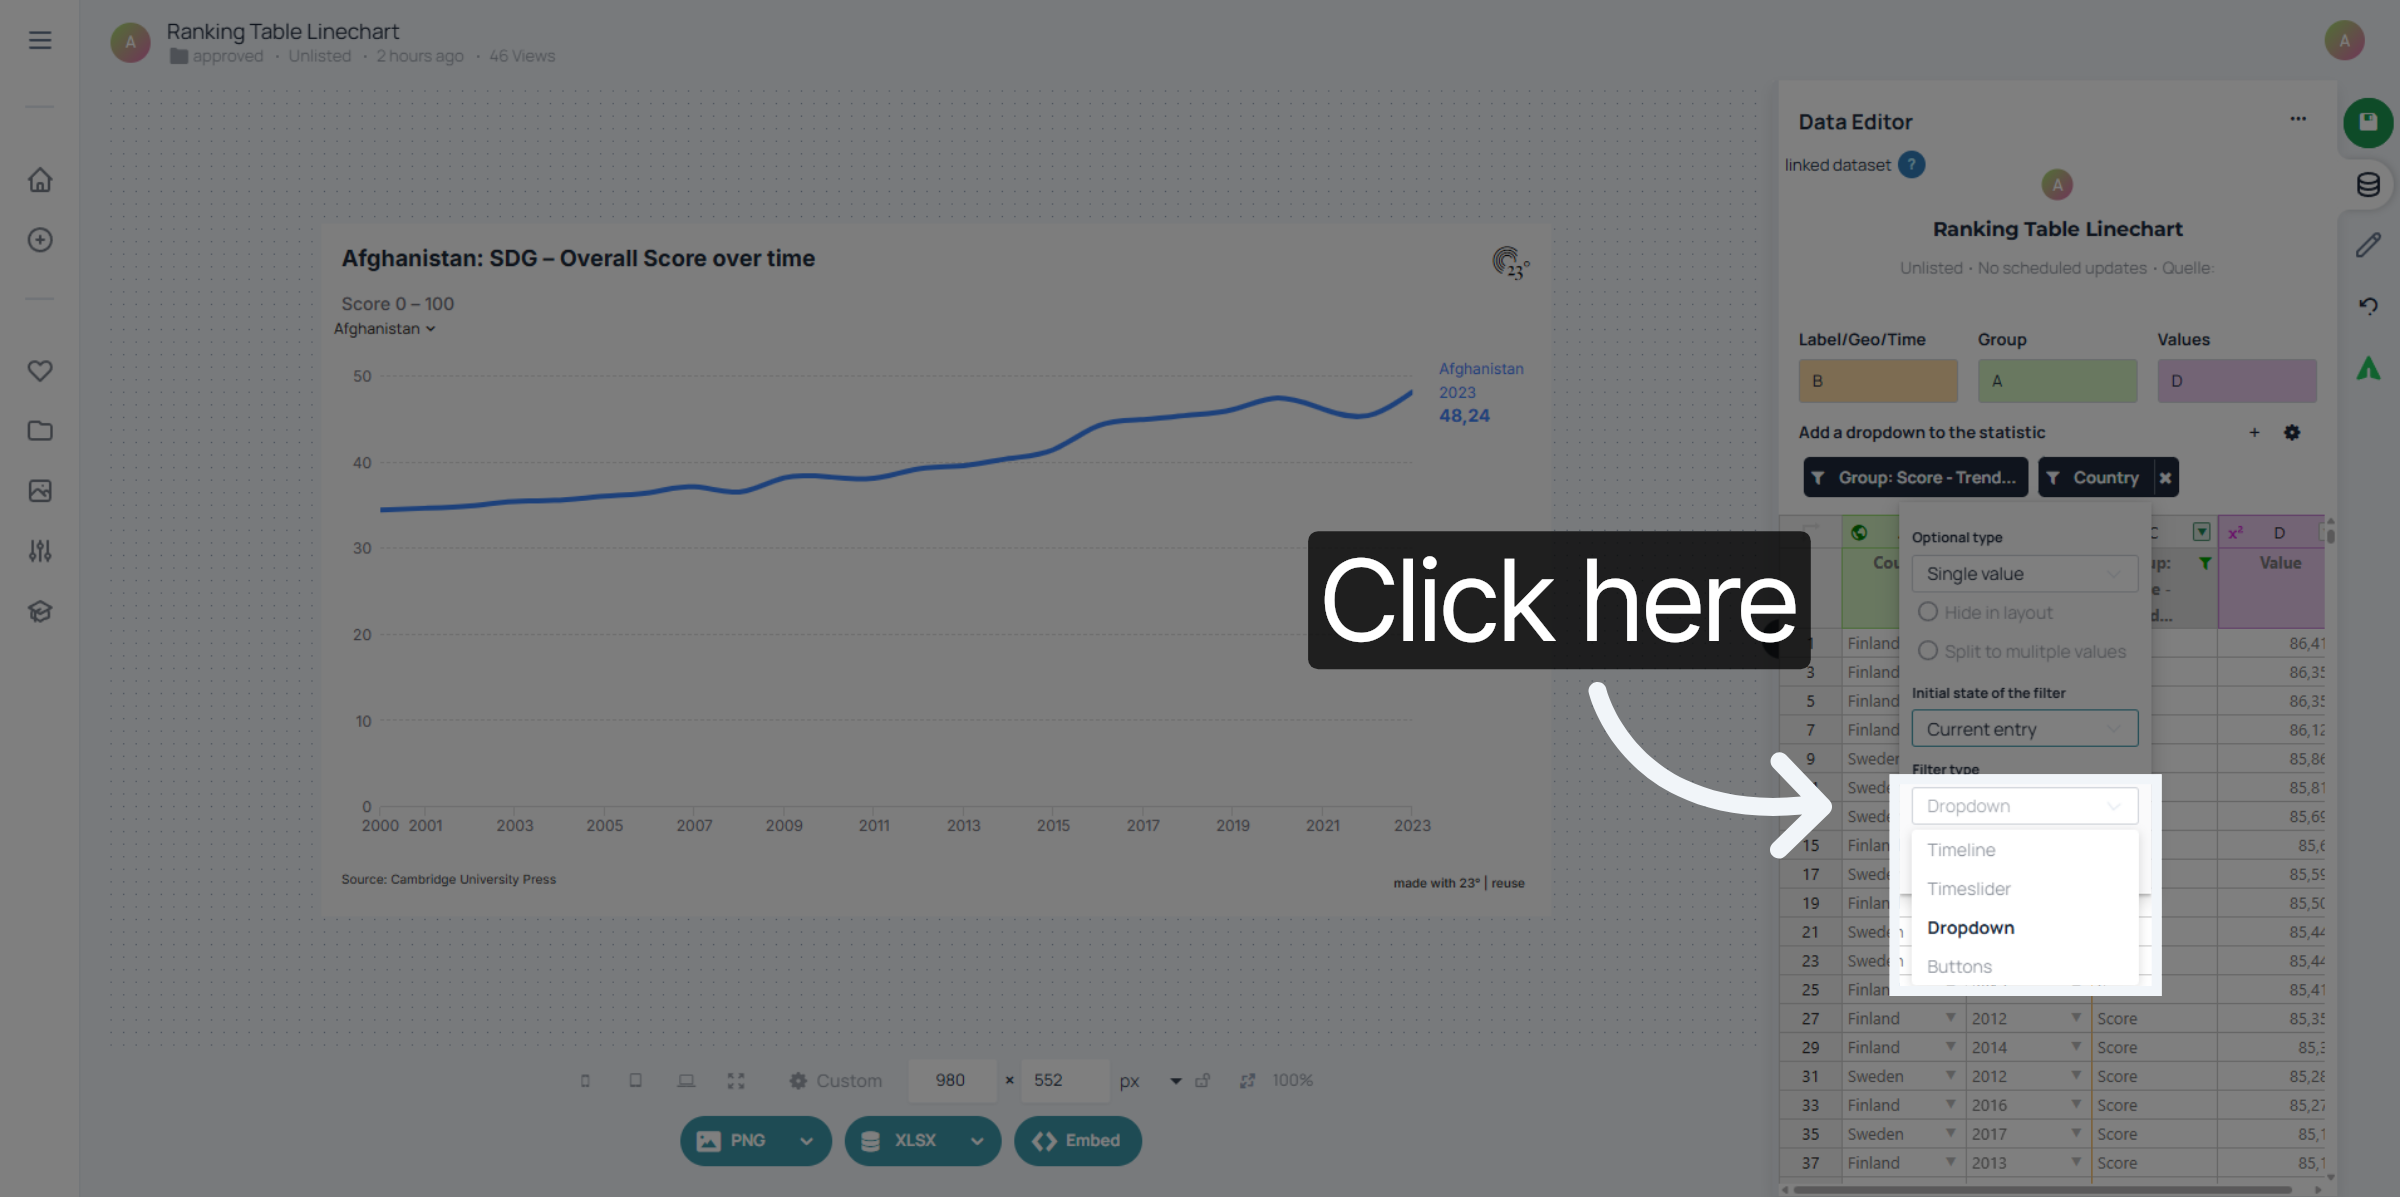
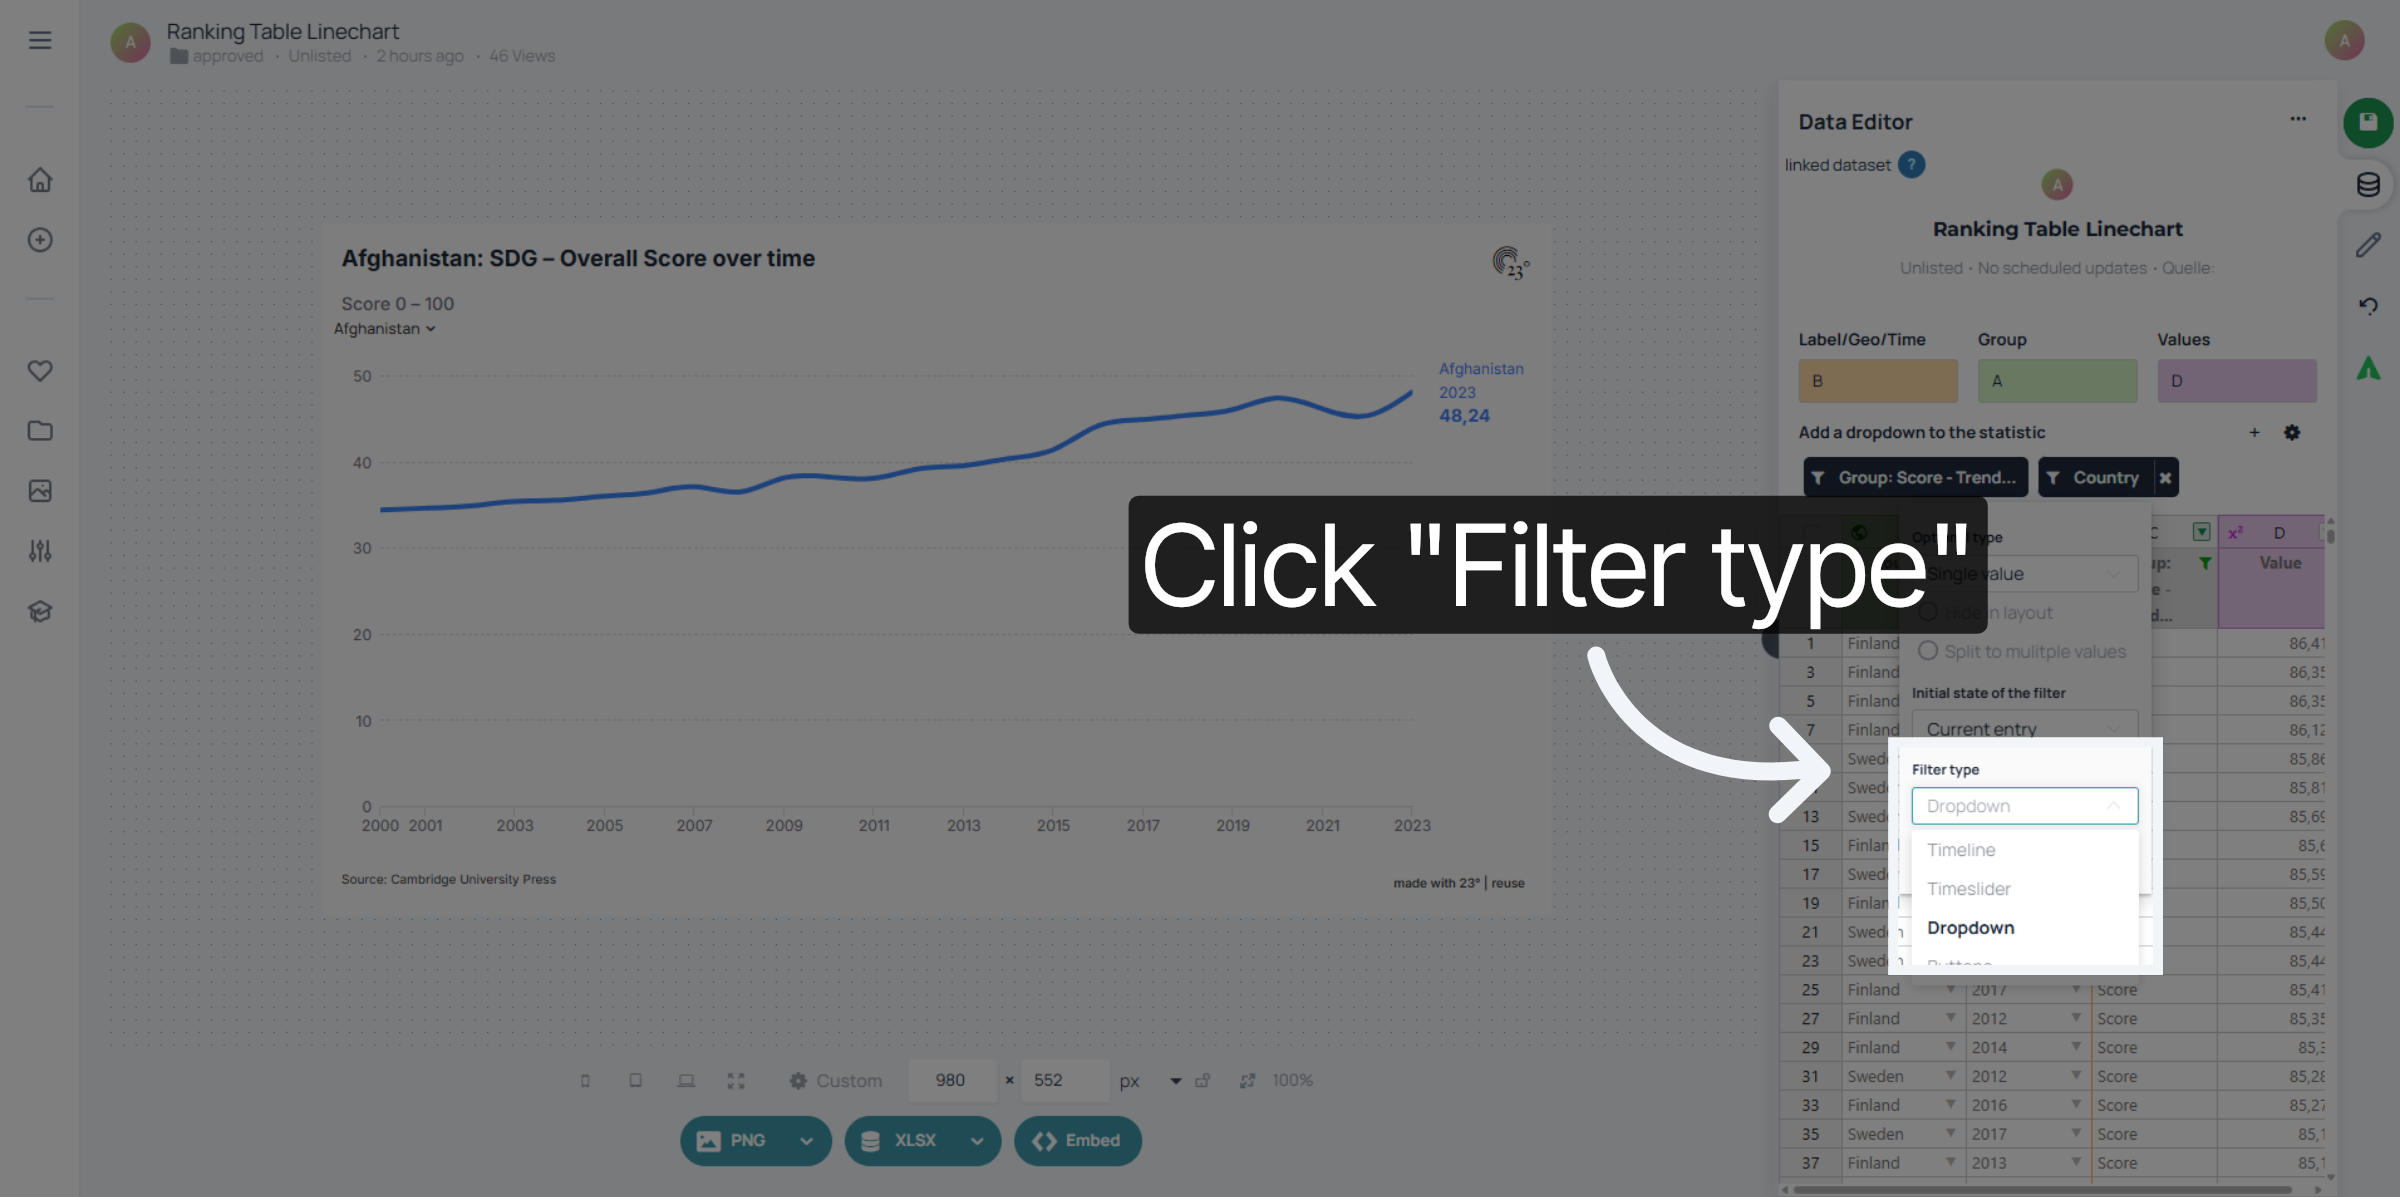
Click the Filter type to change the the filter type.
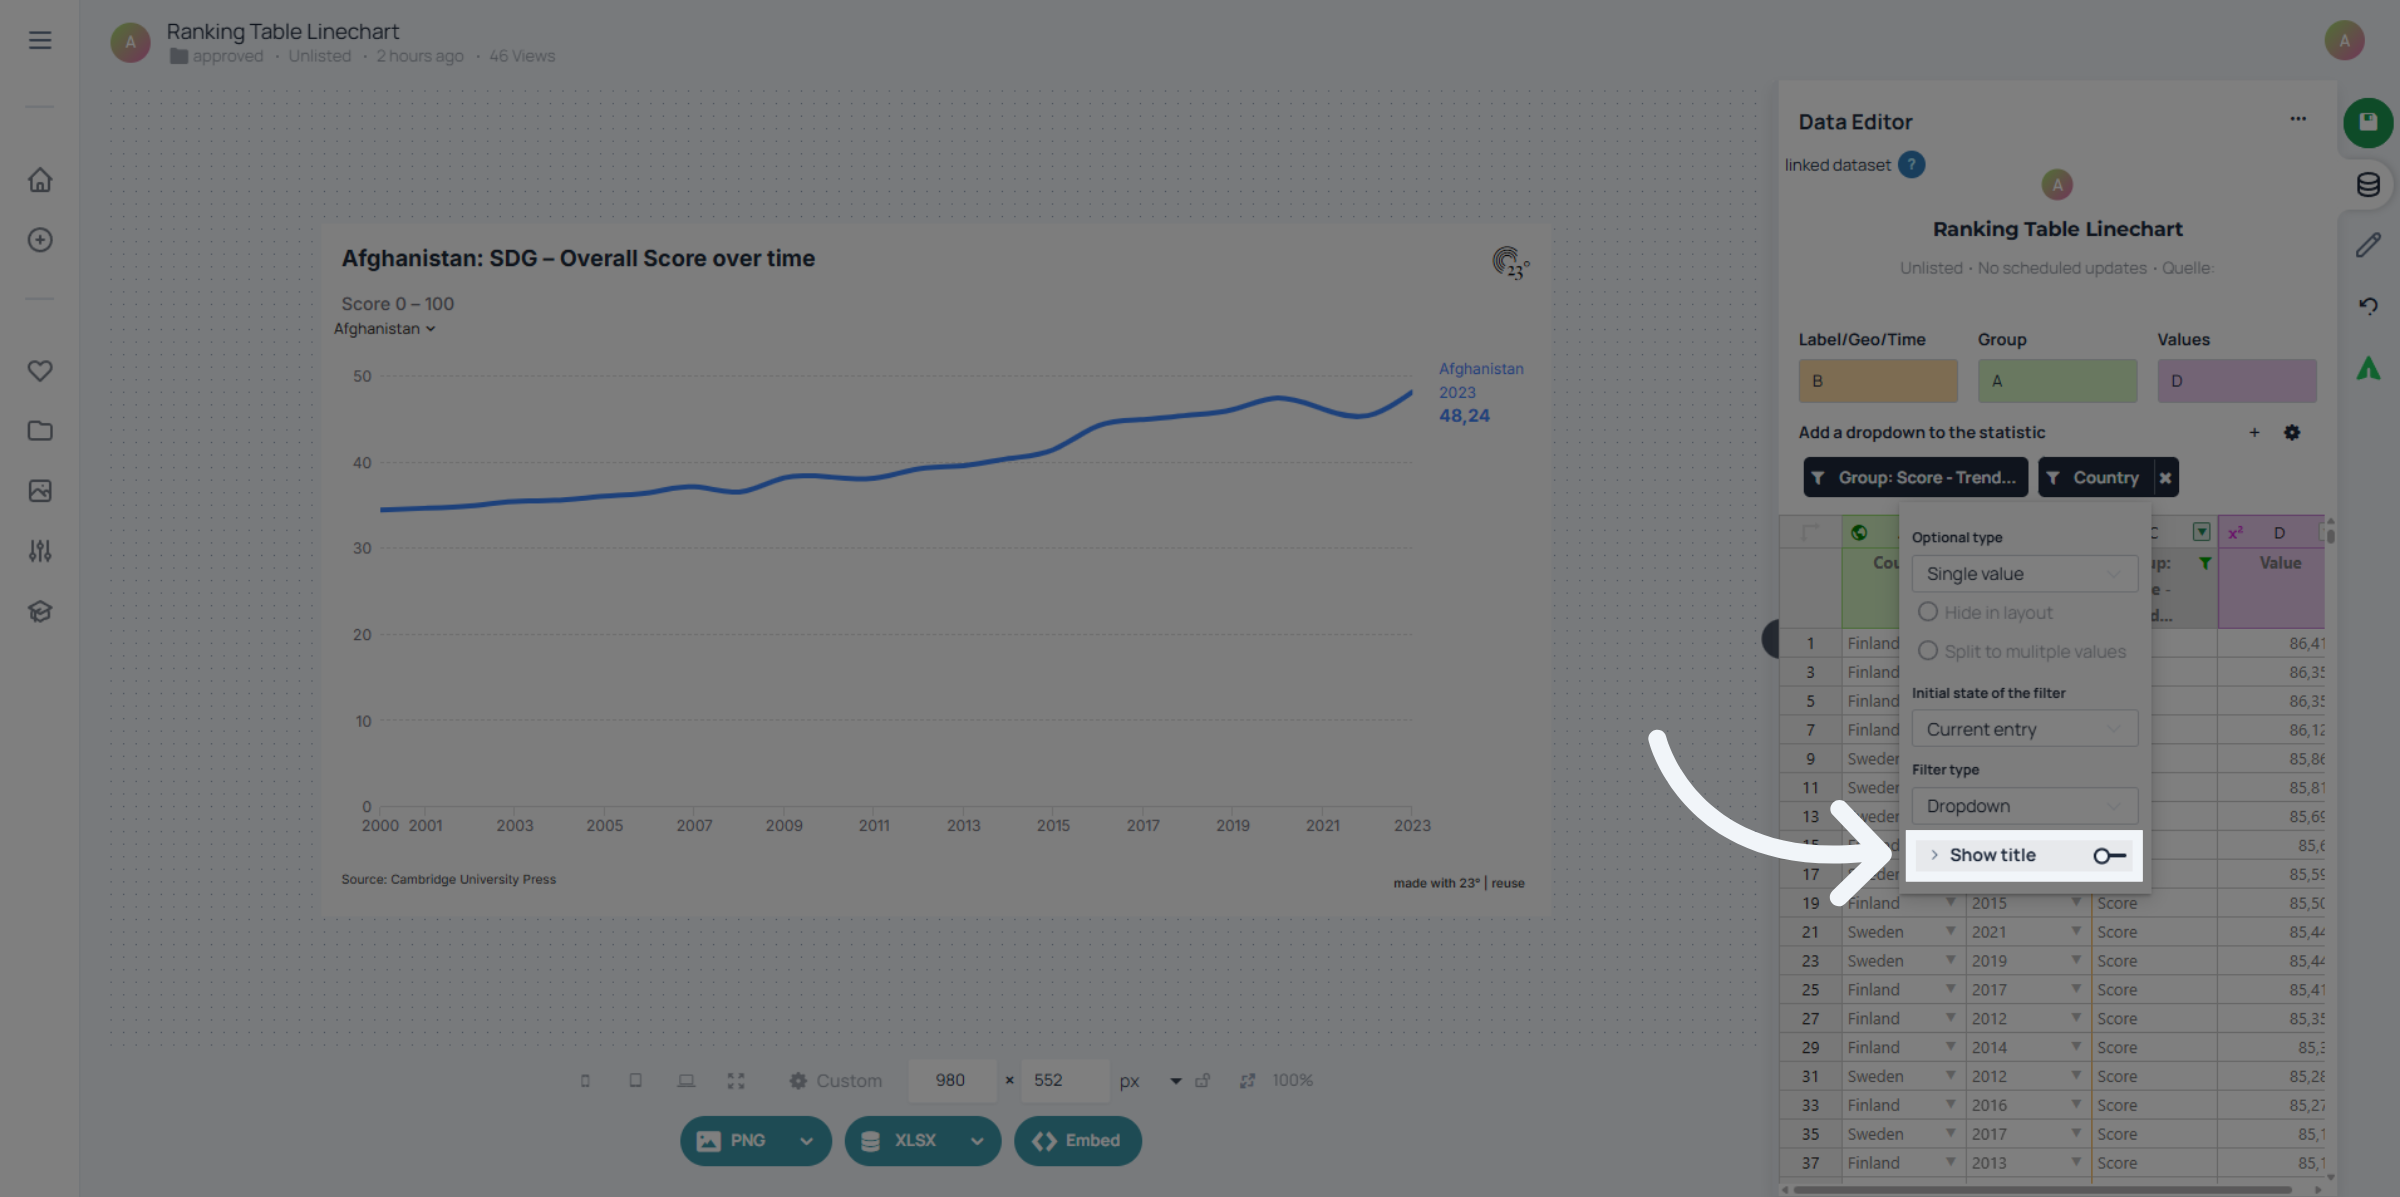
For single select filters you can also give your filter a title.
You have successfully configured dropdown filters for your chart in 23degrees. This setup allows you to refine chart data by country and control filter behavior for precise data analysis.