How to add custom areas to Line Chart
This tutorial guides you through adding areas to your linechart to highlight specific time periods.
You will learn how to define date ranges, label them, and customize their appearance for better data visualization.
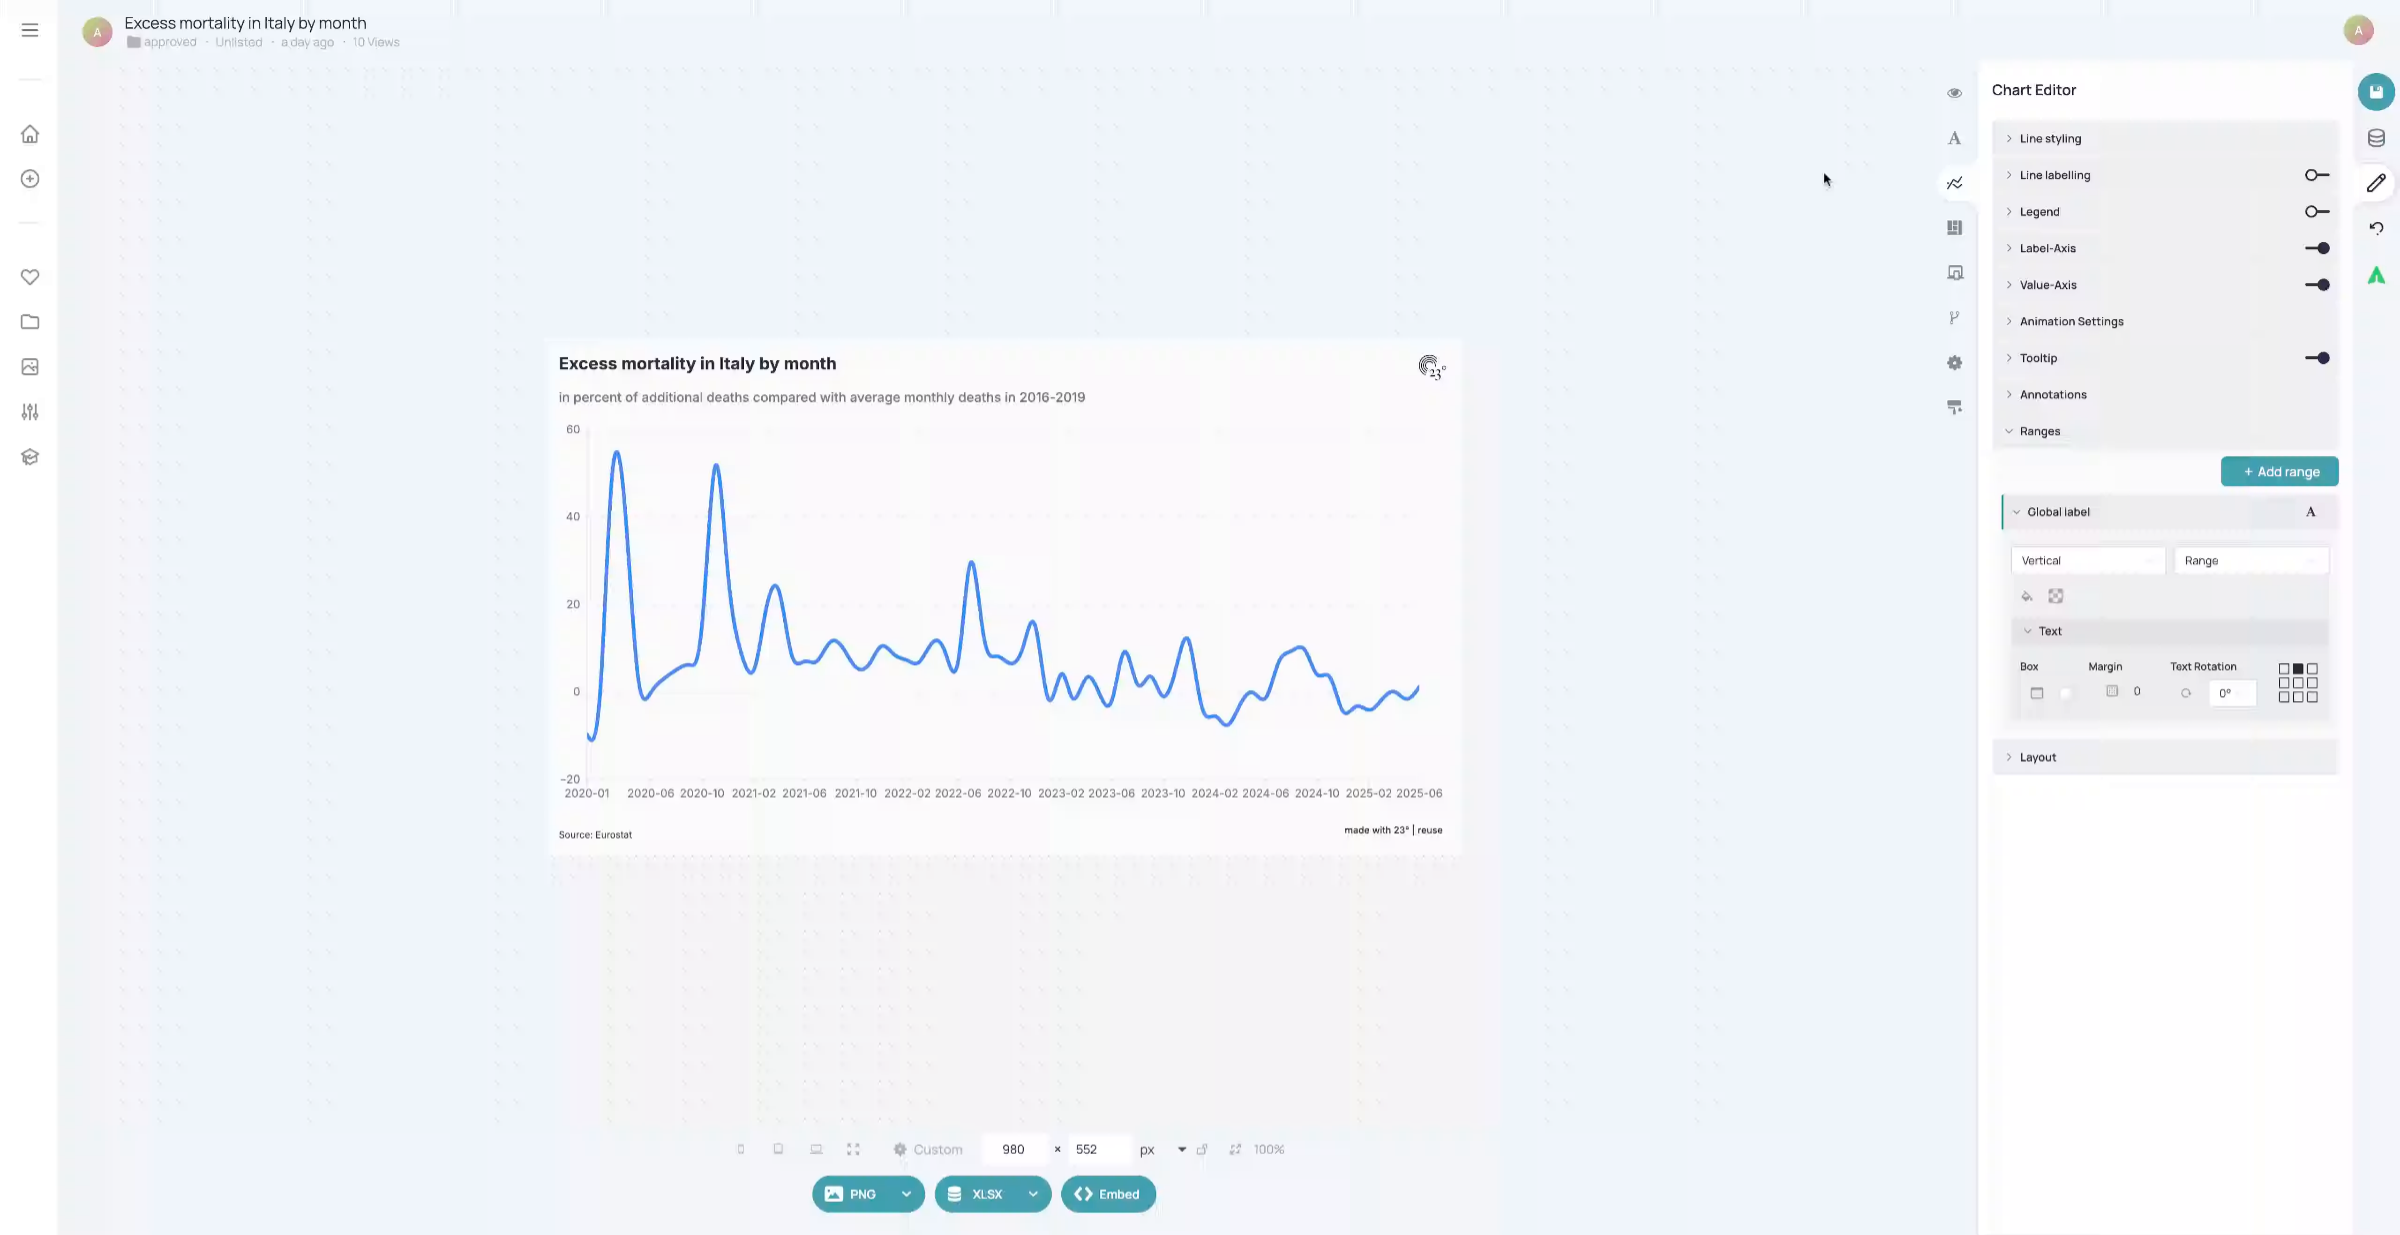
Click the settings option to modify chart features.
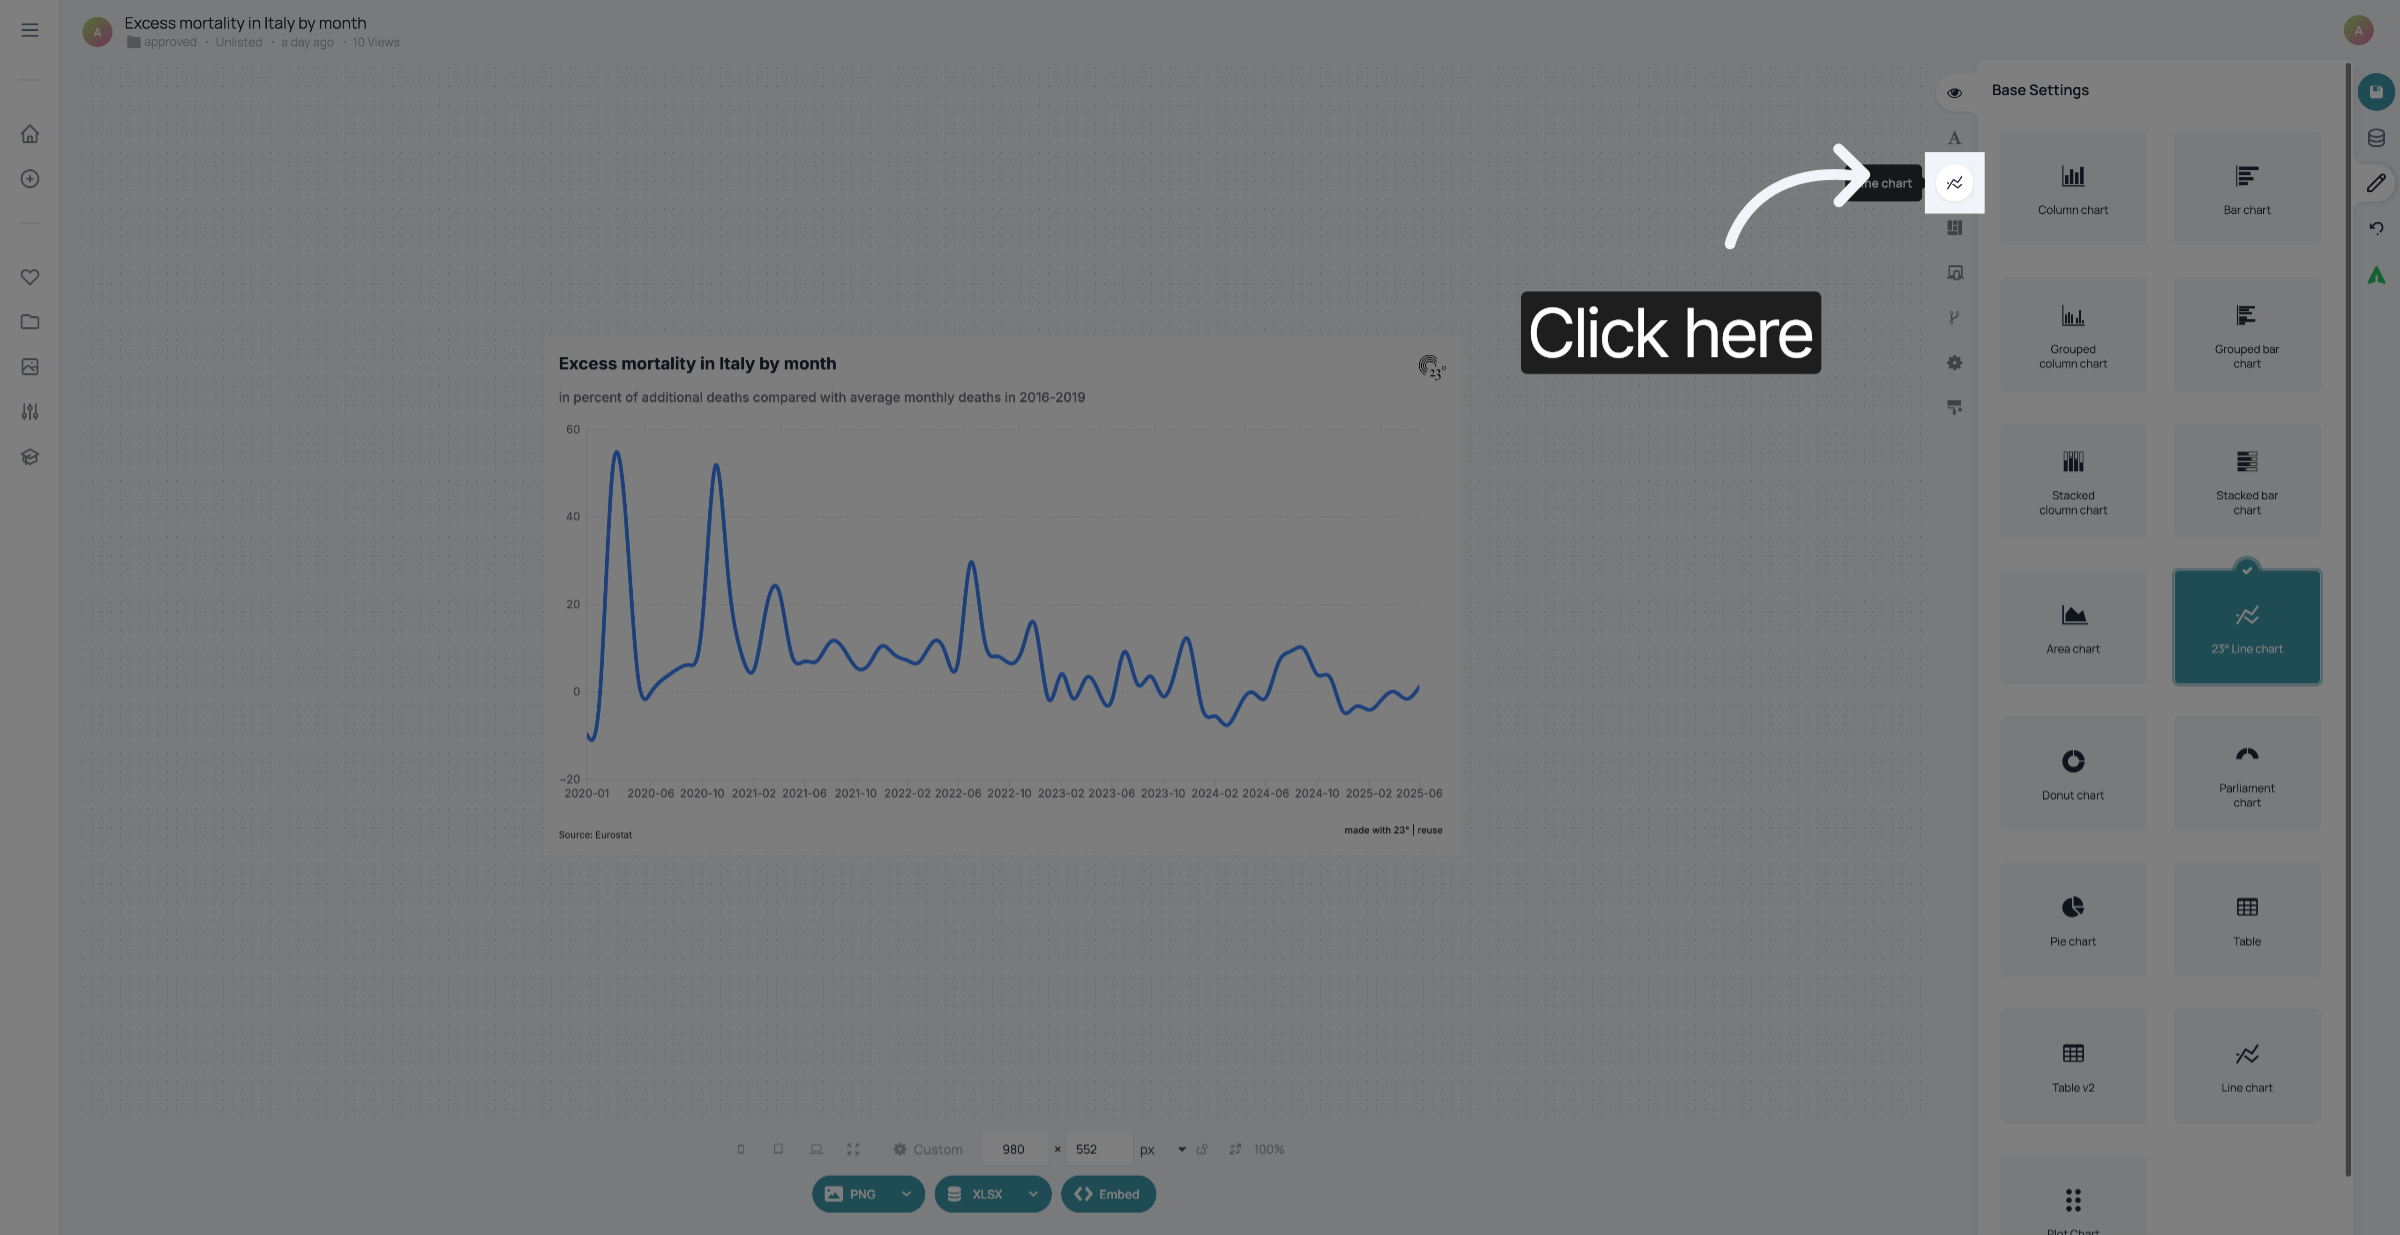
Click the area configuration tab to add new areas.
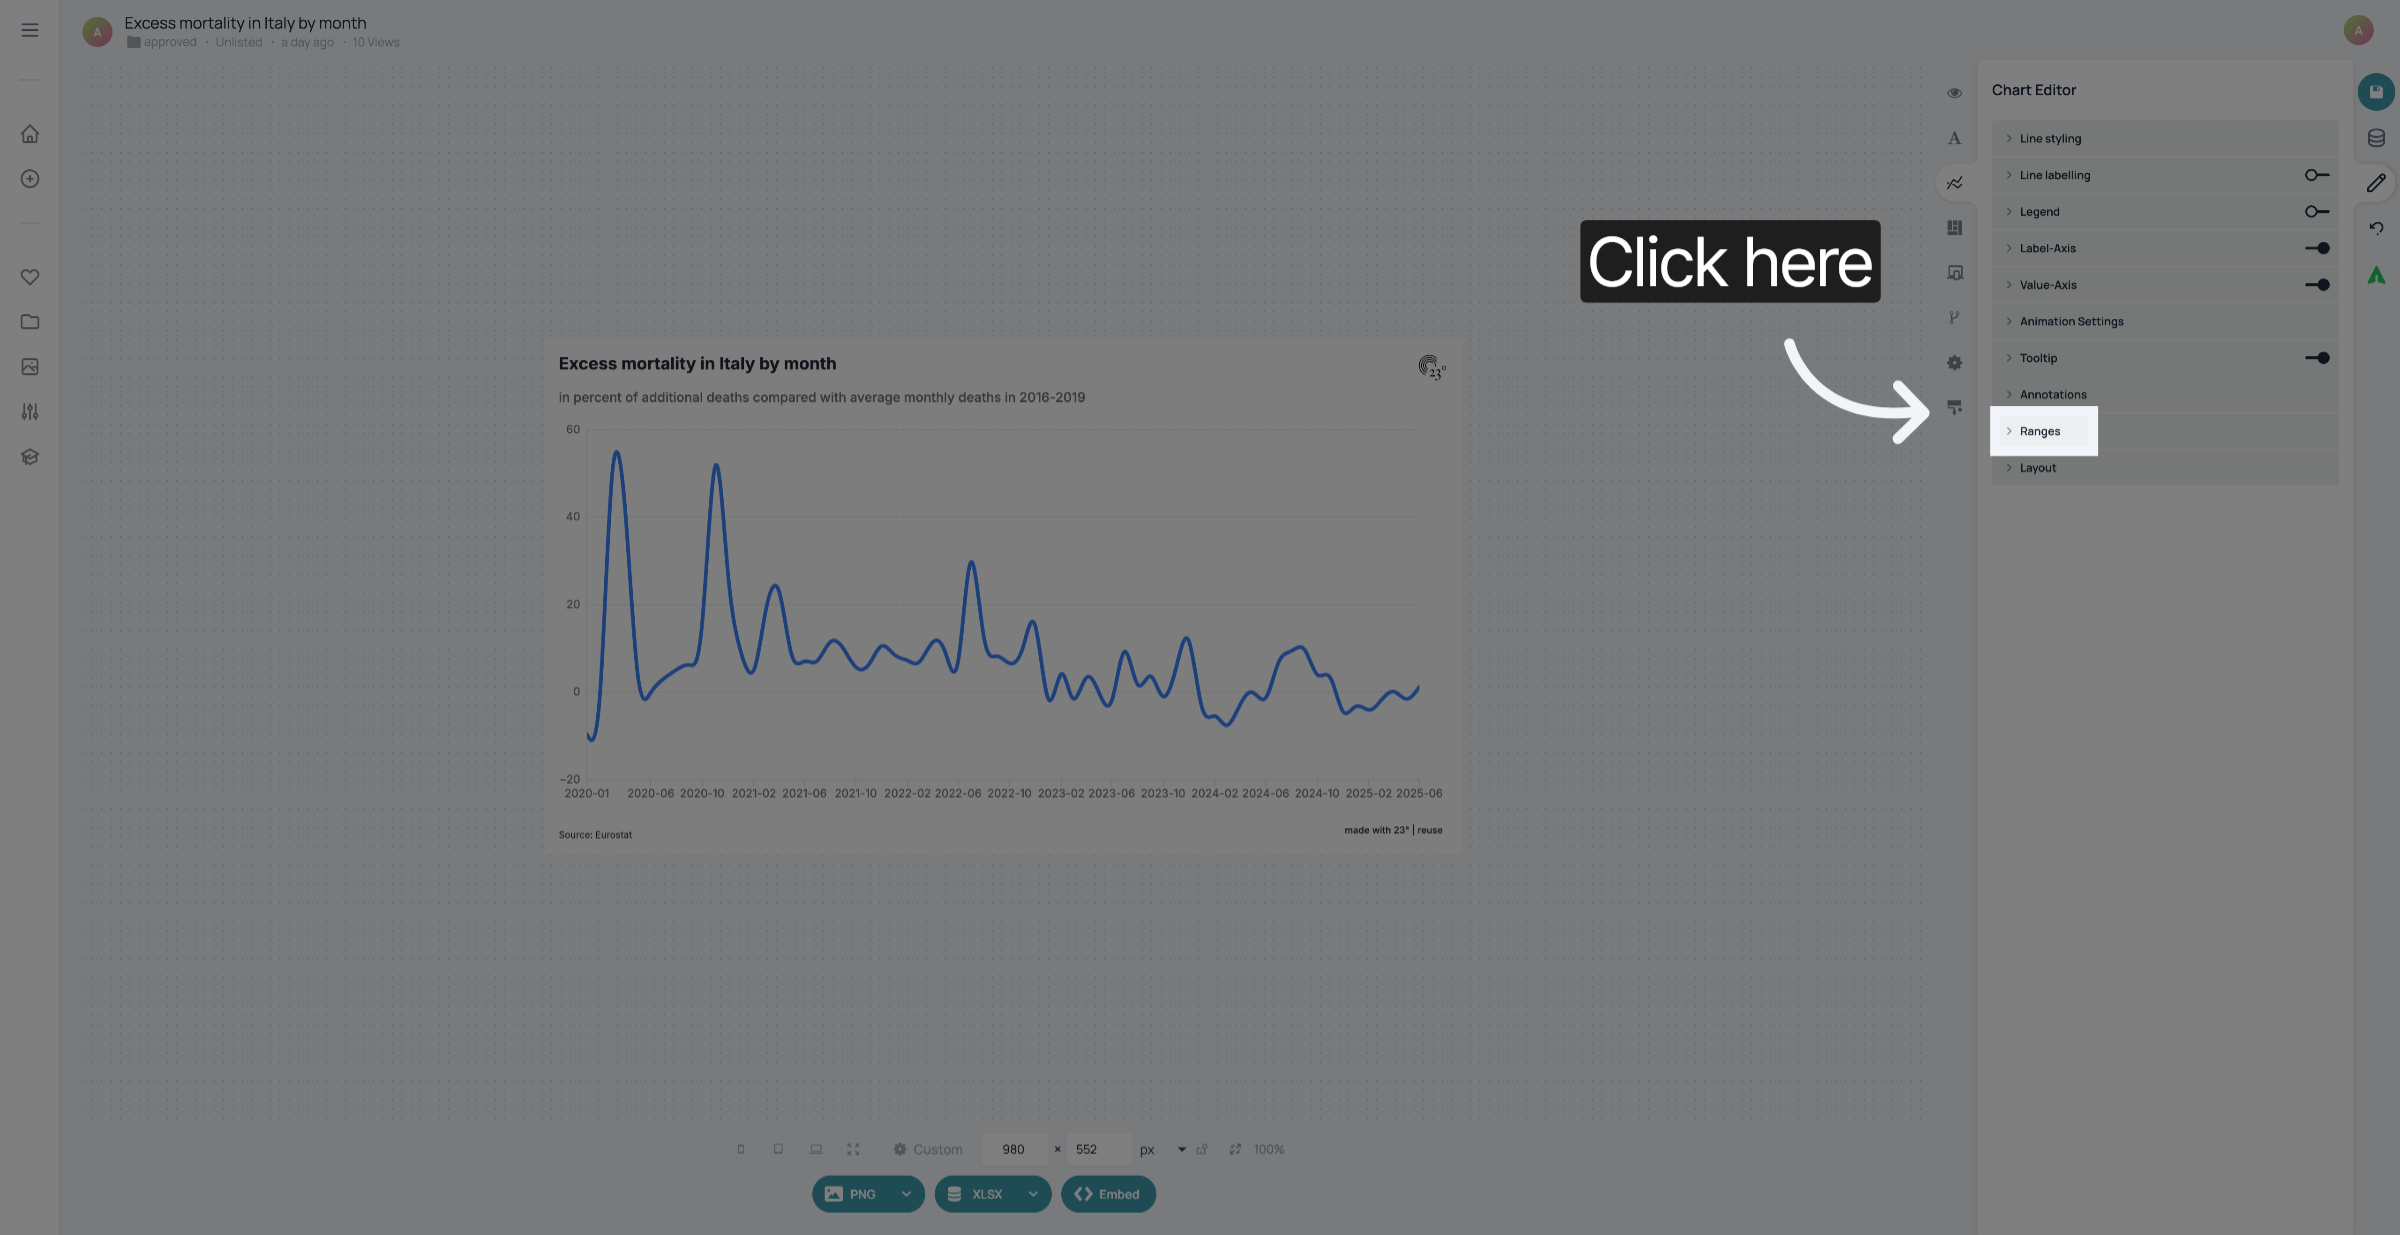
Click "Add range" to start defining a new area on your linechart.
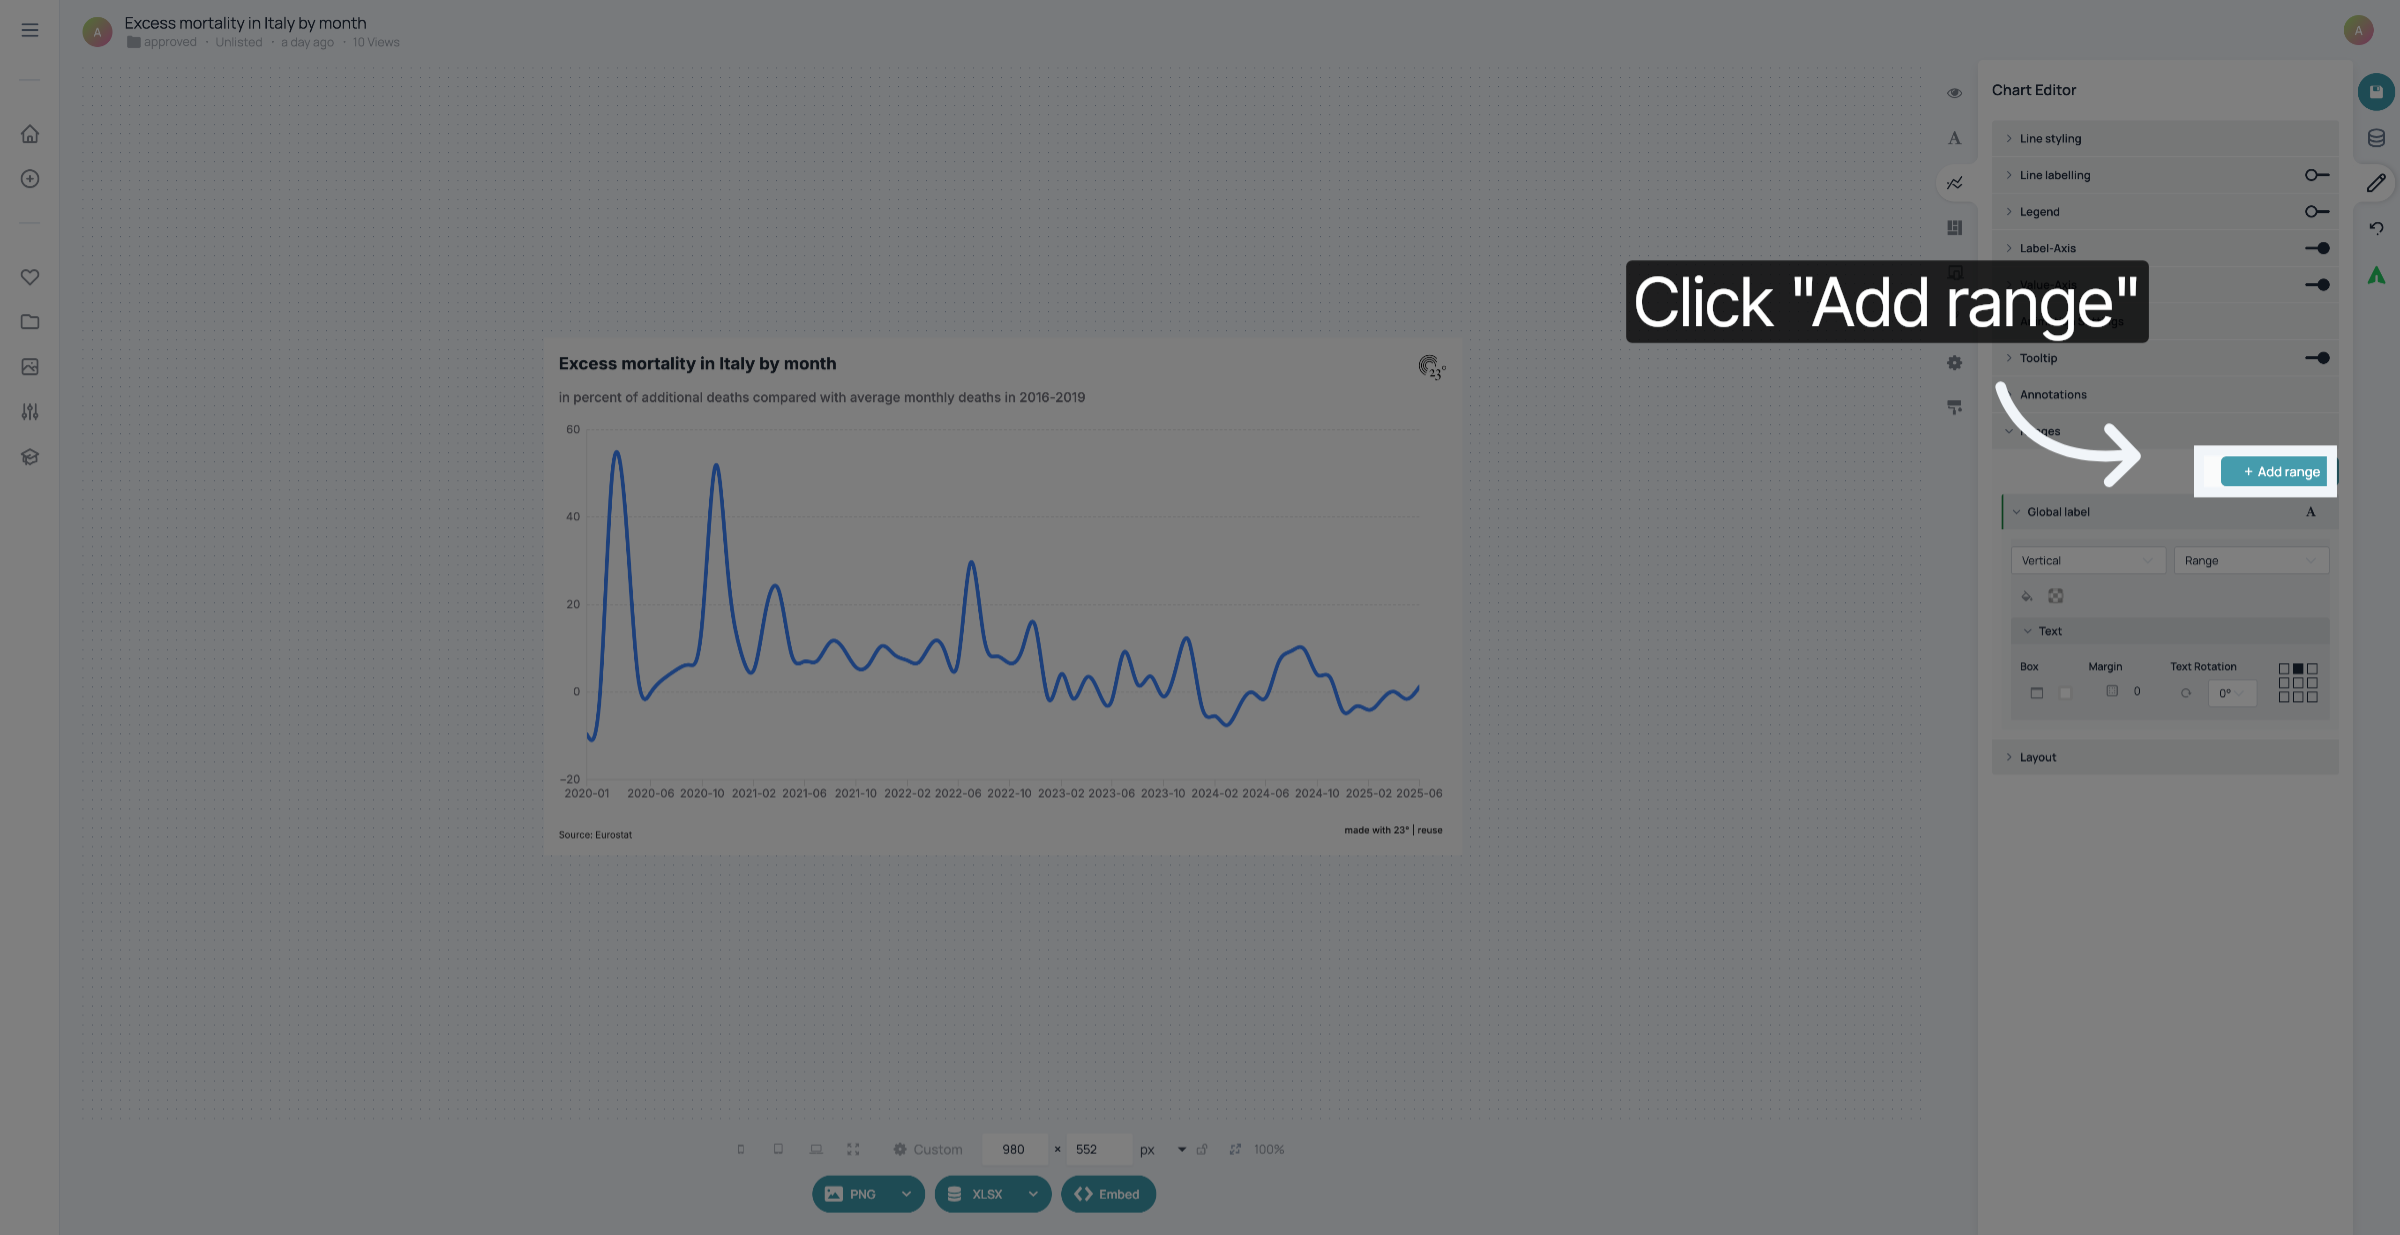
Click the range selector to specify the time period for the area.
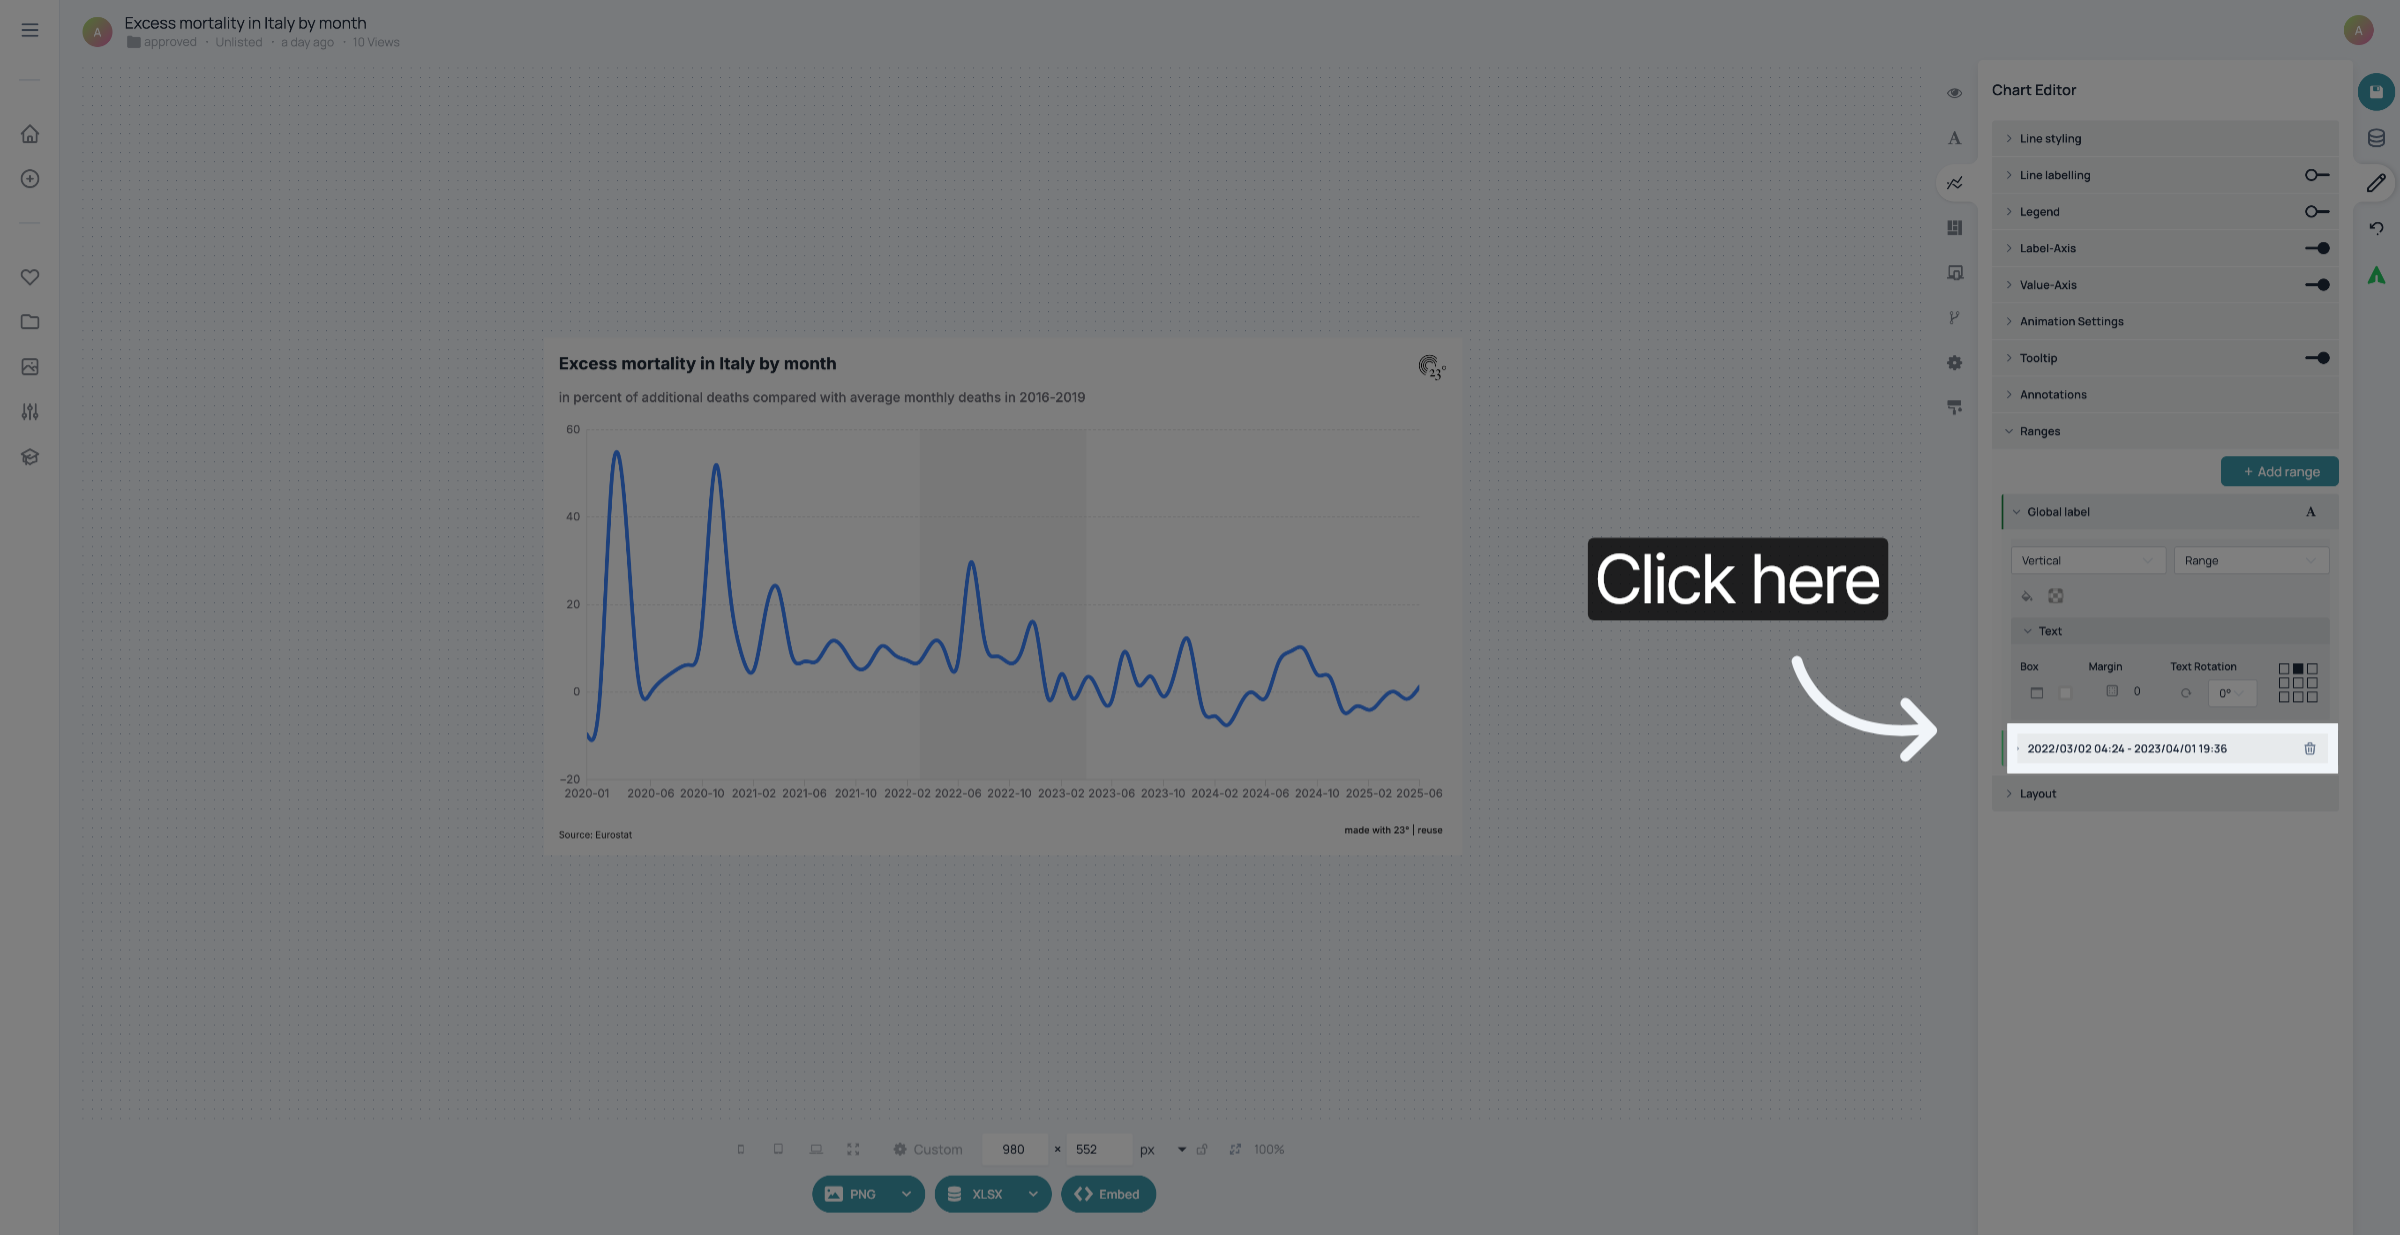
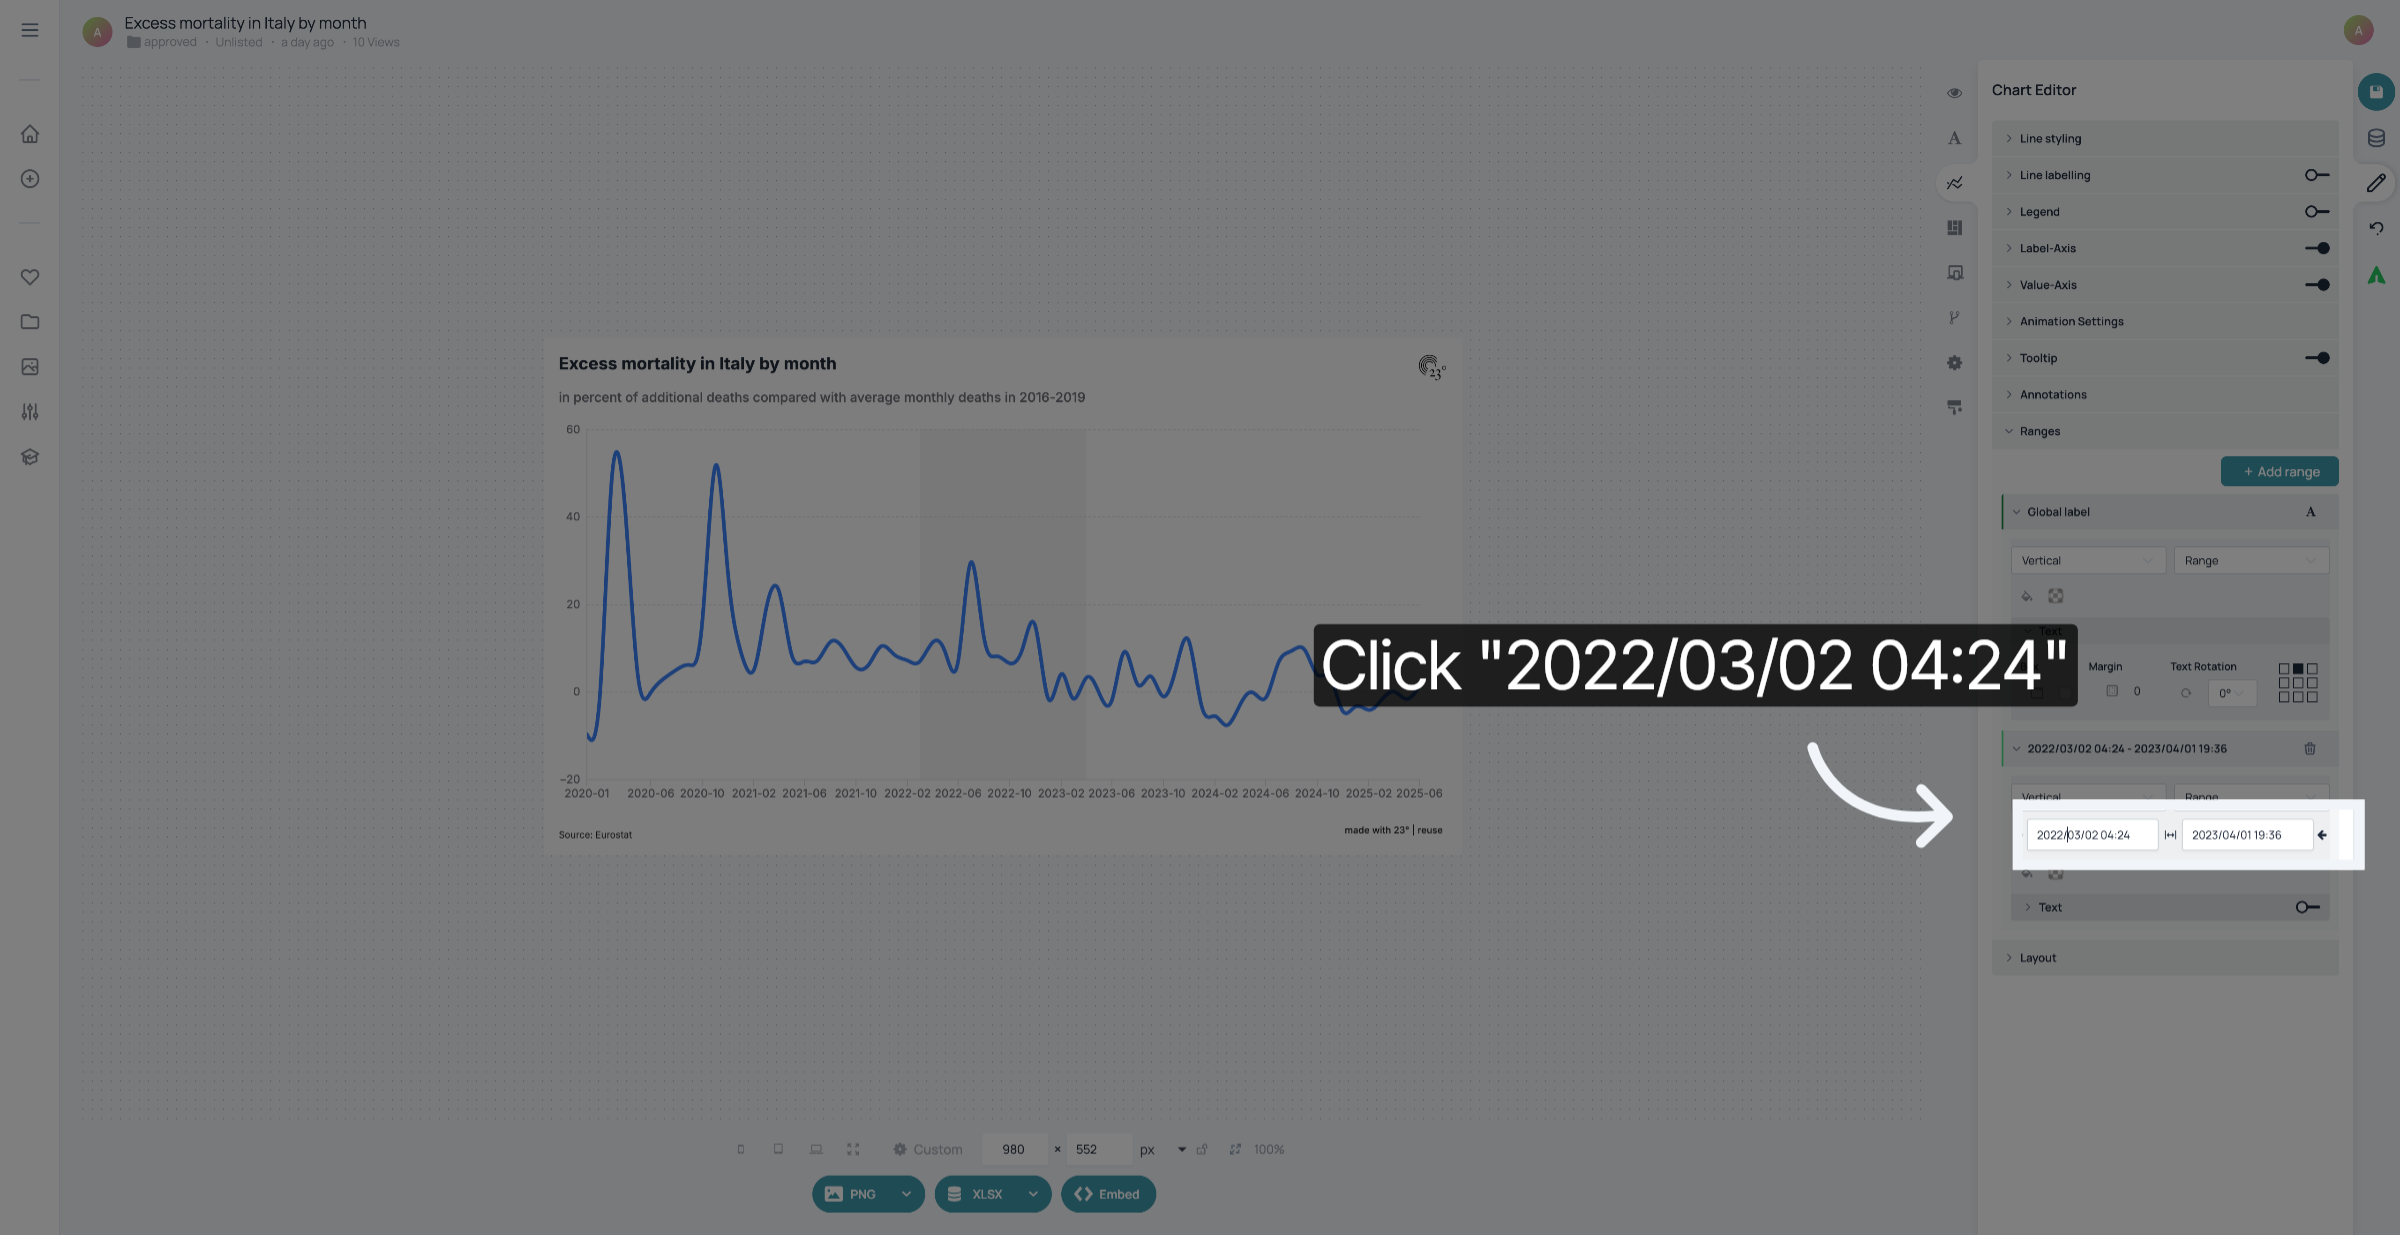
Click the start date to set the beginning of the range.
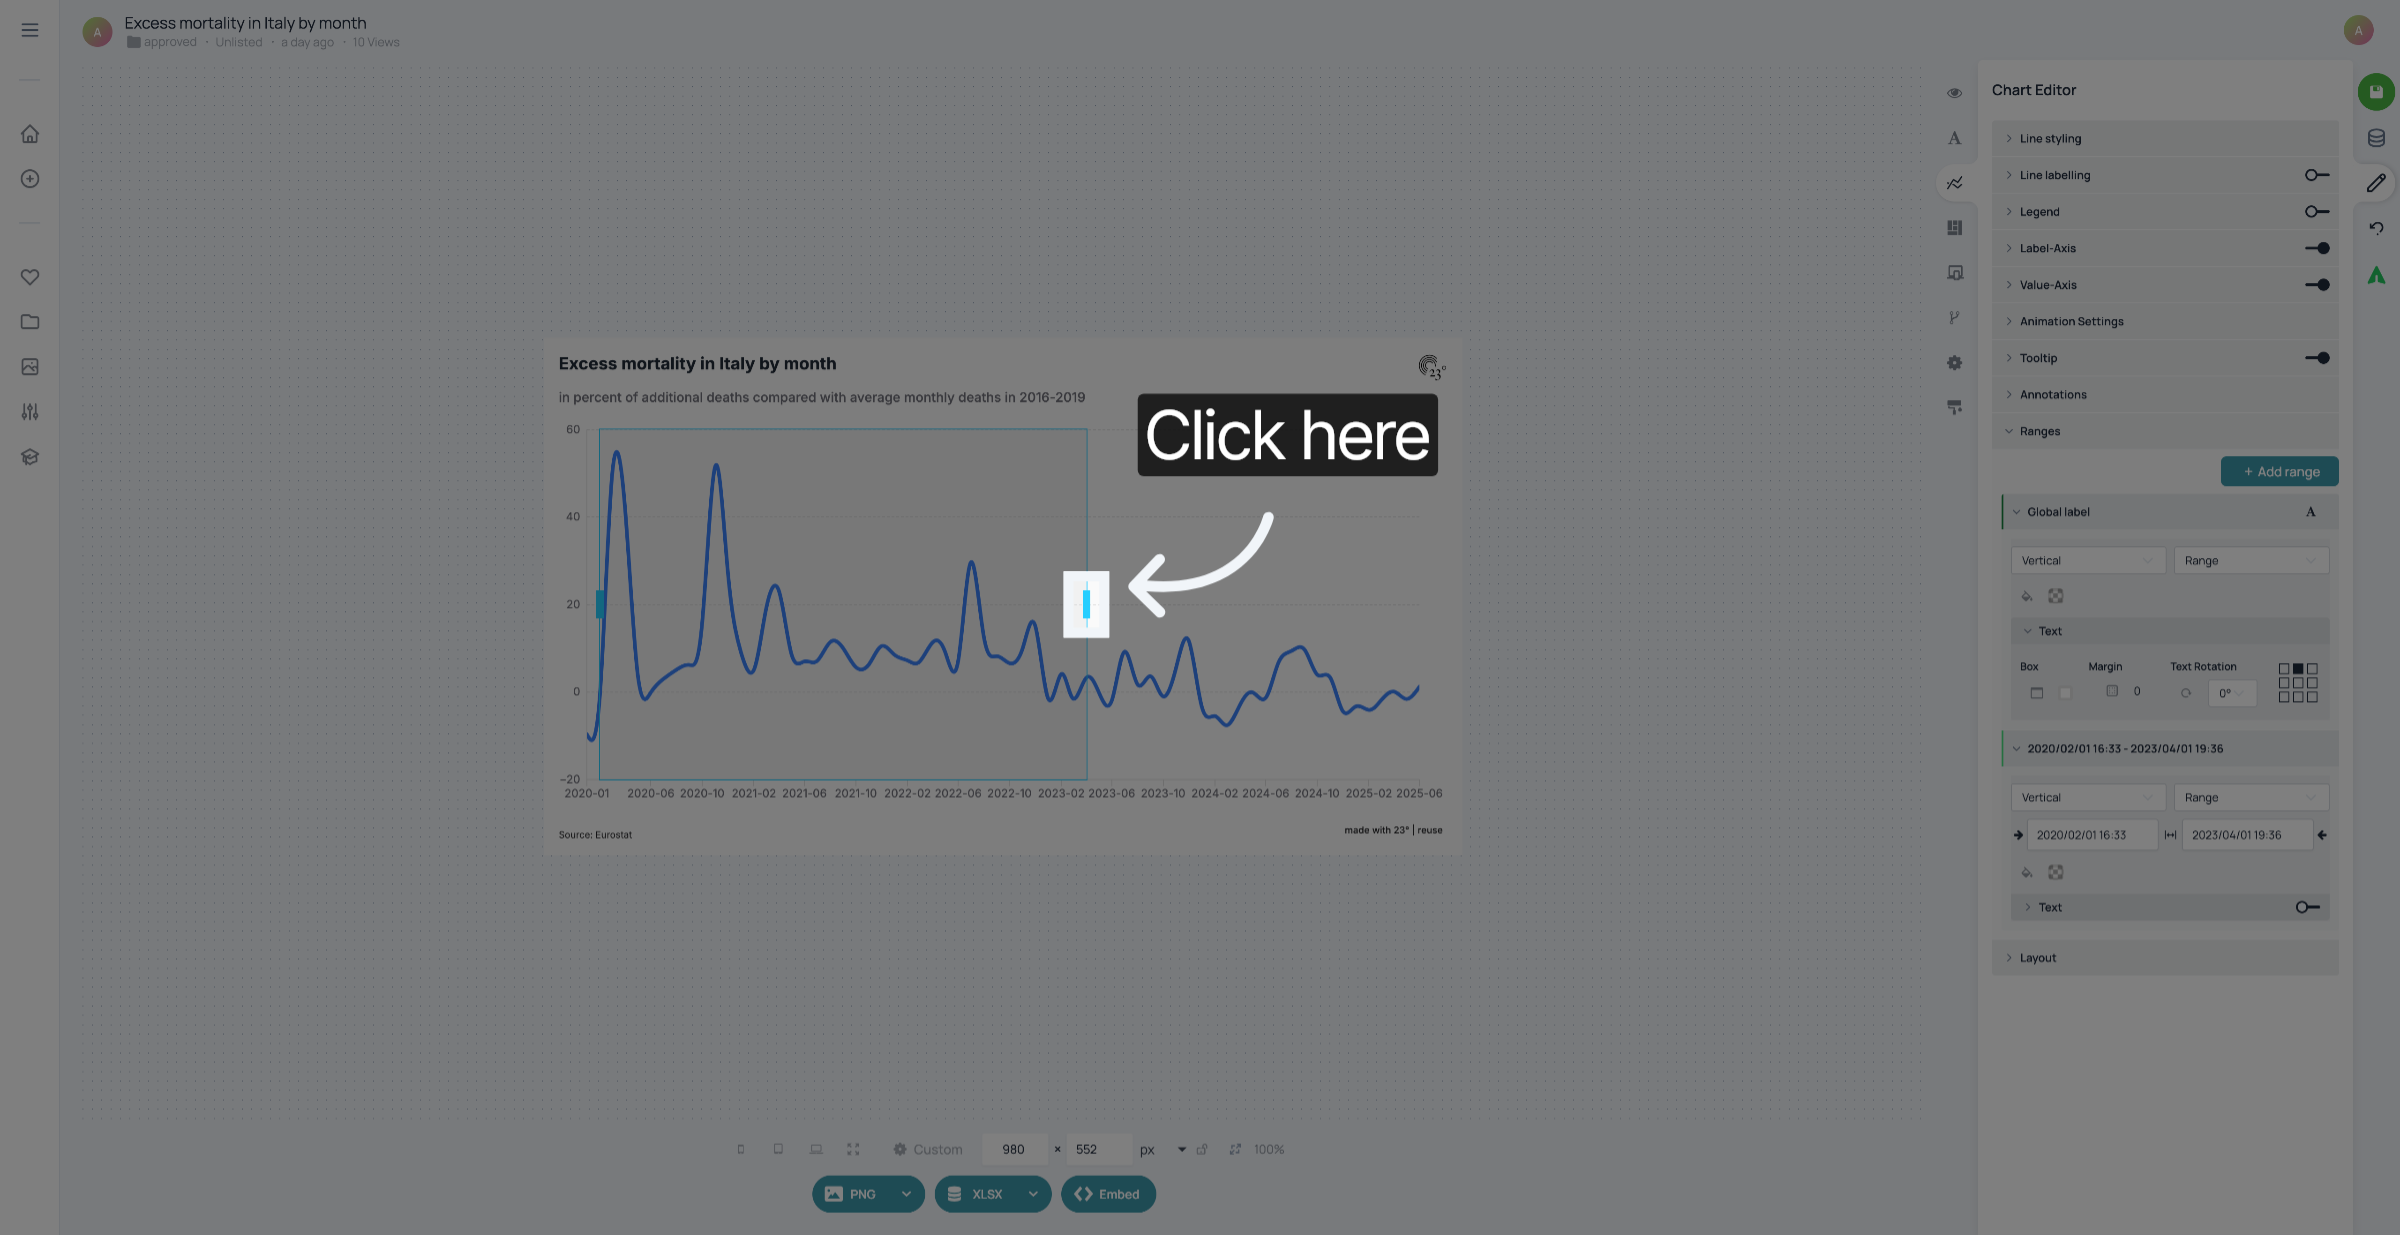
Click to enable text display on the selected range.
Click "Text" to configure the label for the area.
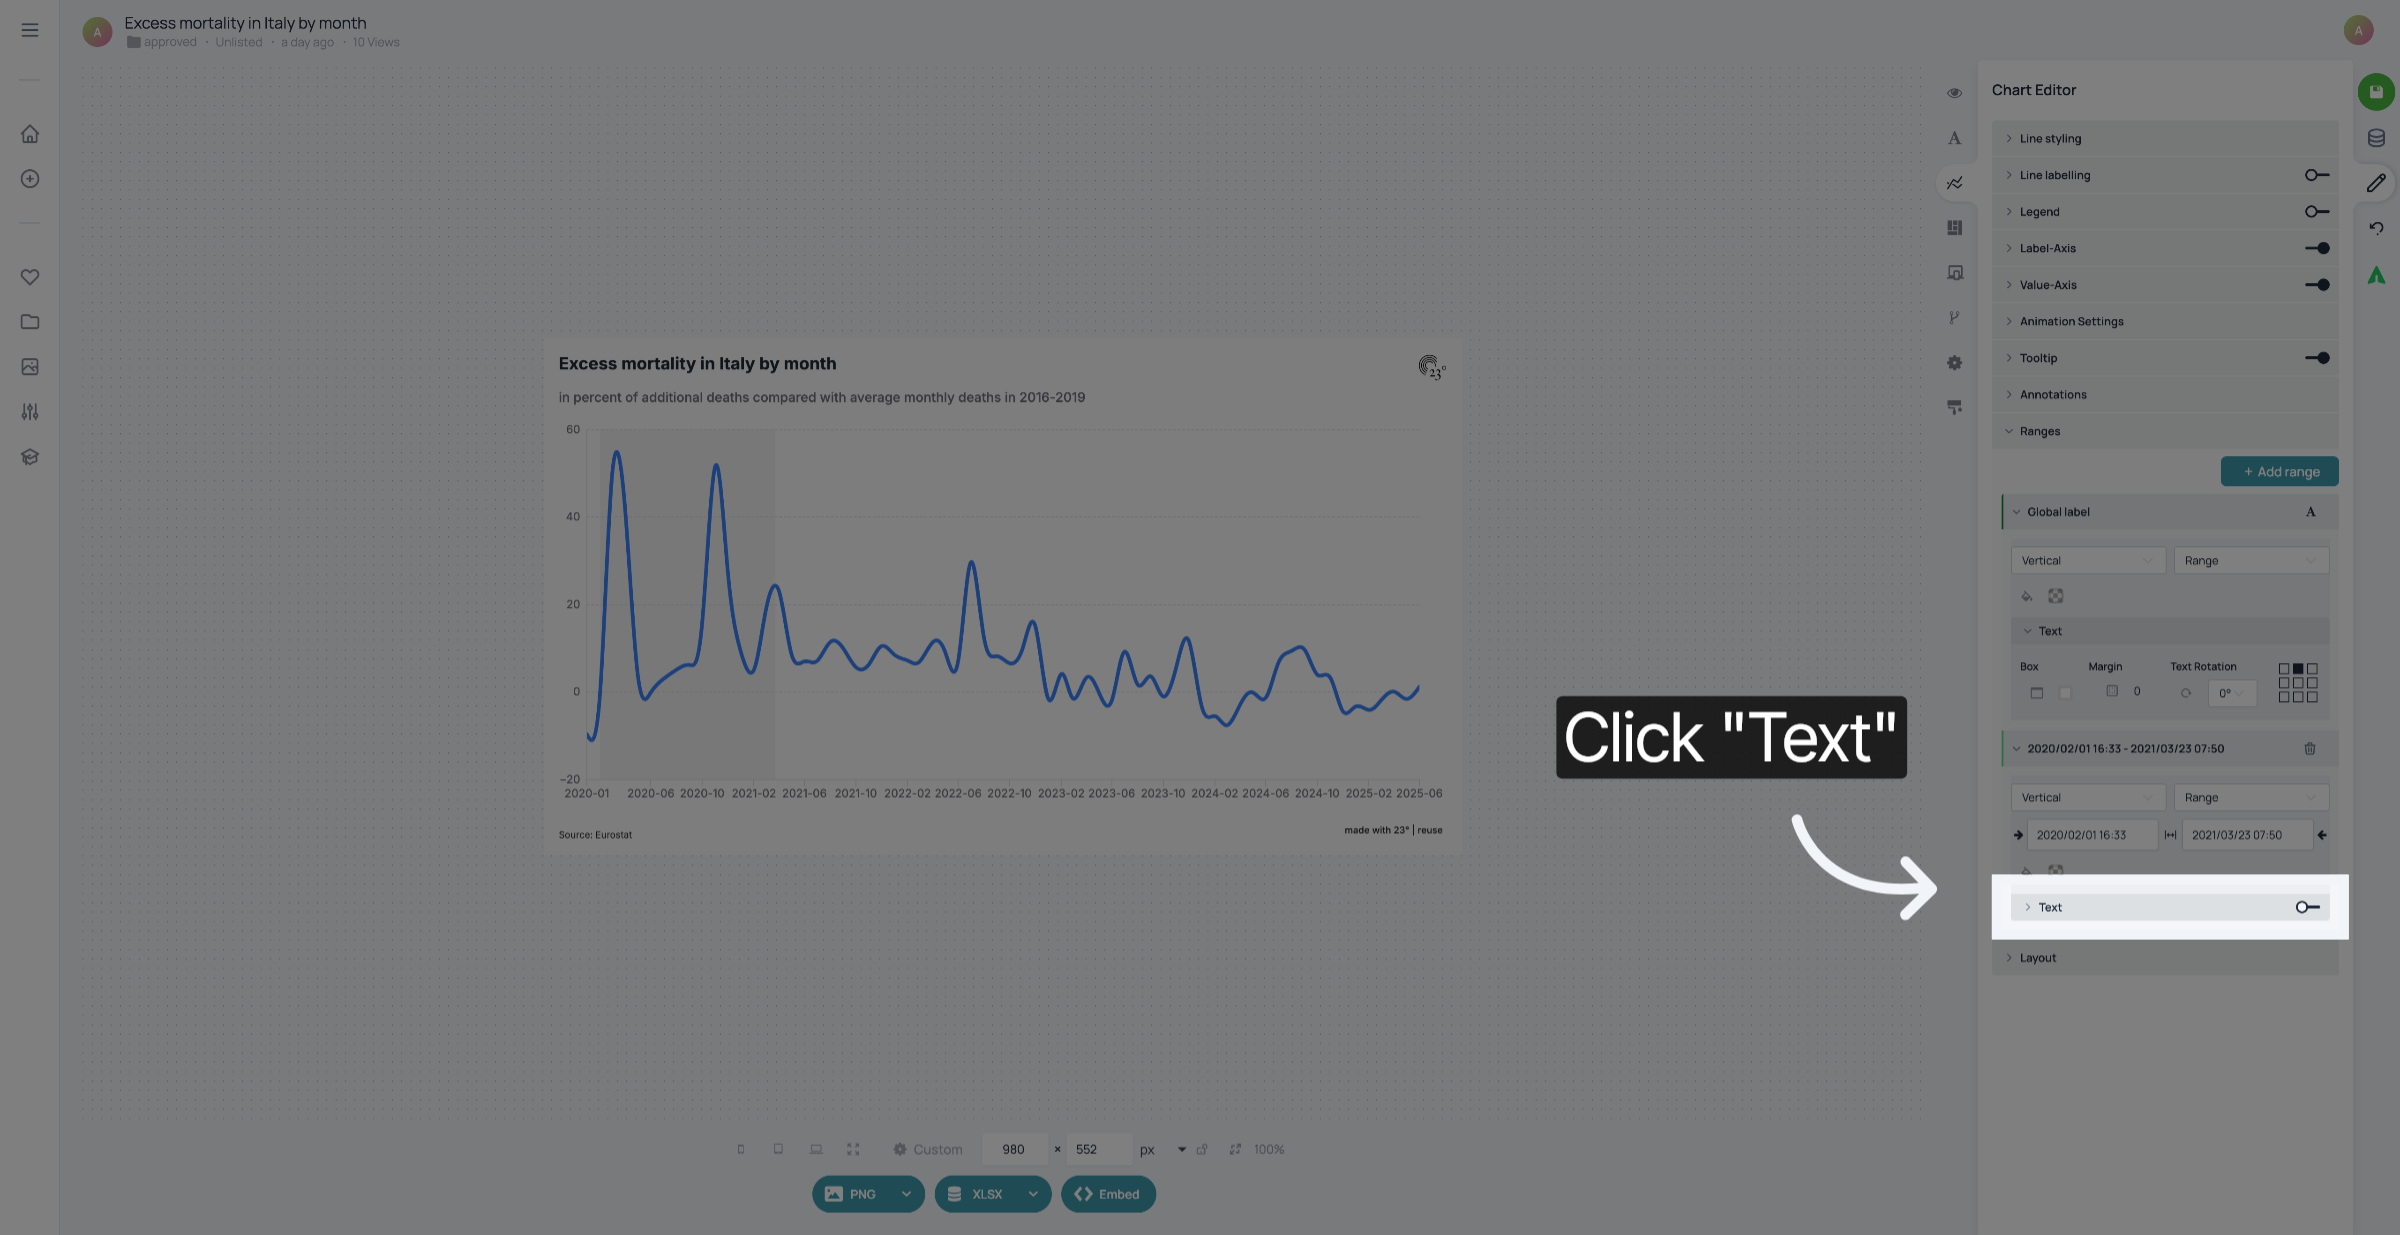
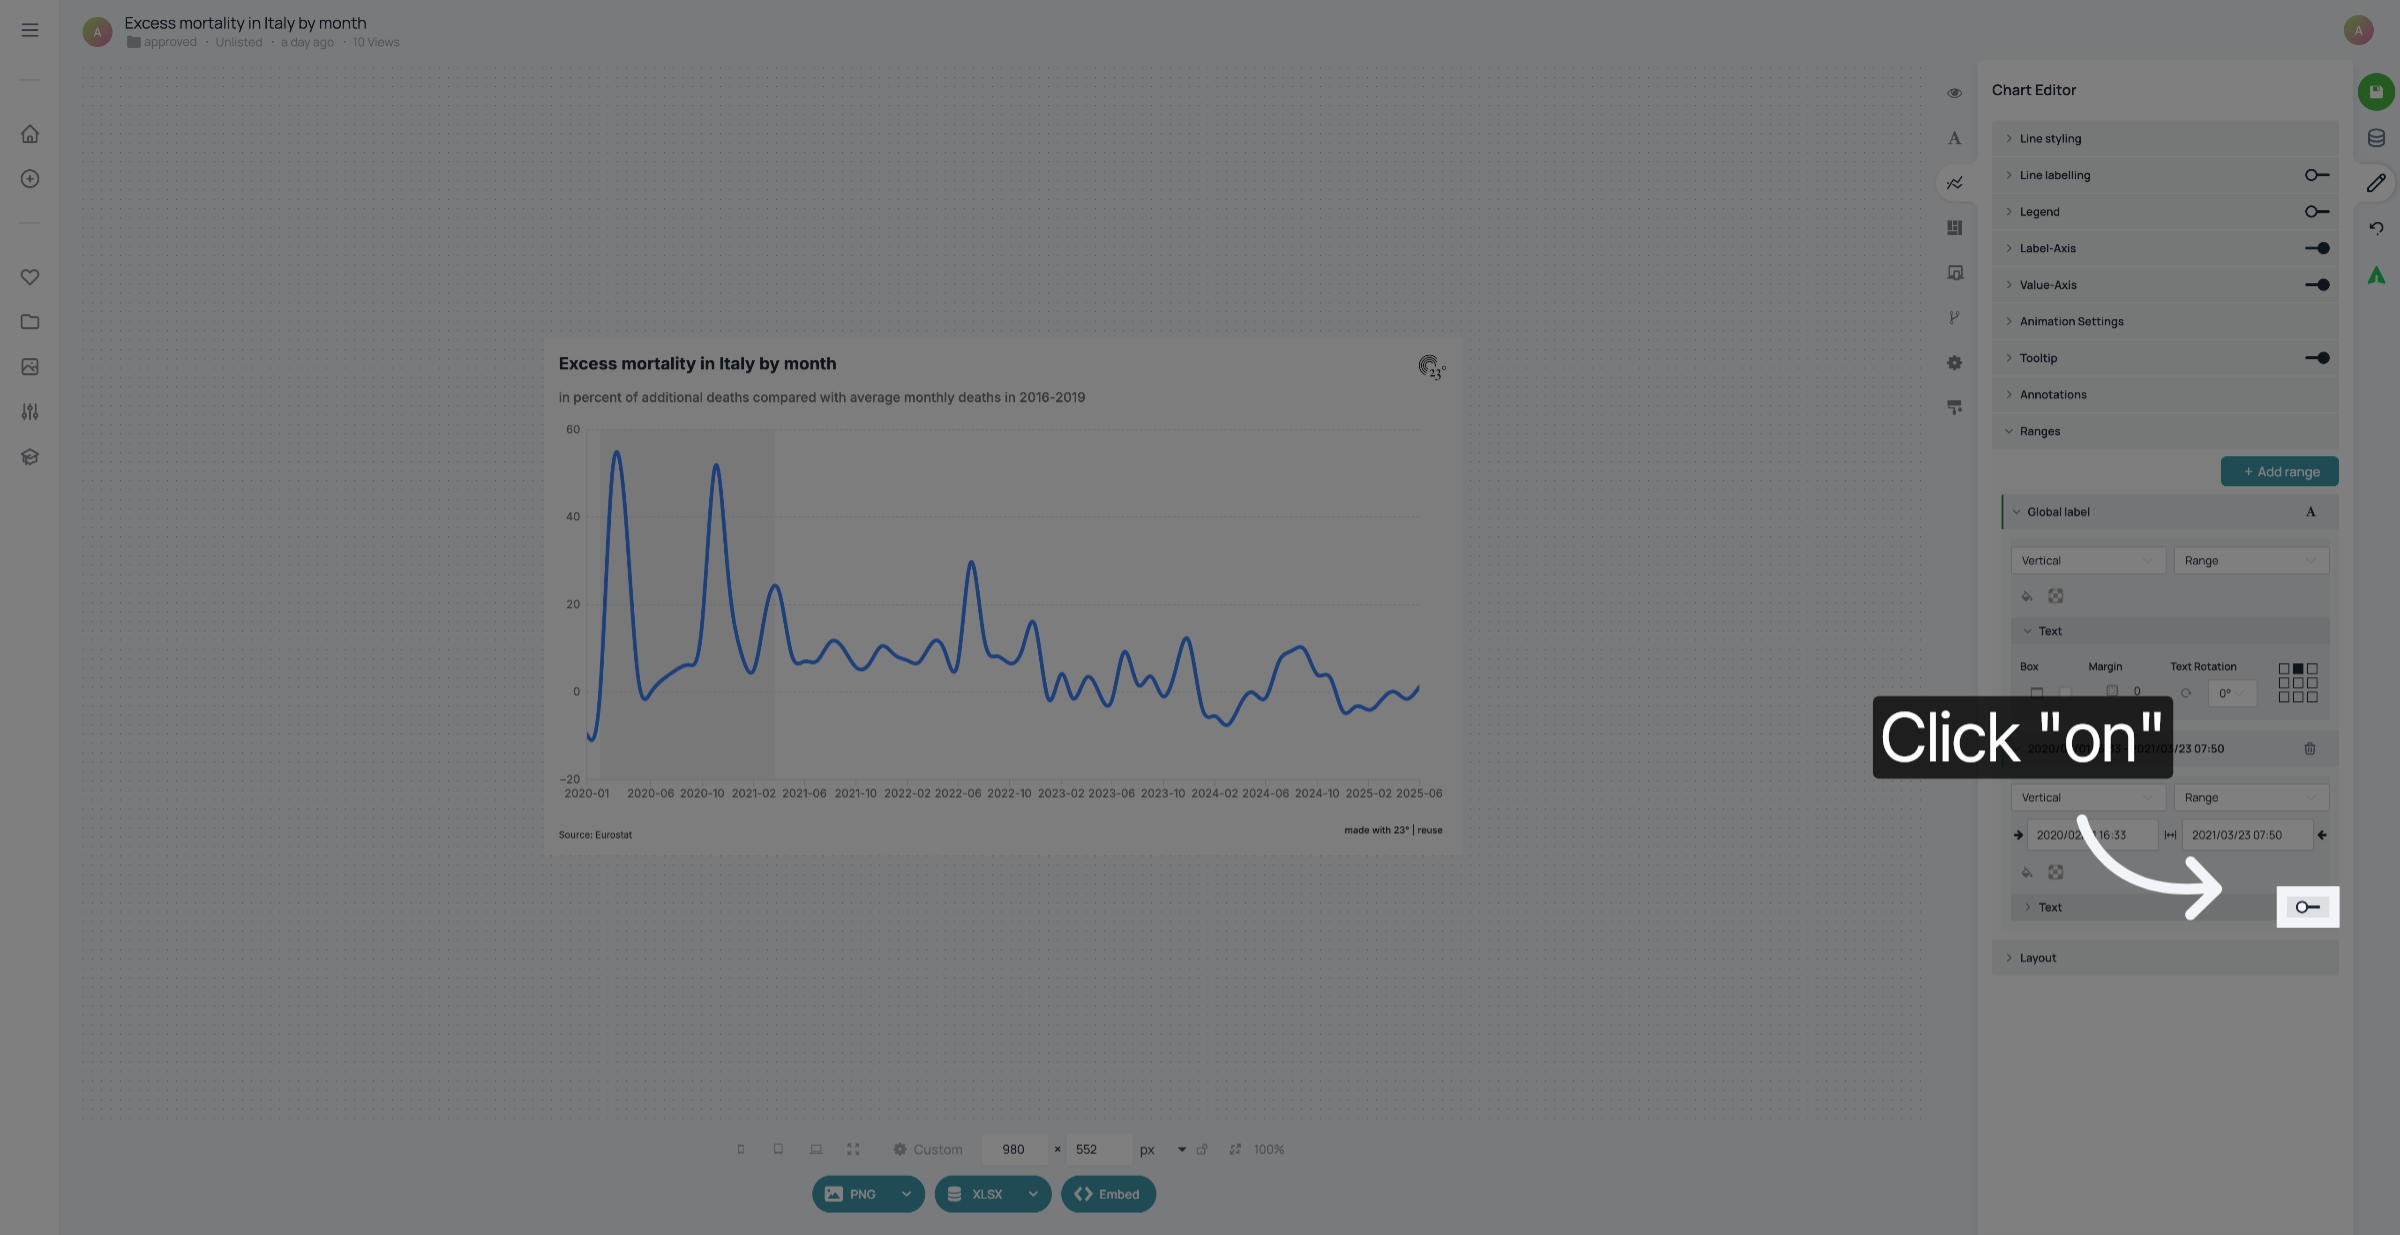
Click "on" to activate the text label visibility.
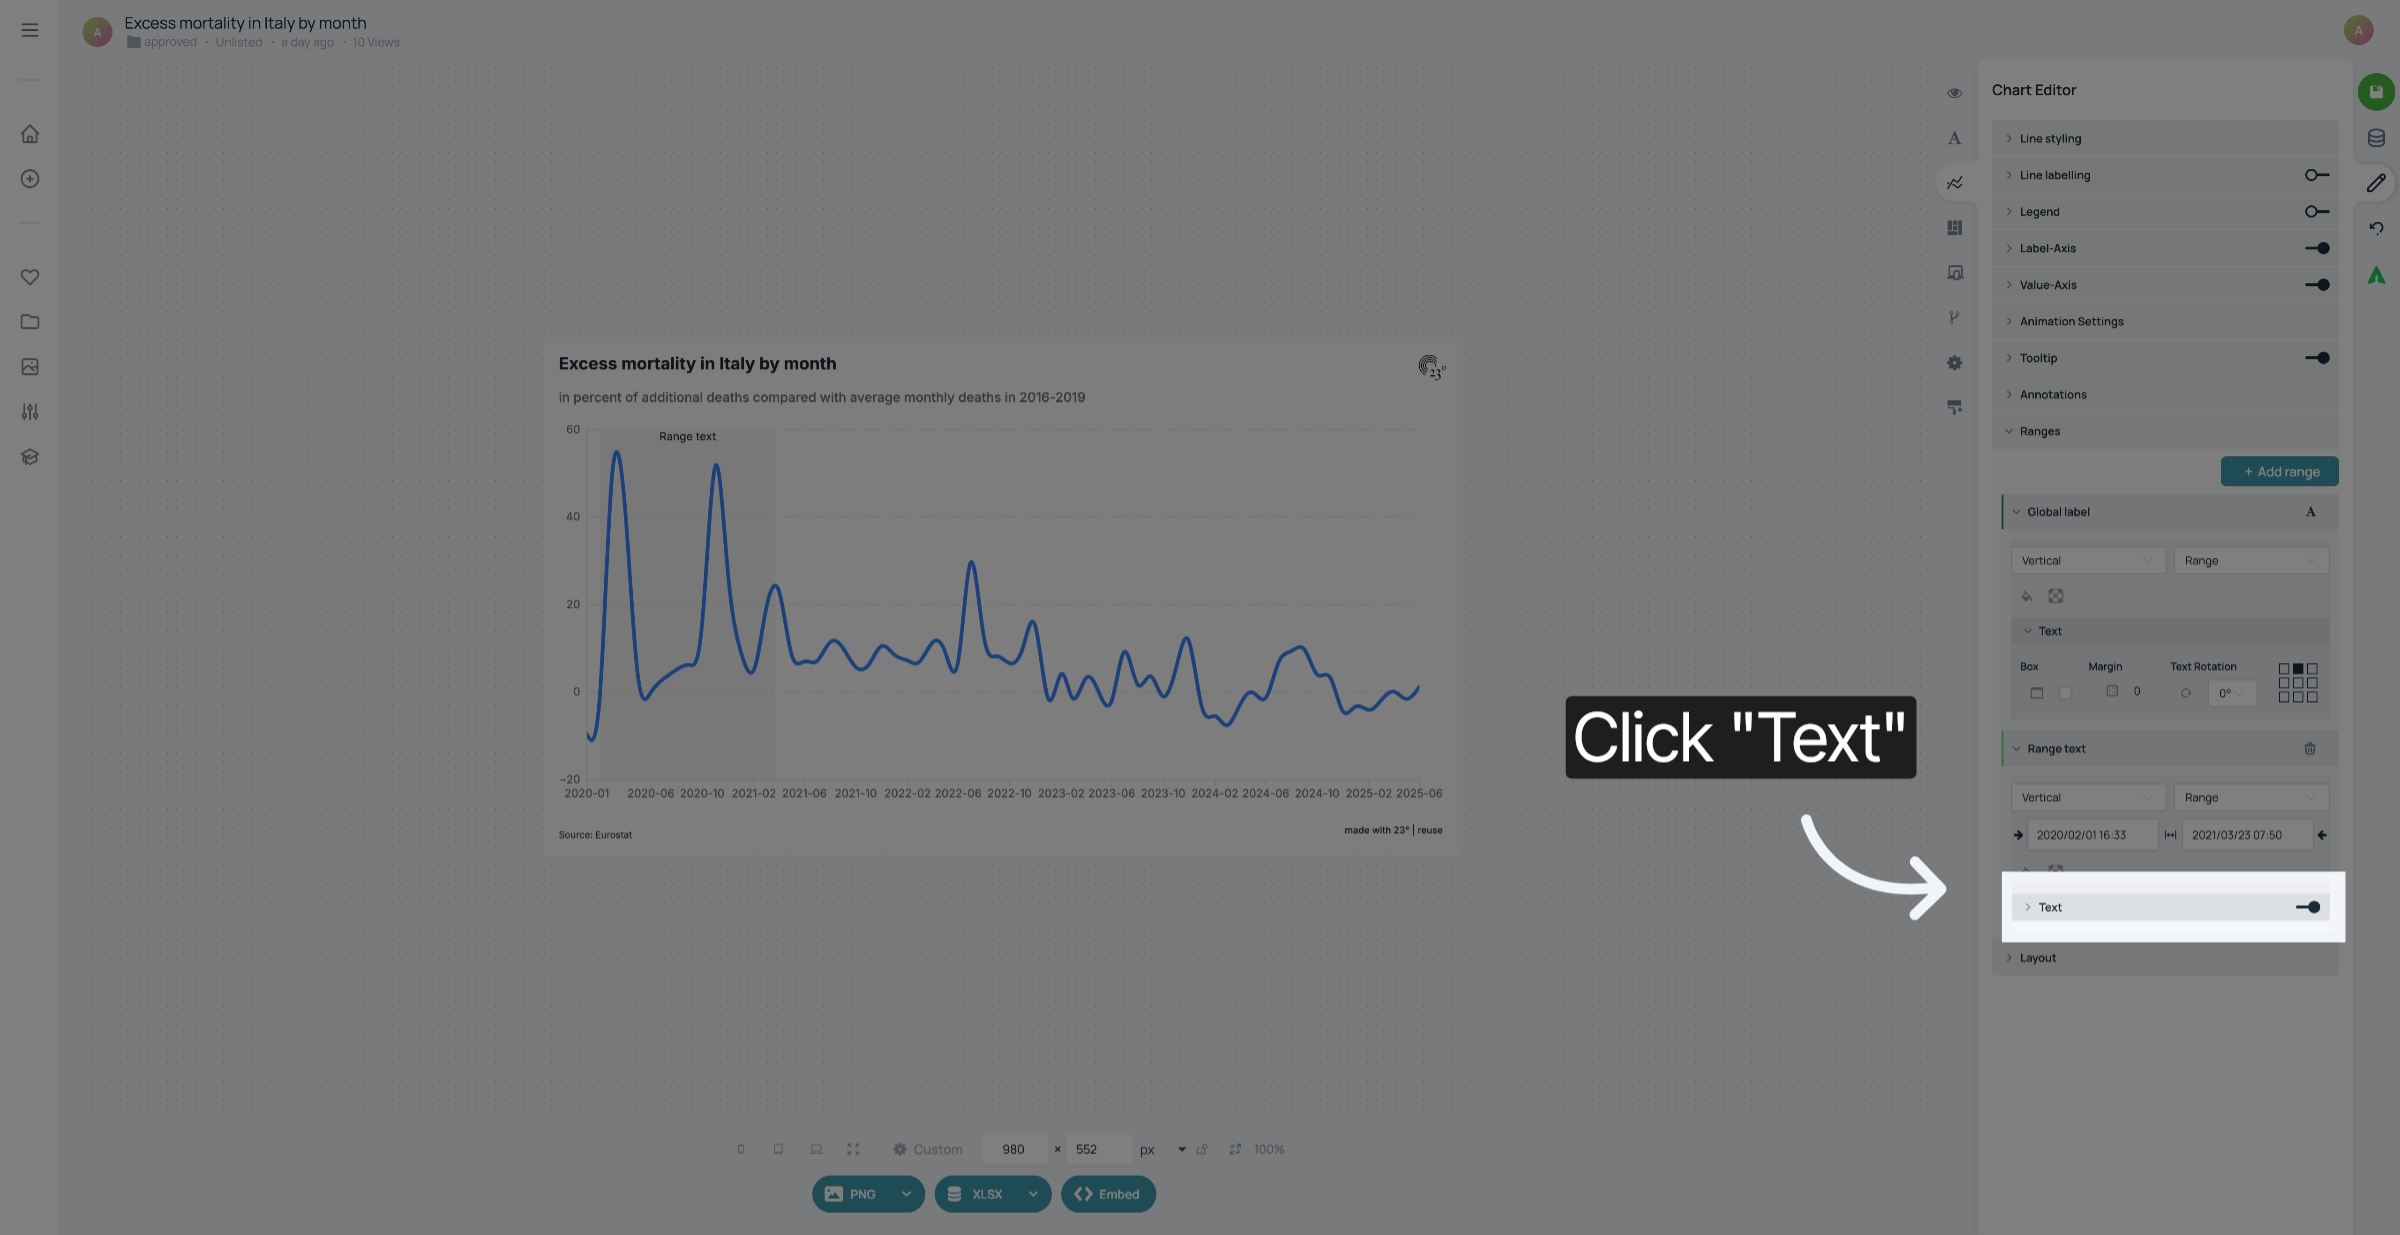
Click "Text" again to adjust the range text properties.
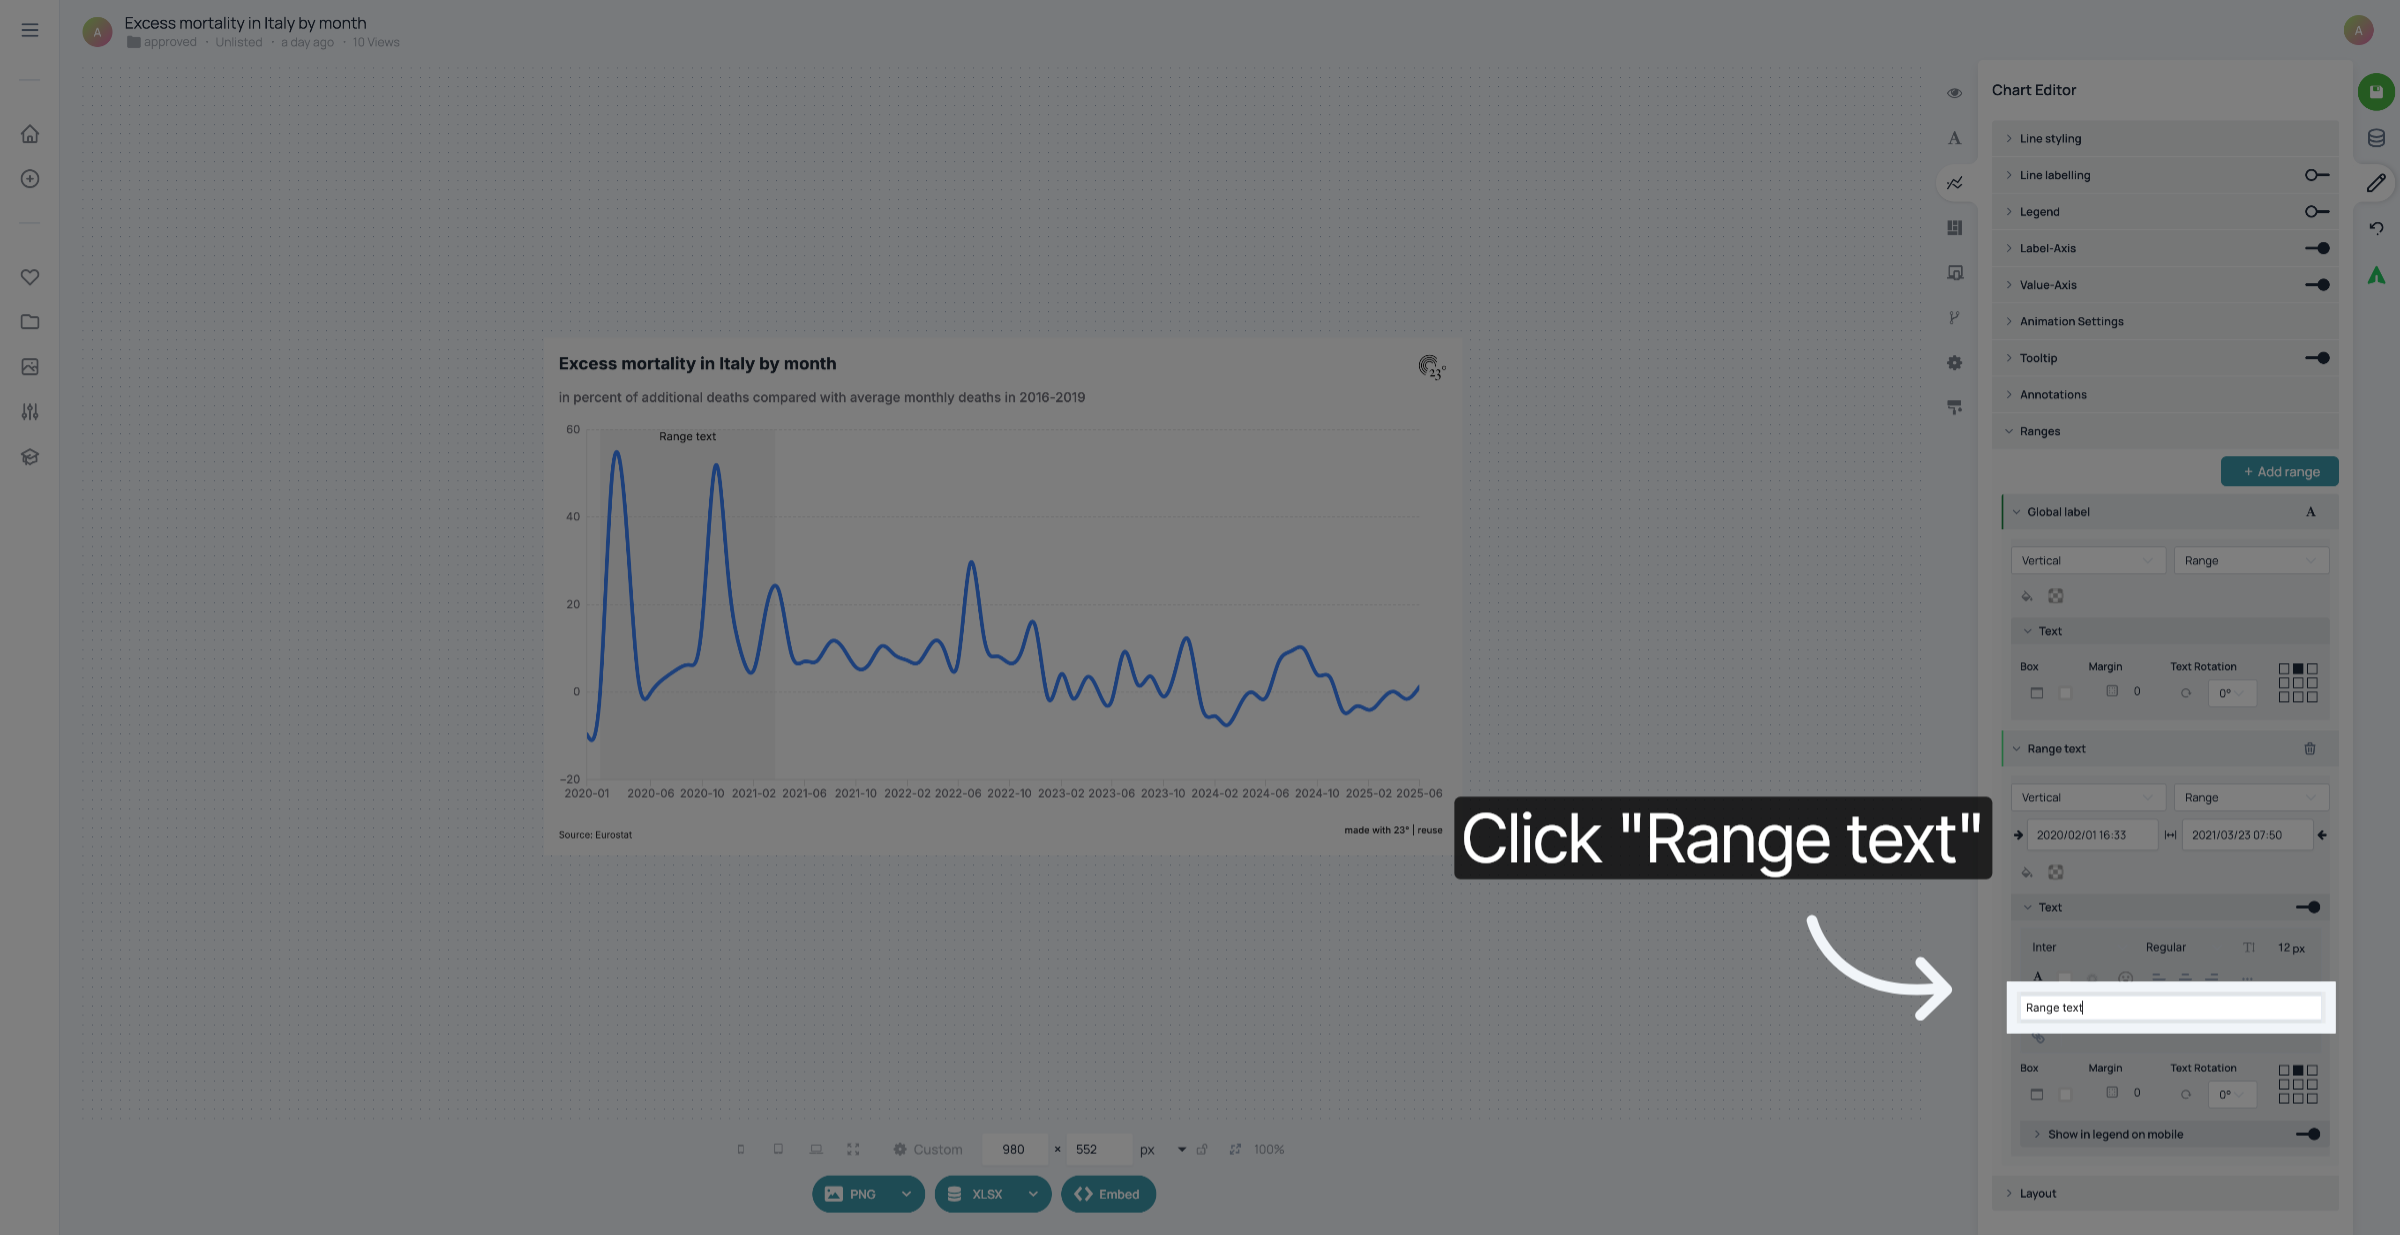
Click "Range text" to enter the label for the area.
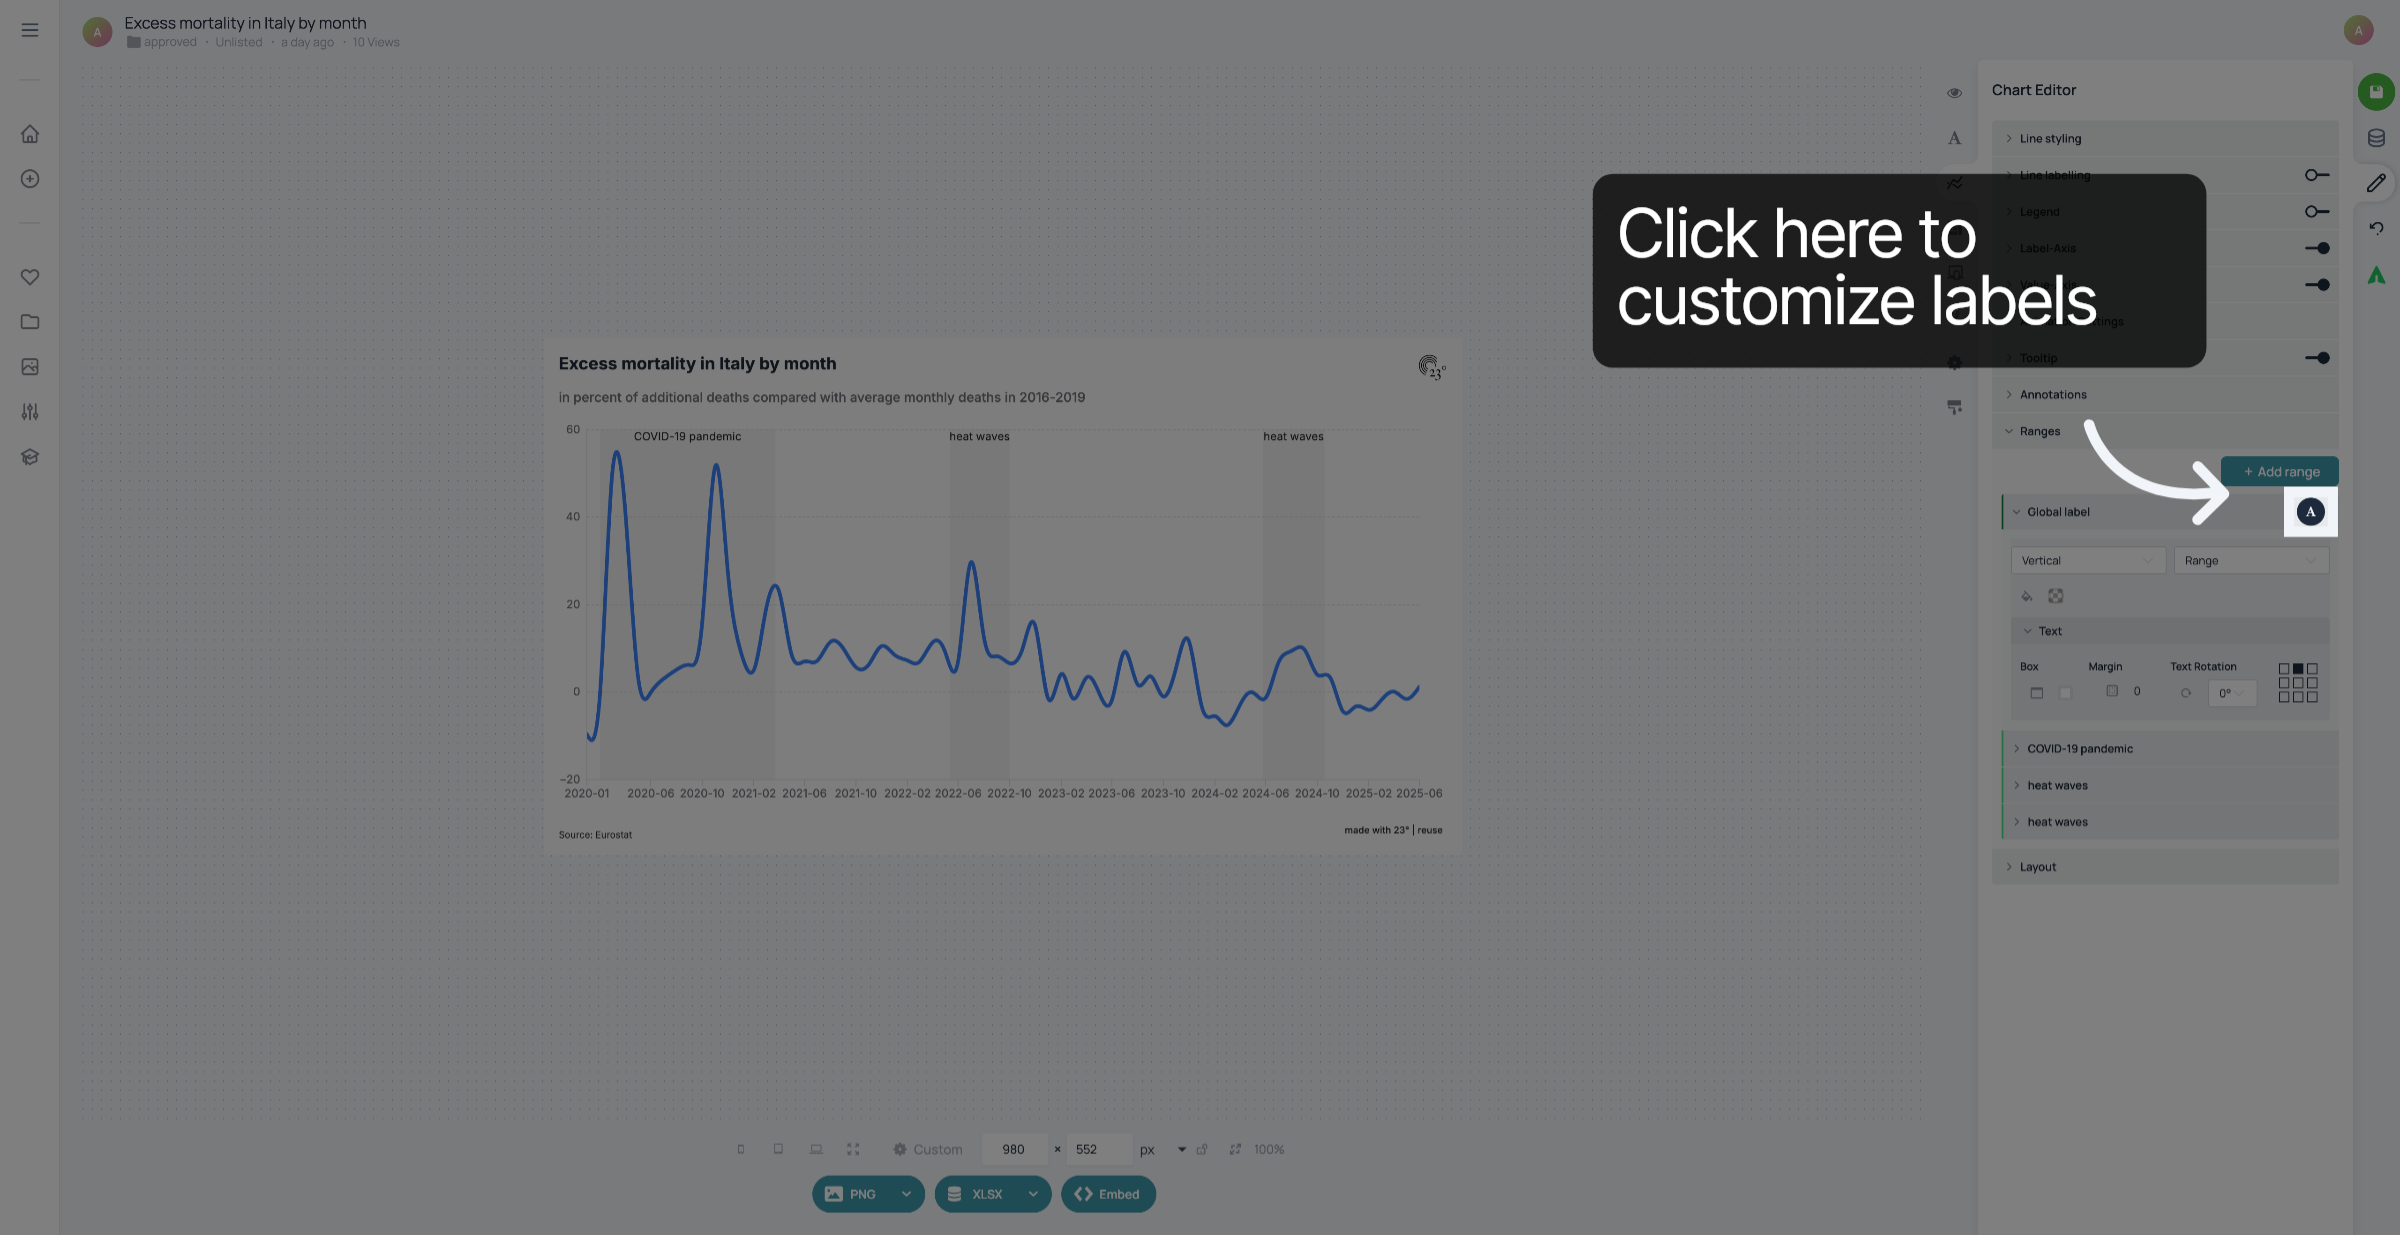
Click to access color options for the range areas.
Fill the color field to specify the desired color.
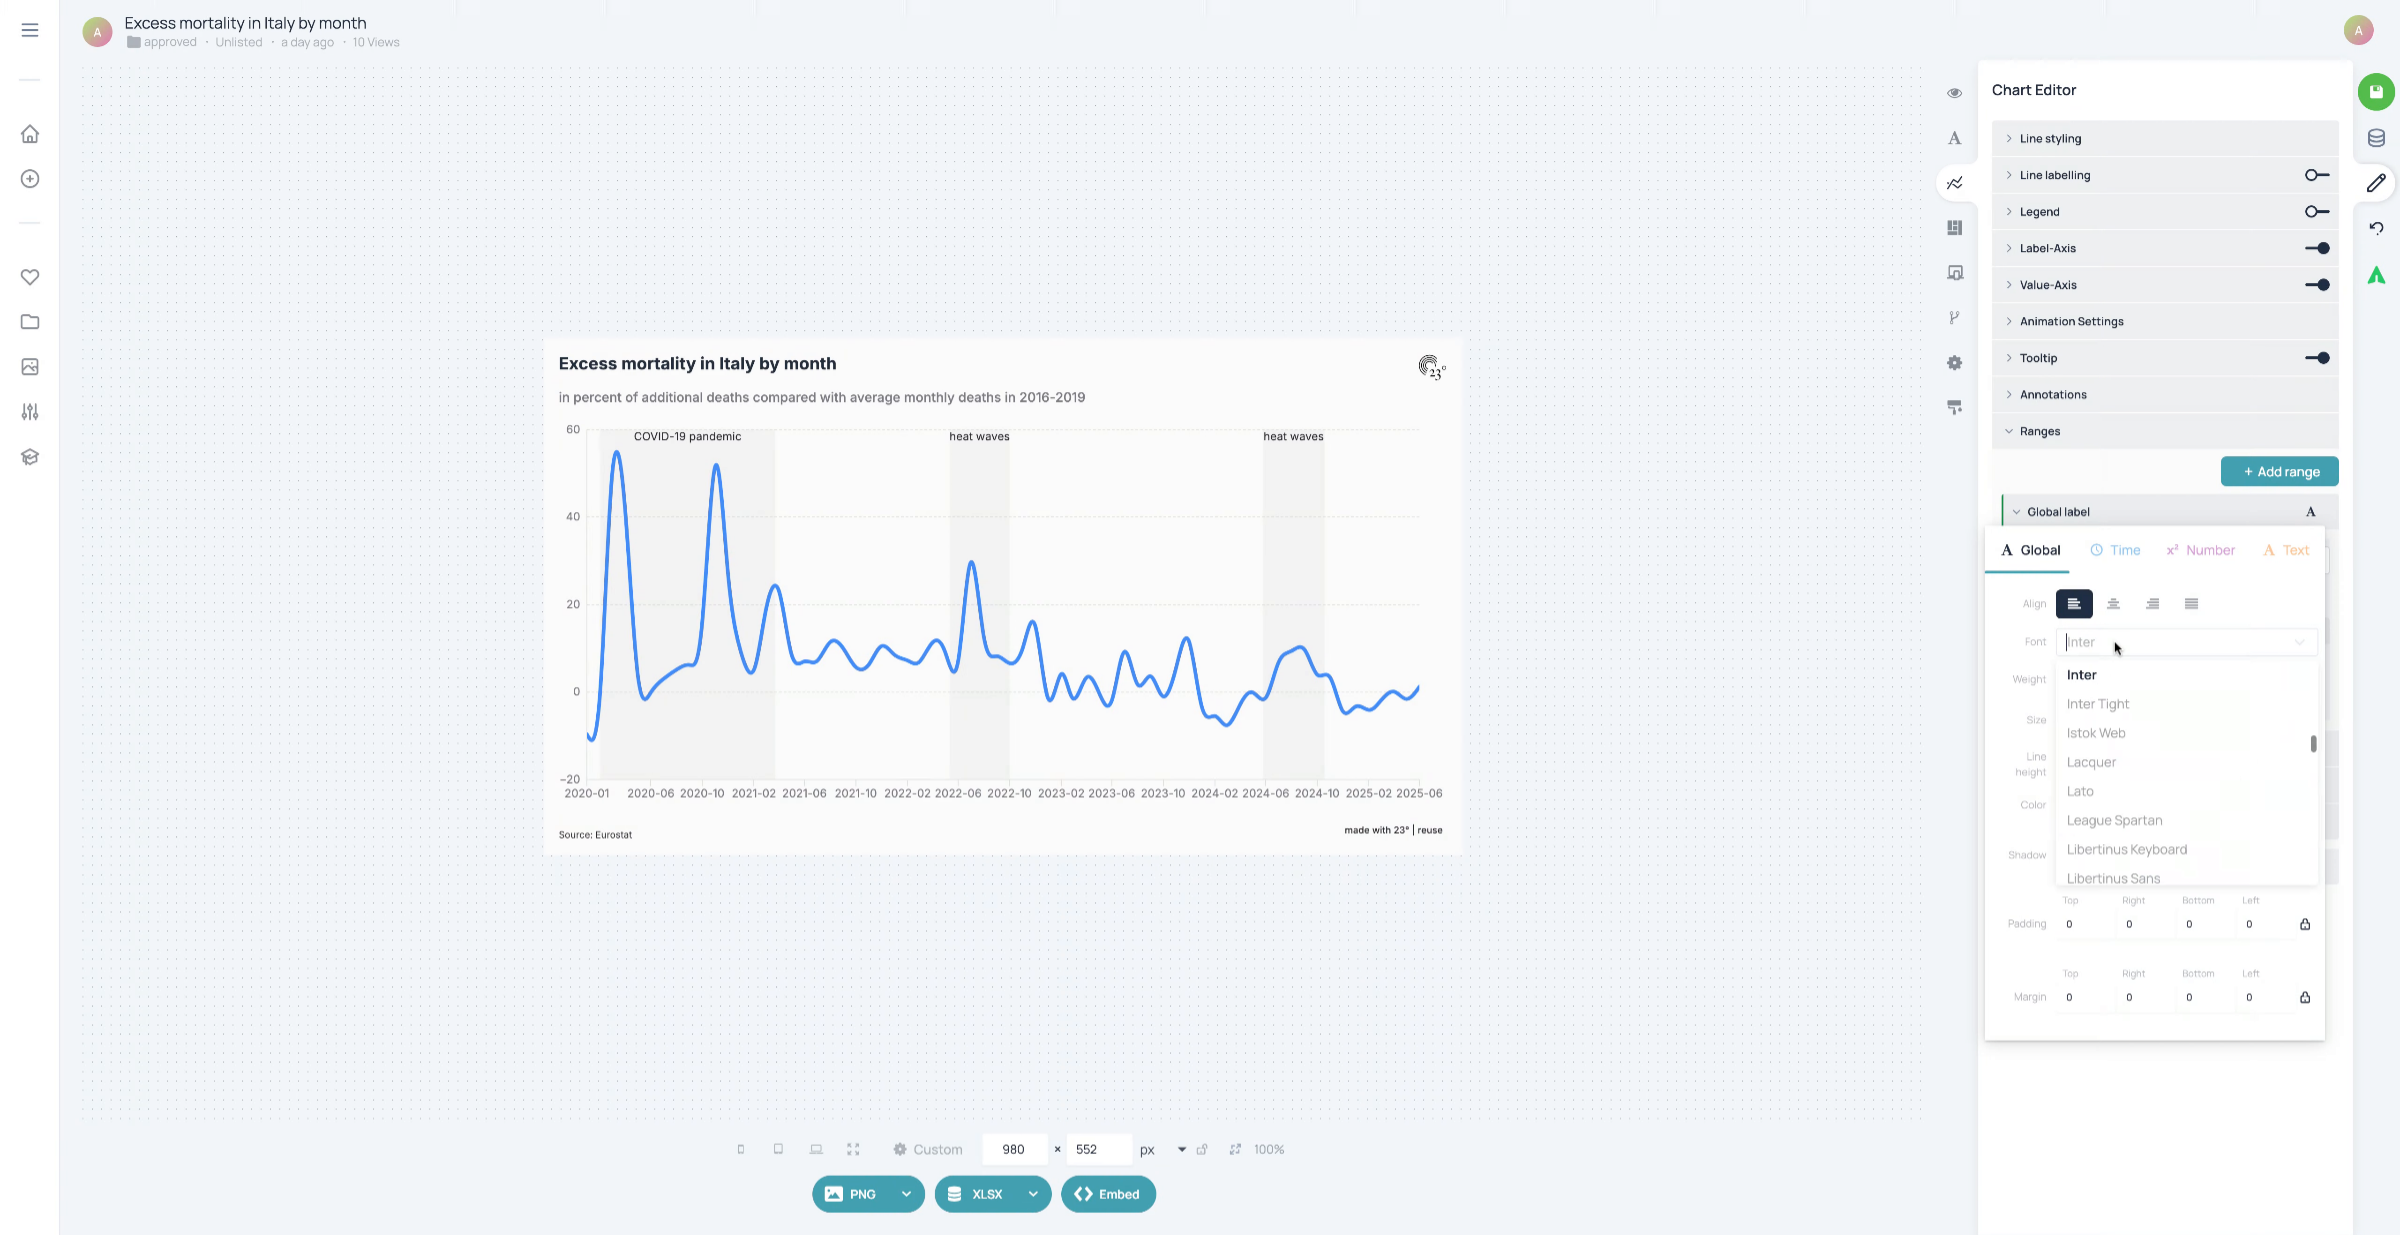
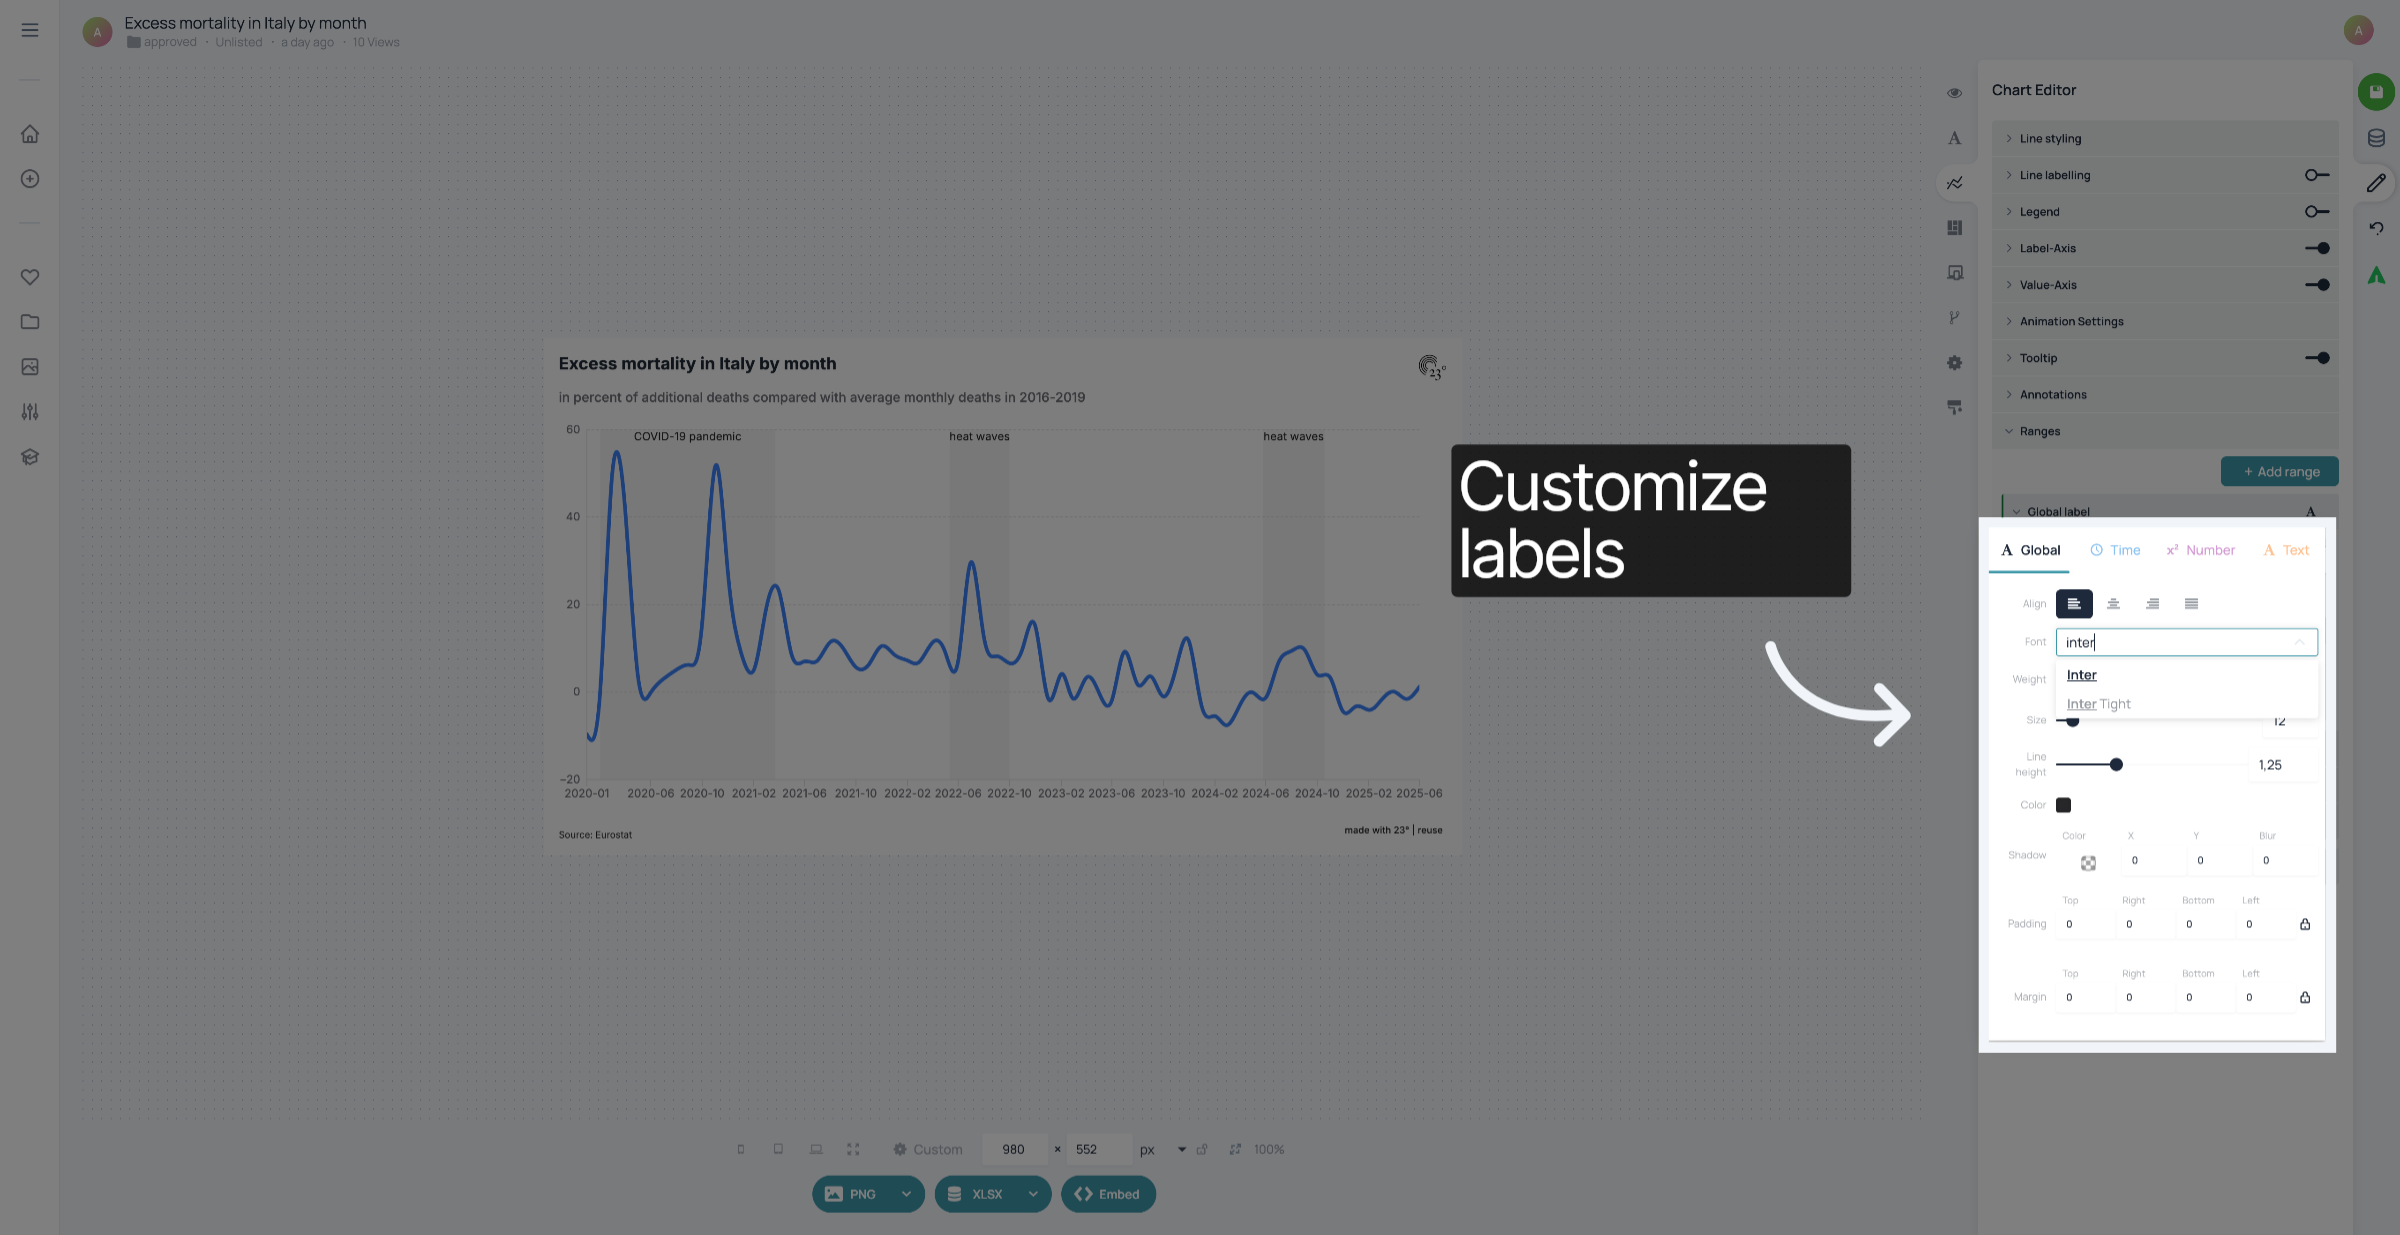
Click "Inter" to apply the selected color to the range.
Don't forget to save your changes.
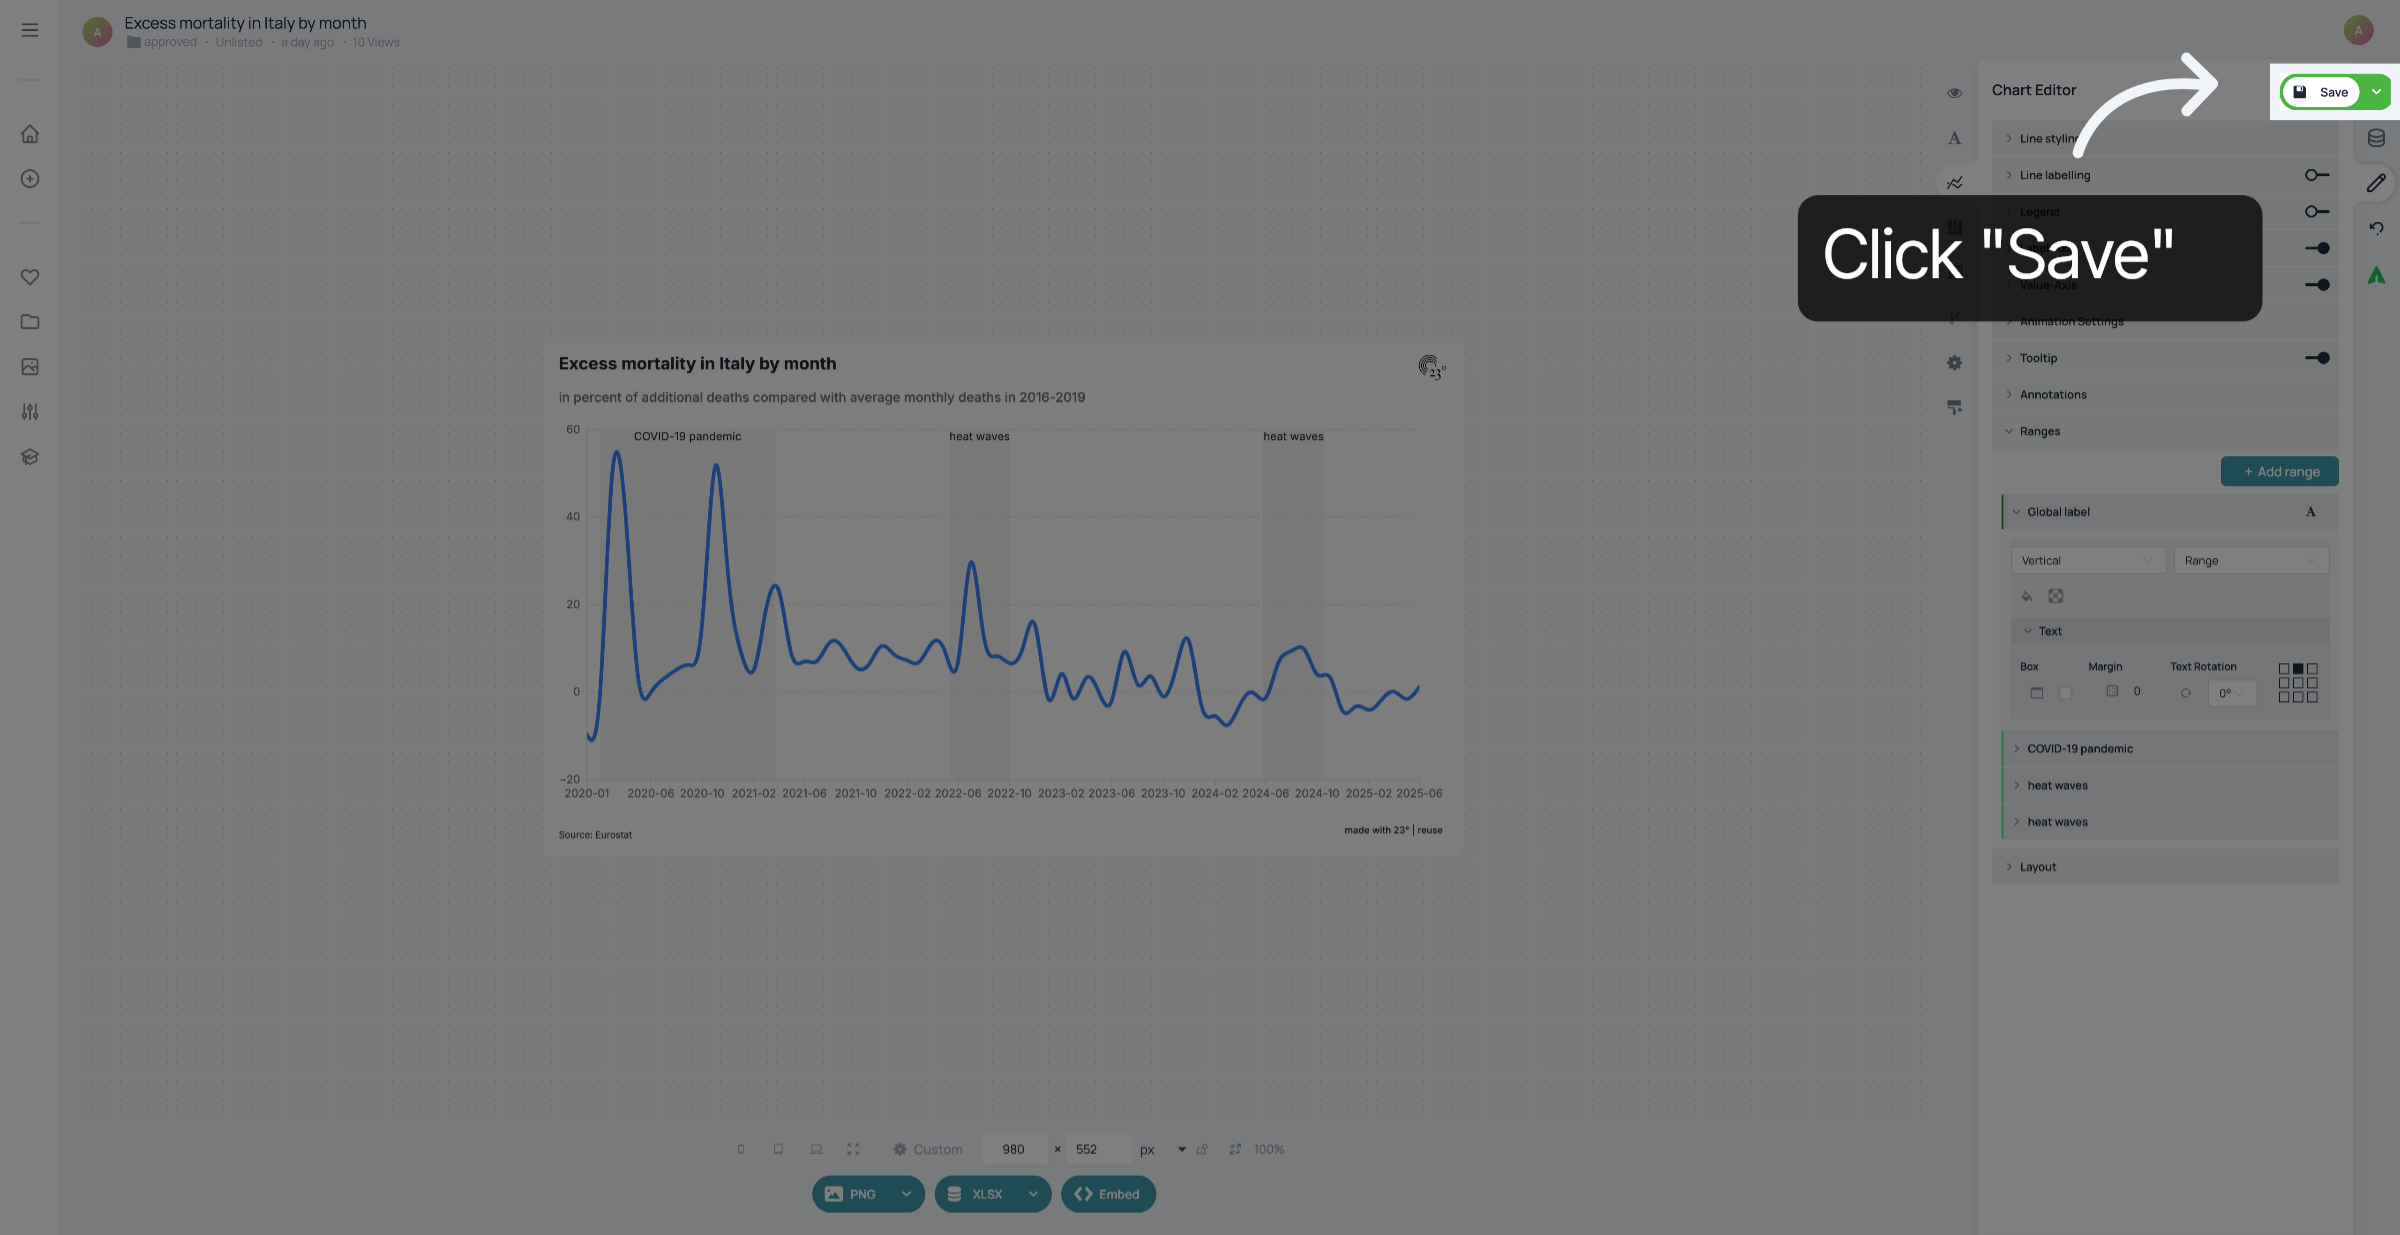
You have successfully added areas to your linechart.