How to add labels outside Donut Charts
This tutorial guides you through adding labels outside of a donutchart.
1. Introduction
You have a pie or donut chart and want the labels and values to be displayed outside of the chart? This tutorial will show you how.
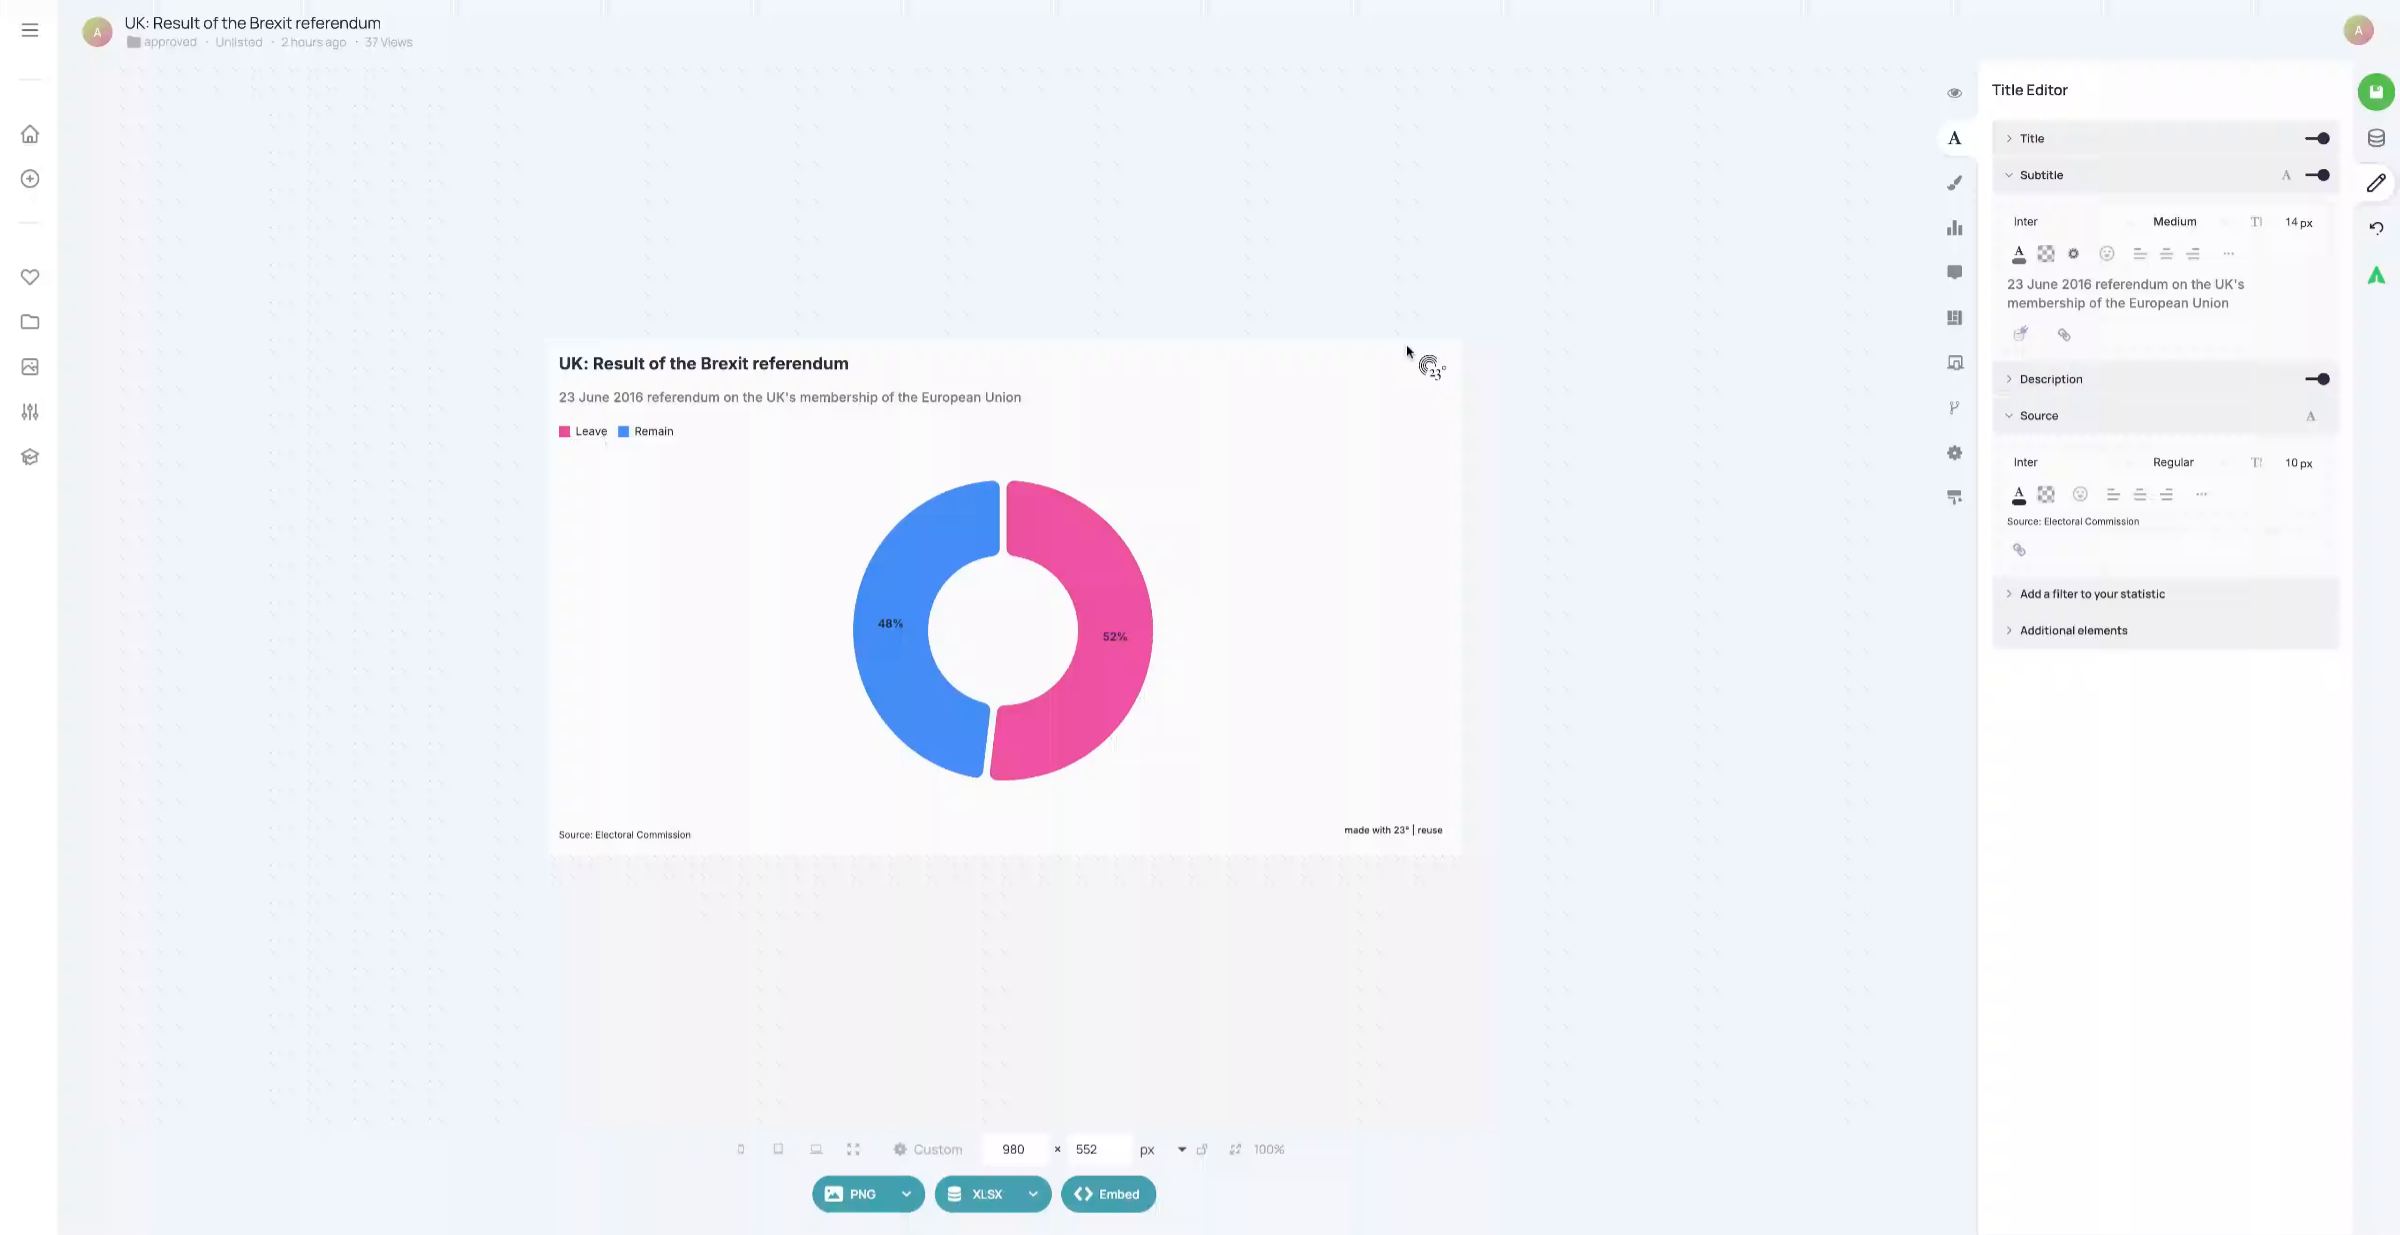
2. Go to the chart editor
Click here to go to the chart editor.
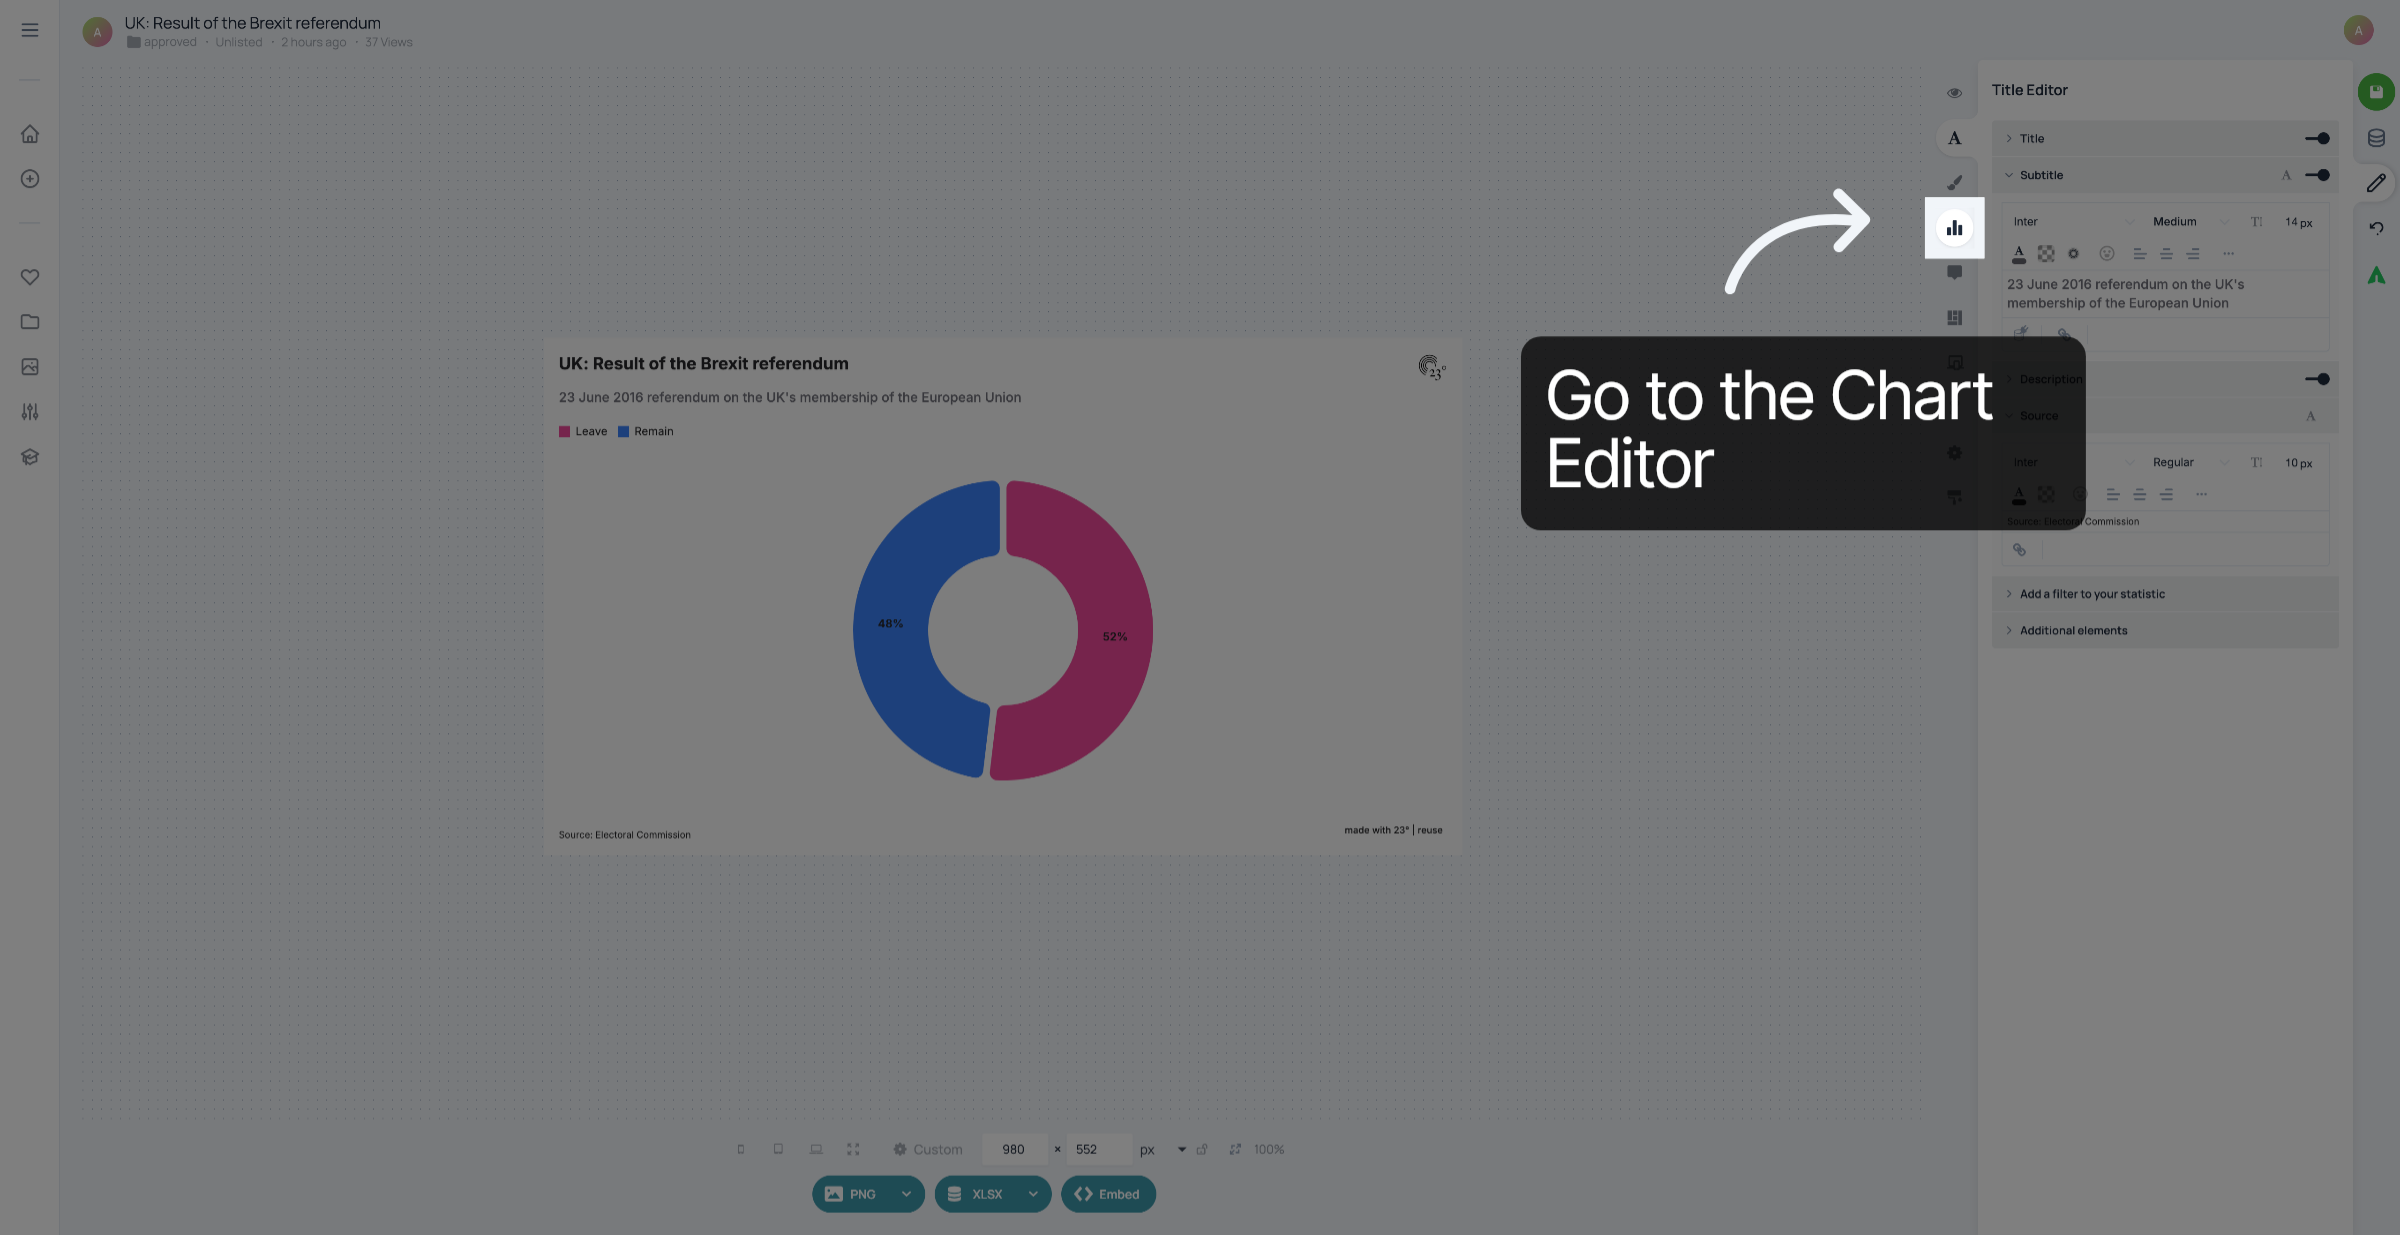
3. Click "Data labels"
Click "Data labels".
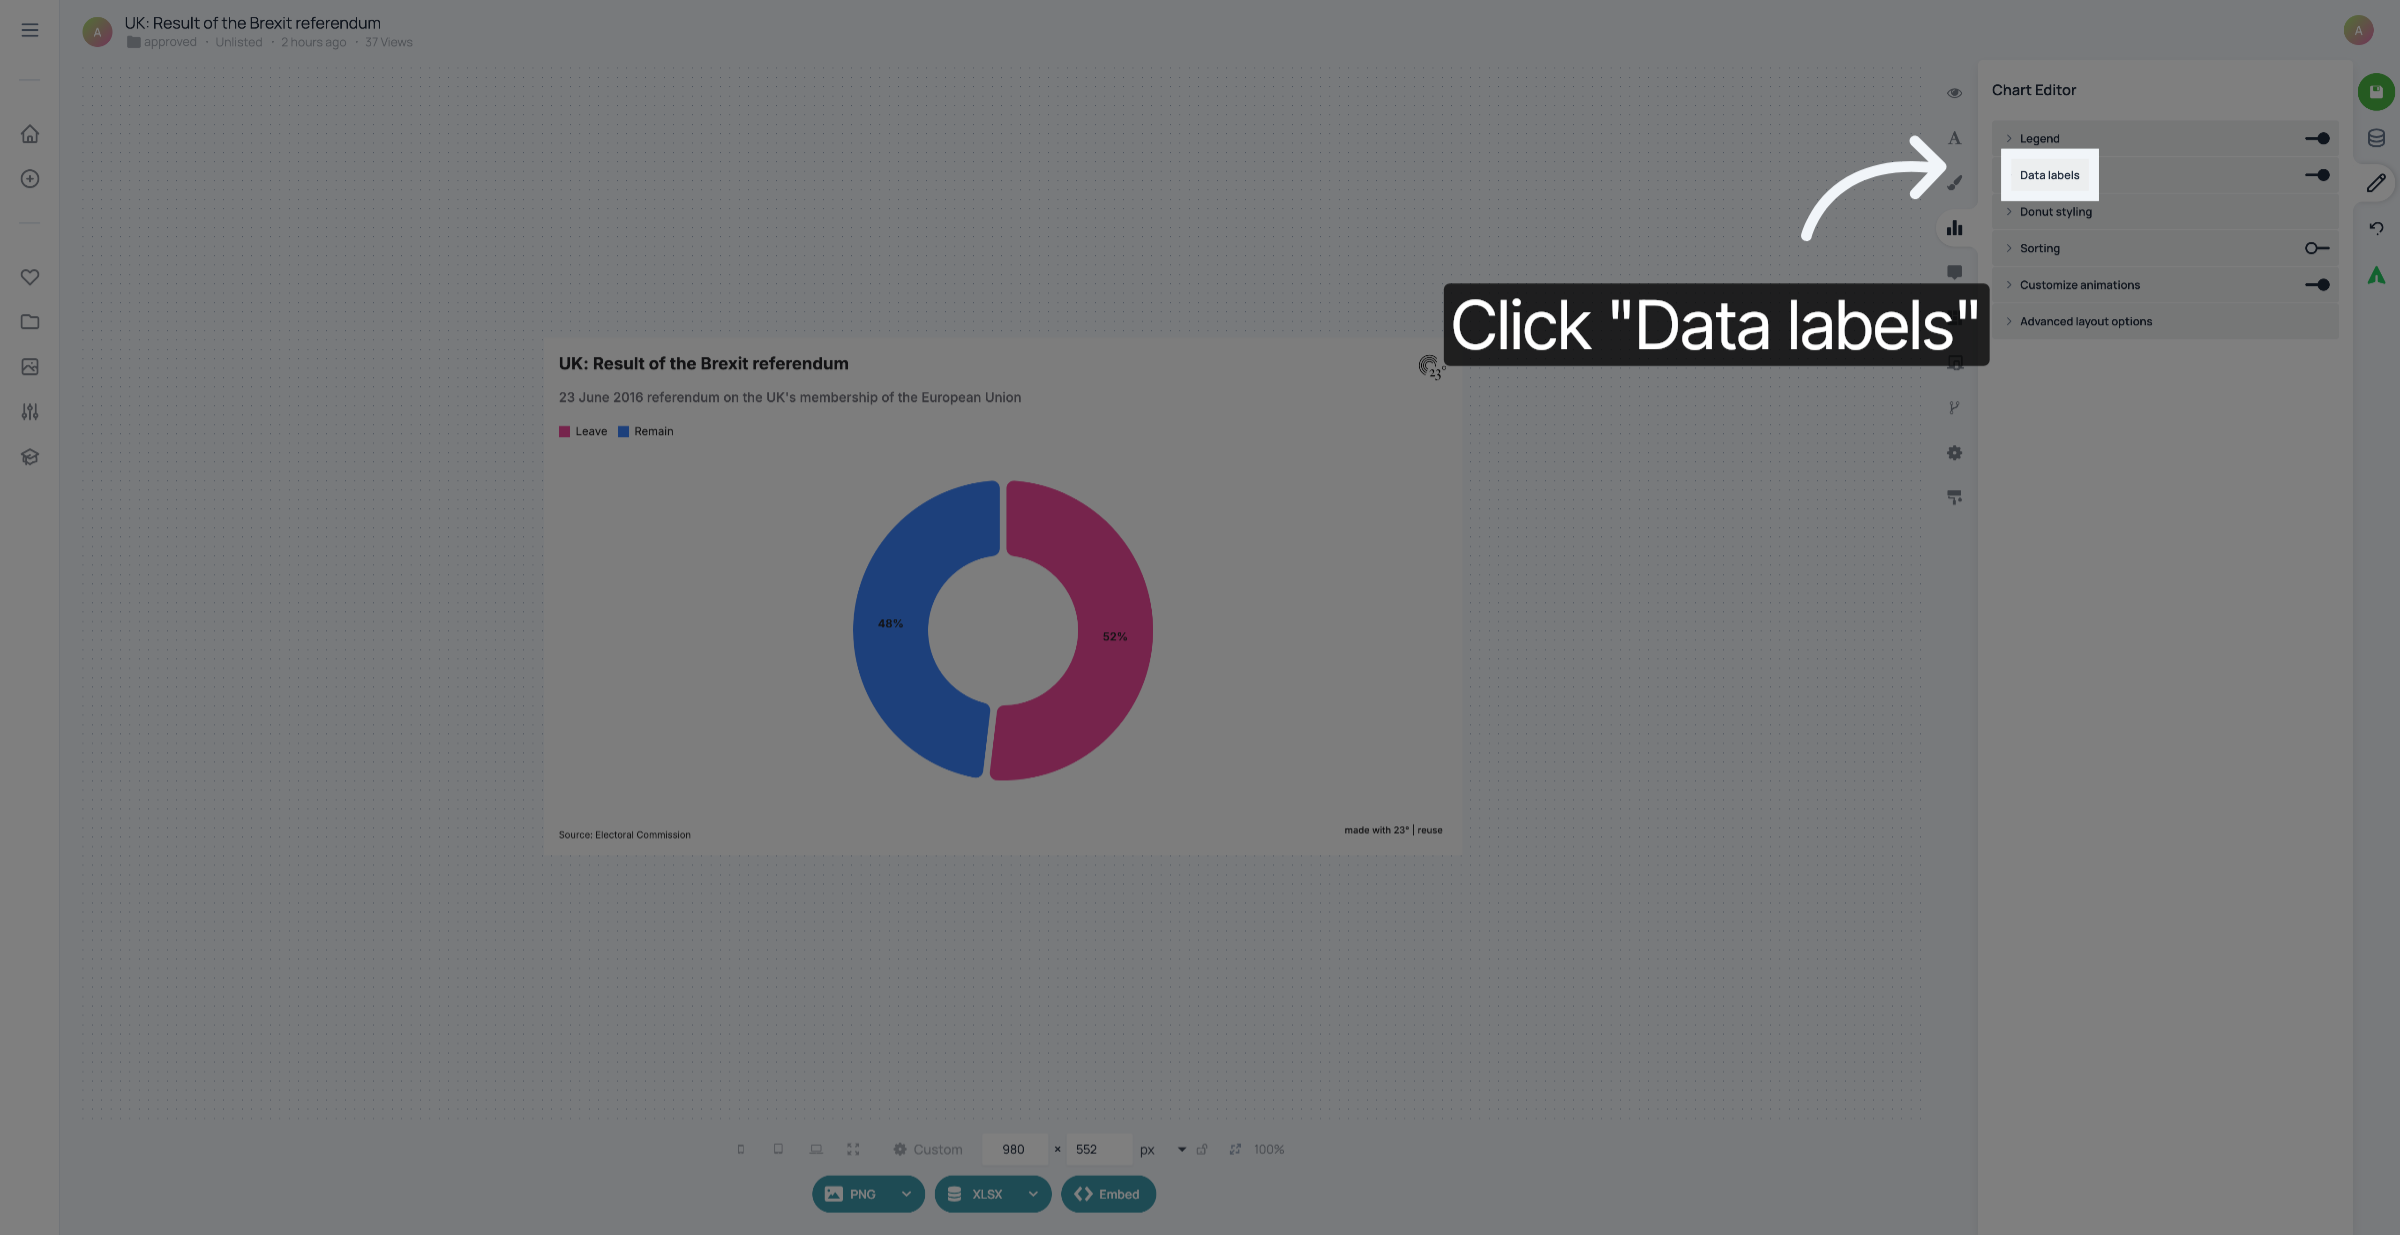
4. Deactivate labels inside
Deactivate labels inside.
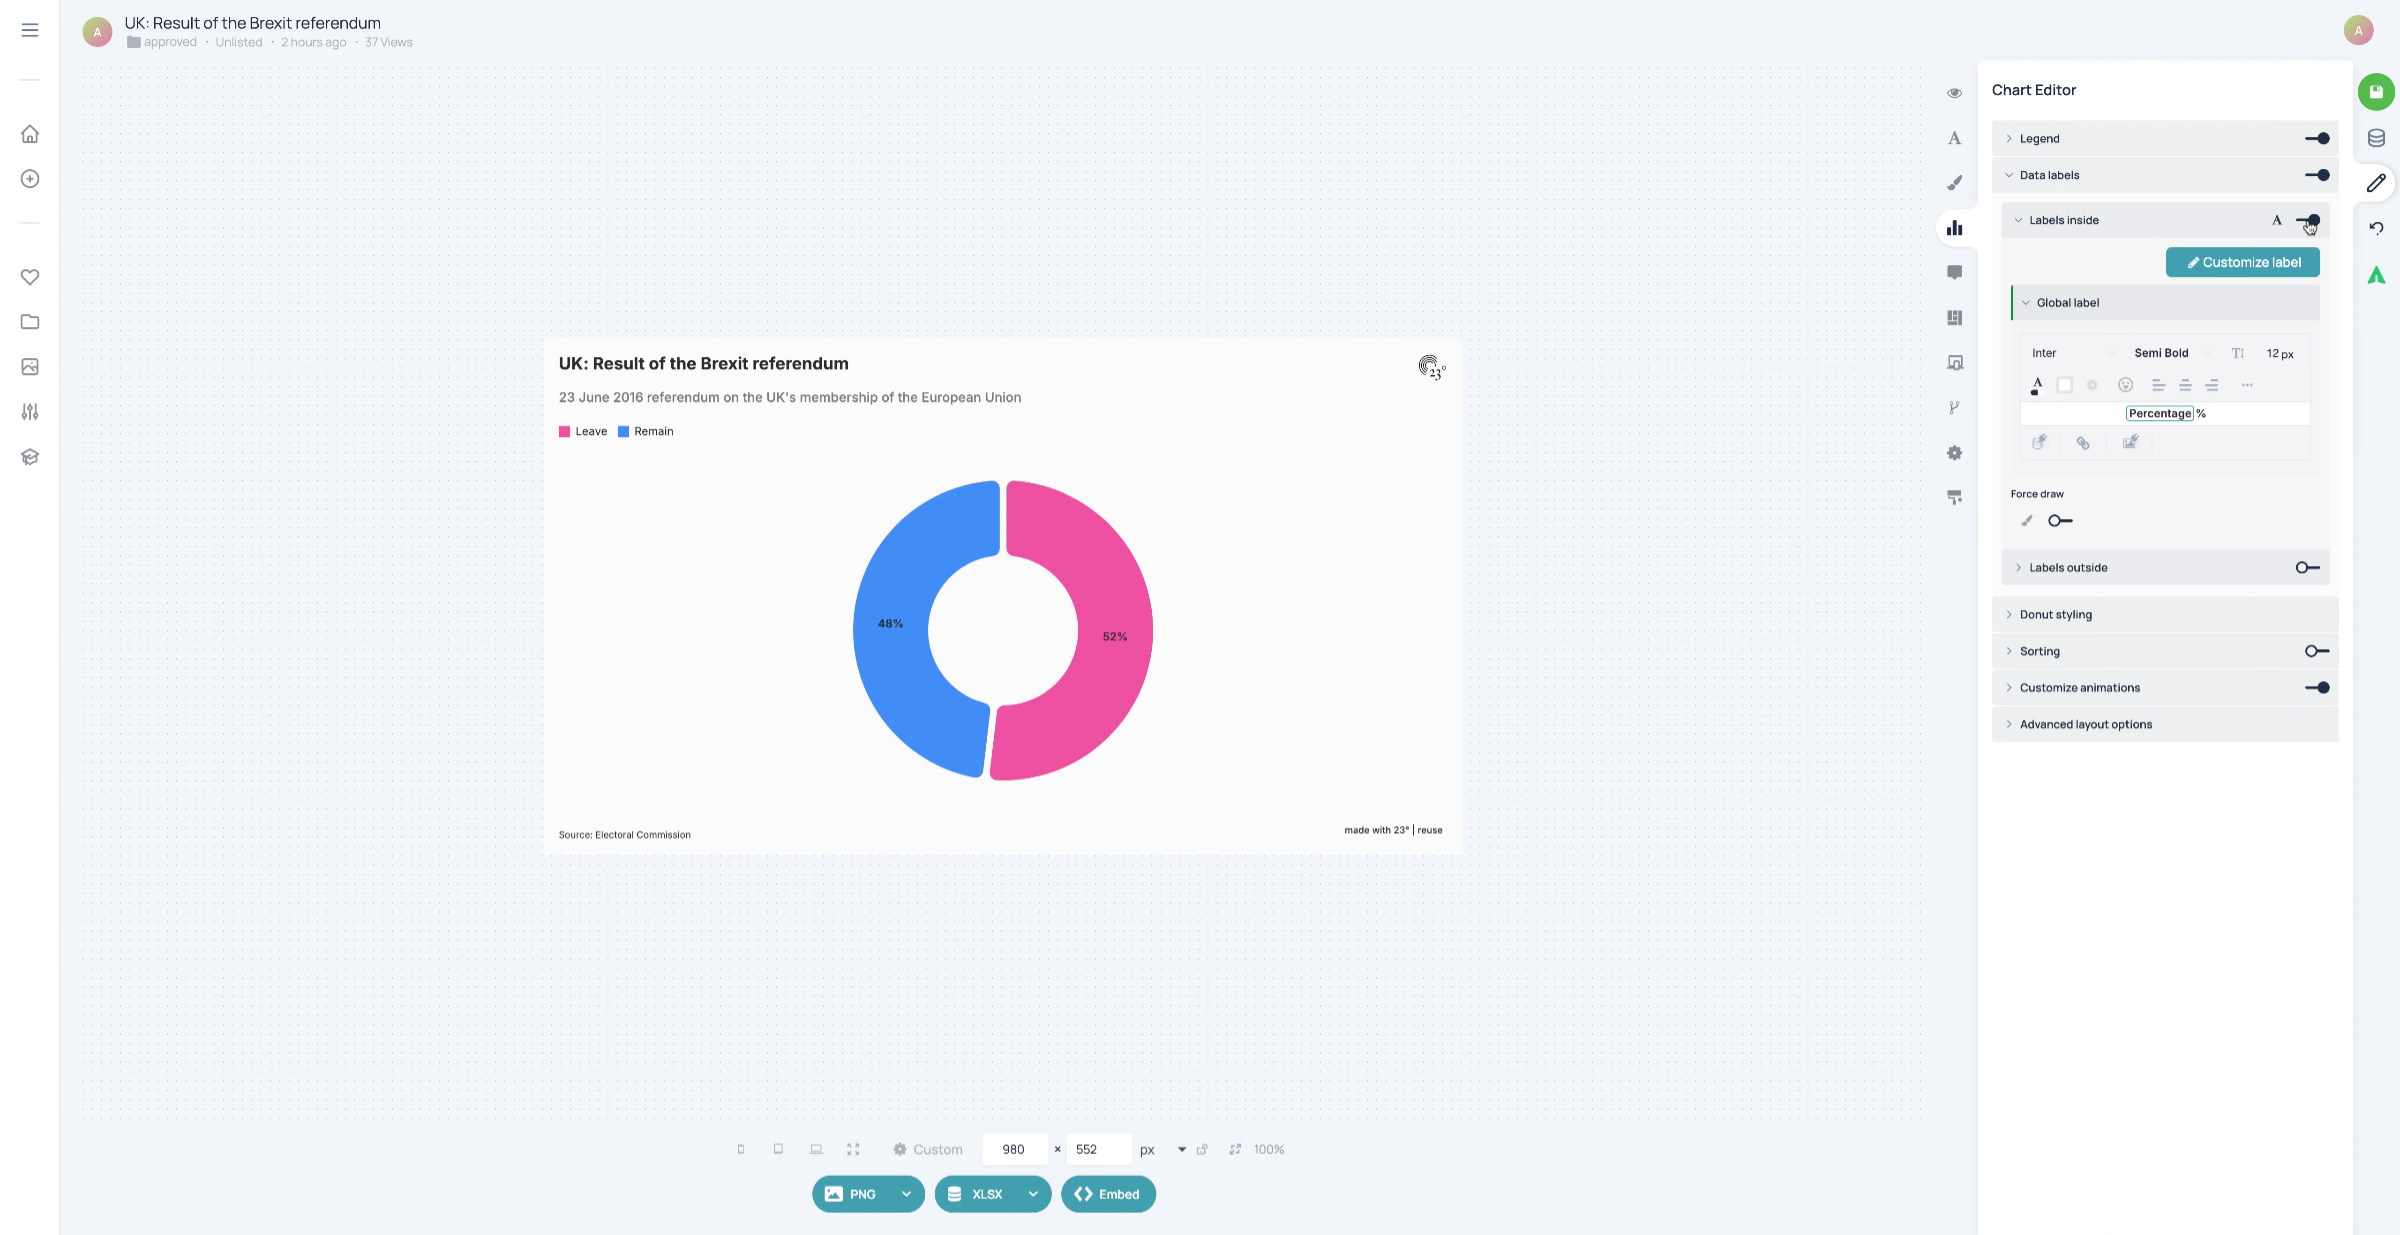
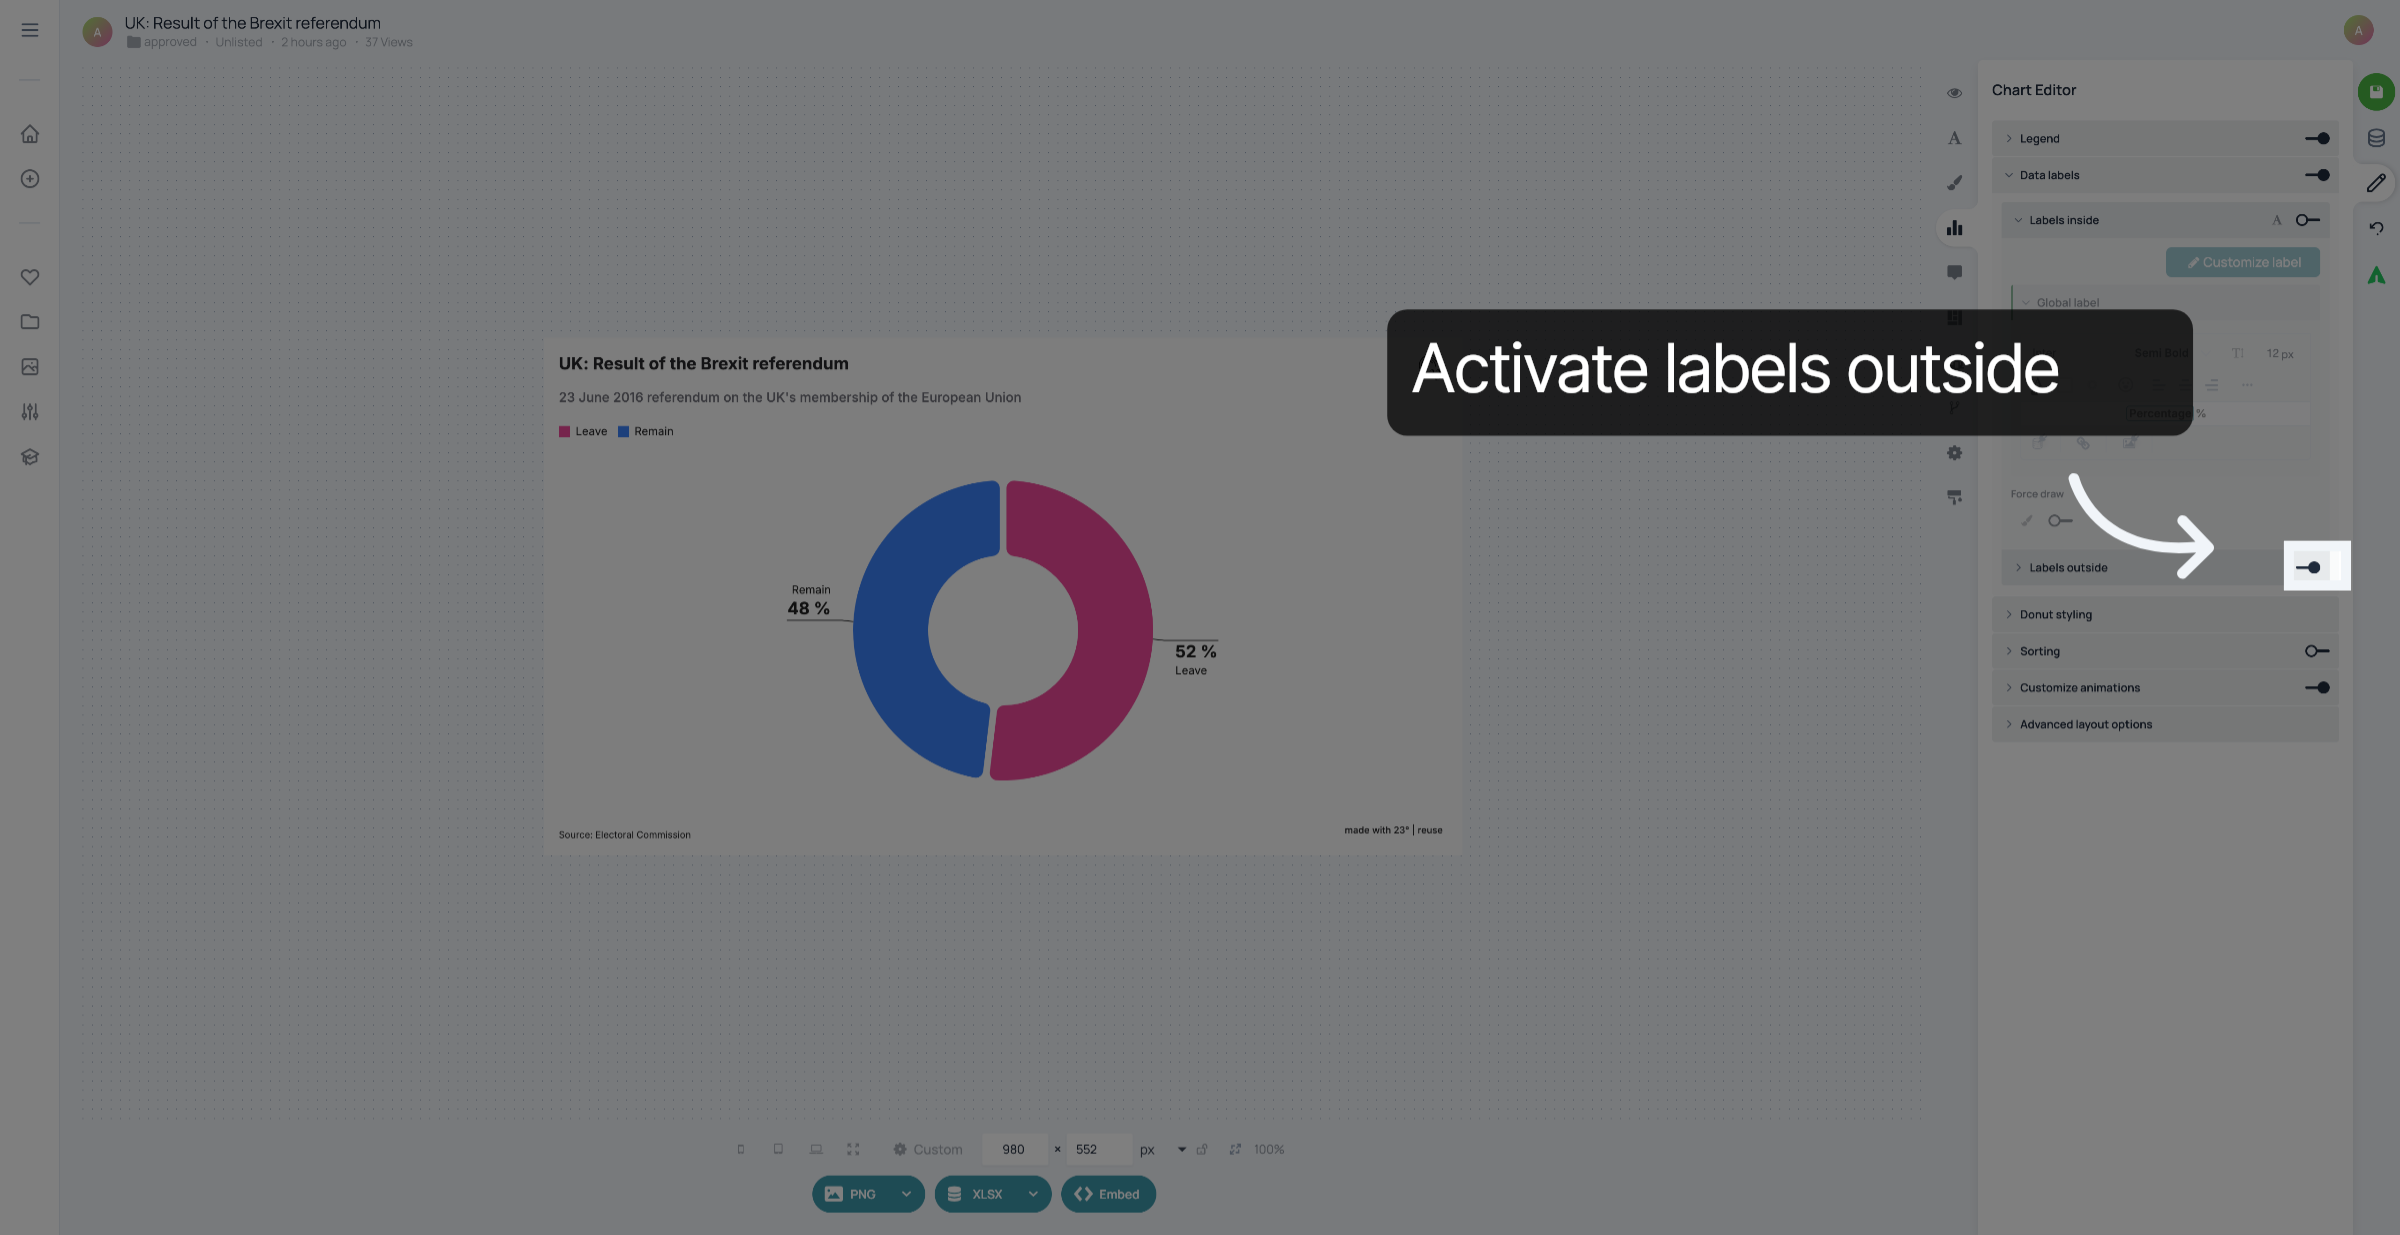
5. Activate labels outside
Activate "Labels outside".
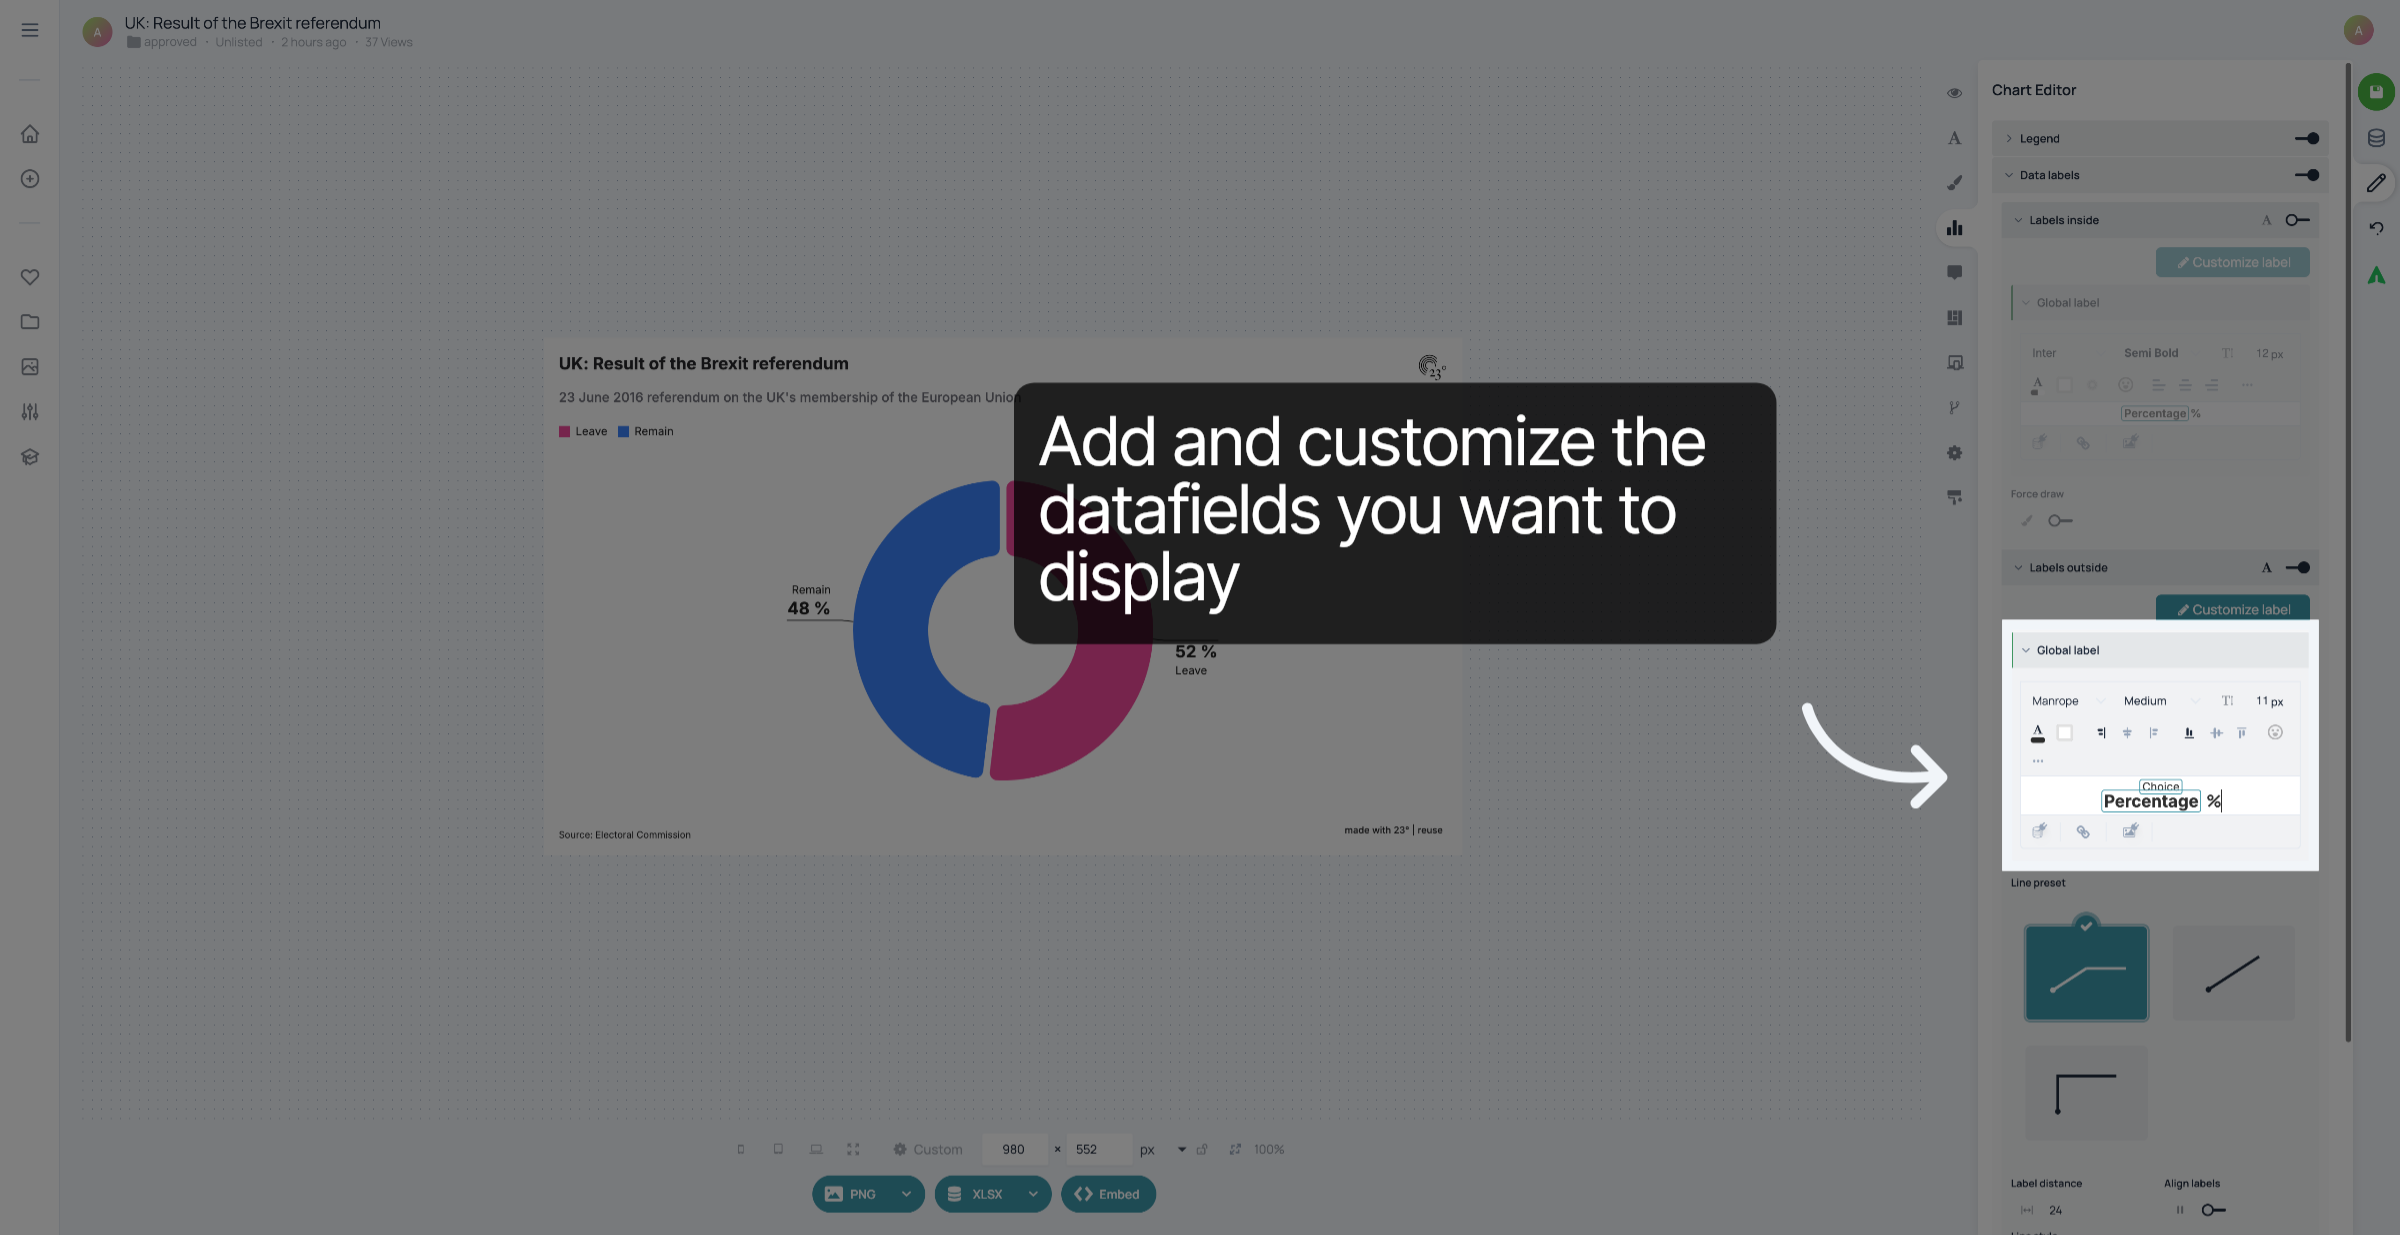
6. Add and customize the labels
Add and customize the datafields you want to display.
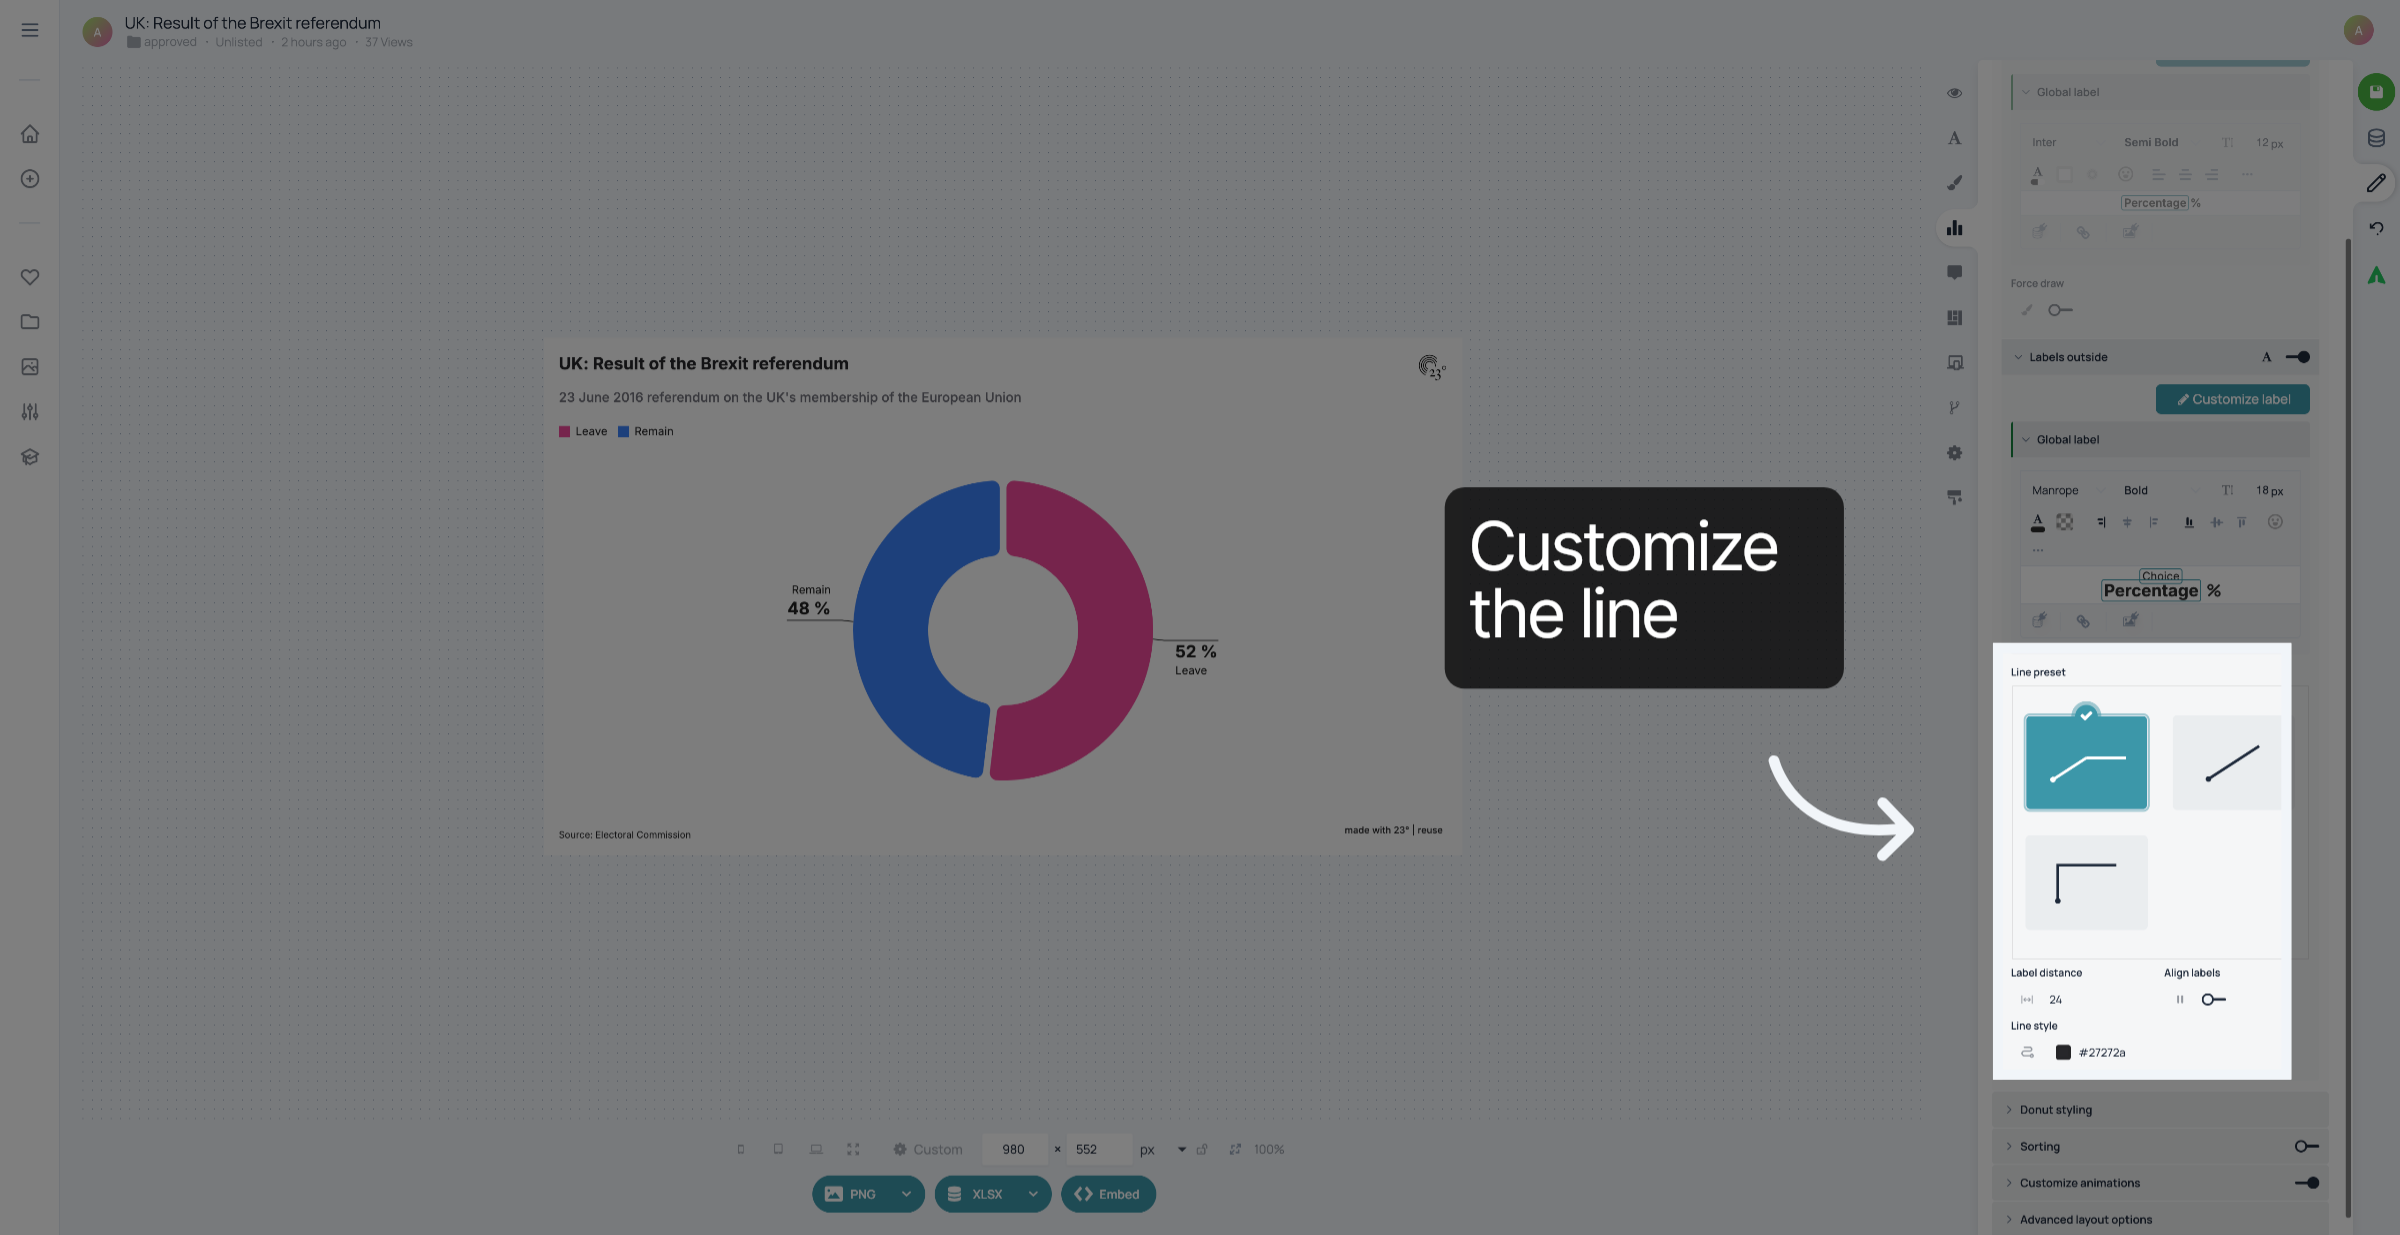
7. Customize line
Customize the line that connects the label to the pie or donut chart.
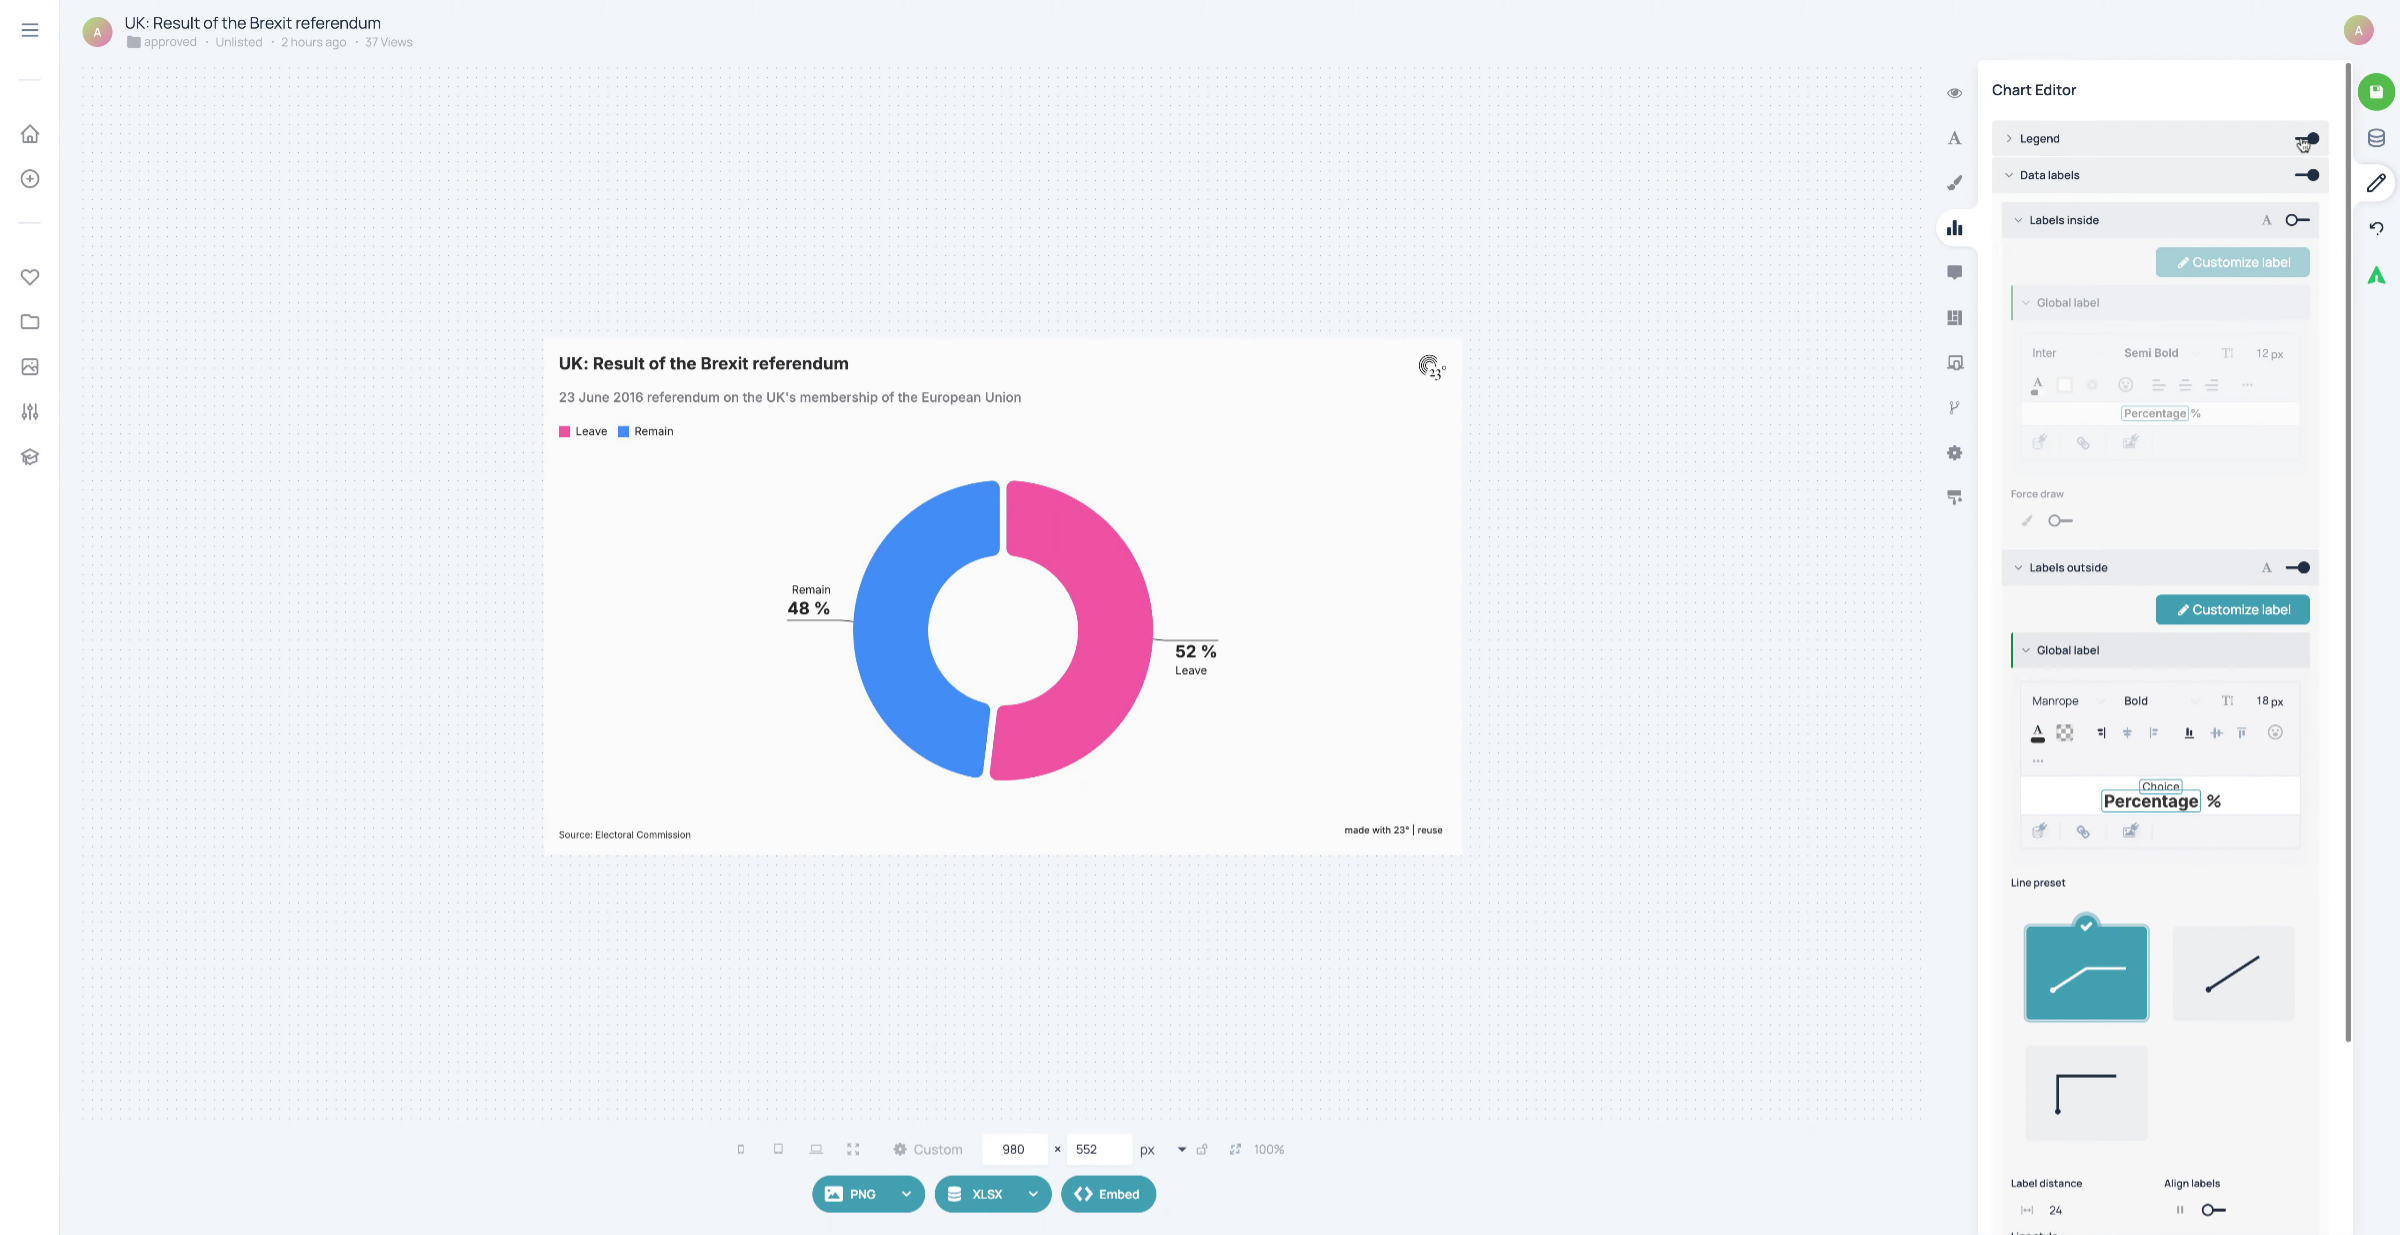
8. Deactivate legend
When the labels are next to the visualisation already, you don't need a legend. You can deactivate it.
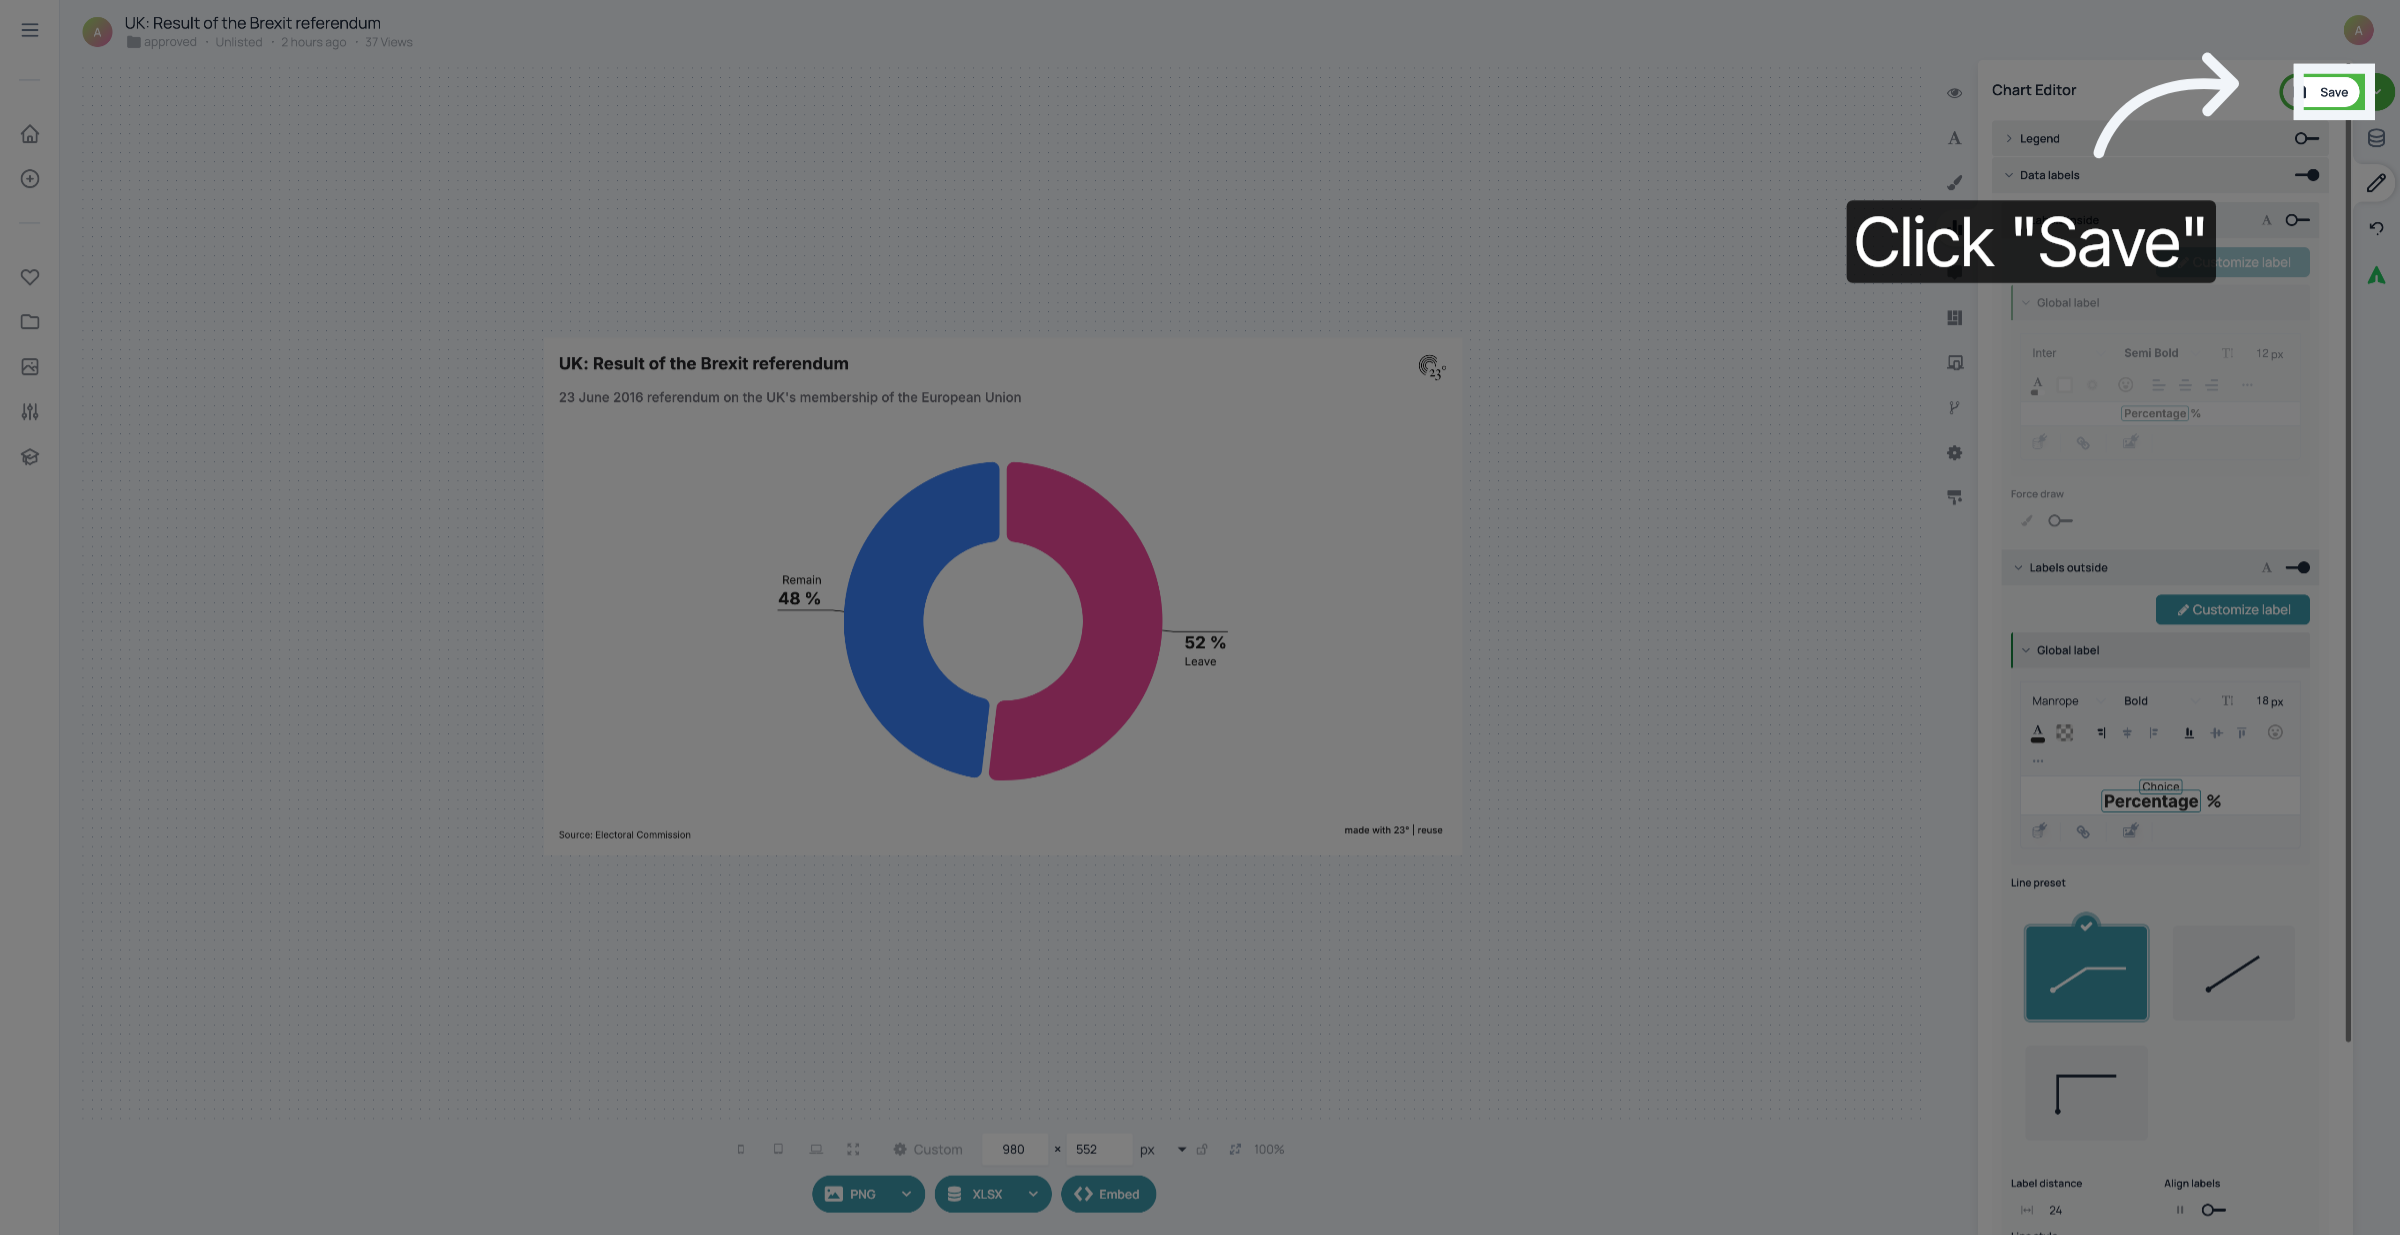
9. Save your changes
Don't forget to save your changes.
You have successfully added and customized labels outside of your your pie or donut chart.