View Charts In Different Modes While Editing
This tutorial demonstrates how to view charts in various modes during editing.
1. Introduction
You will learn to switch between different chart views to ensure that your charts look great on any device.
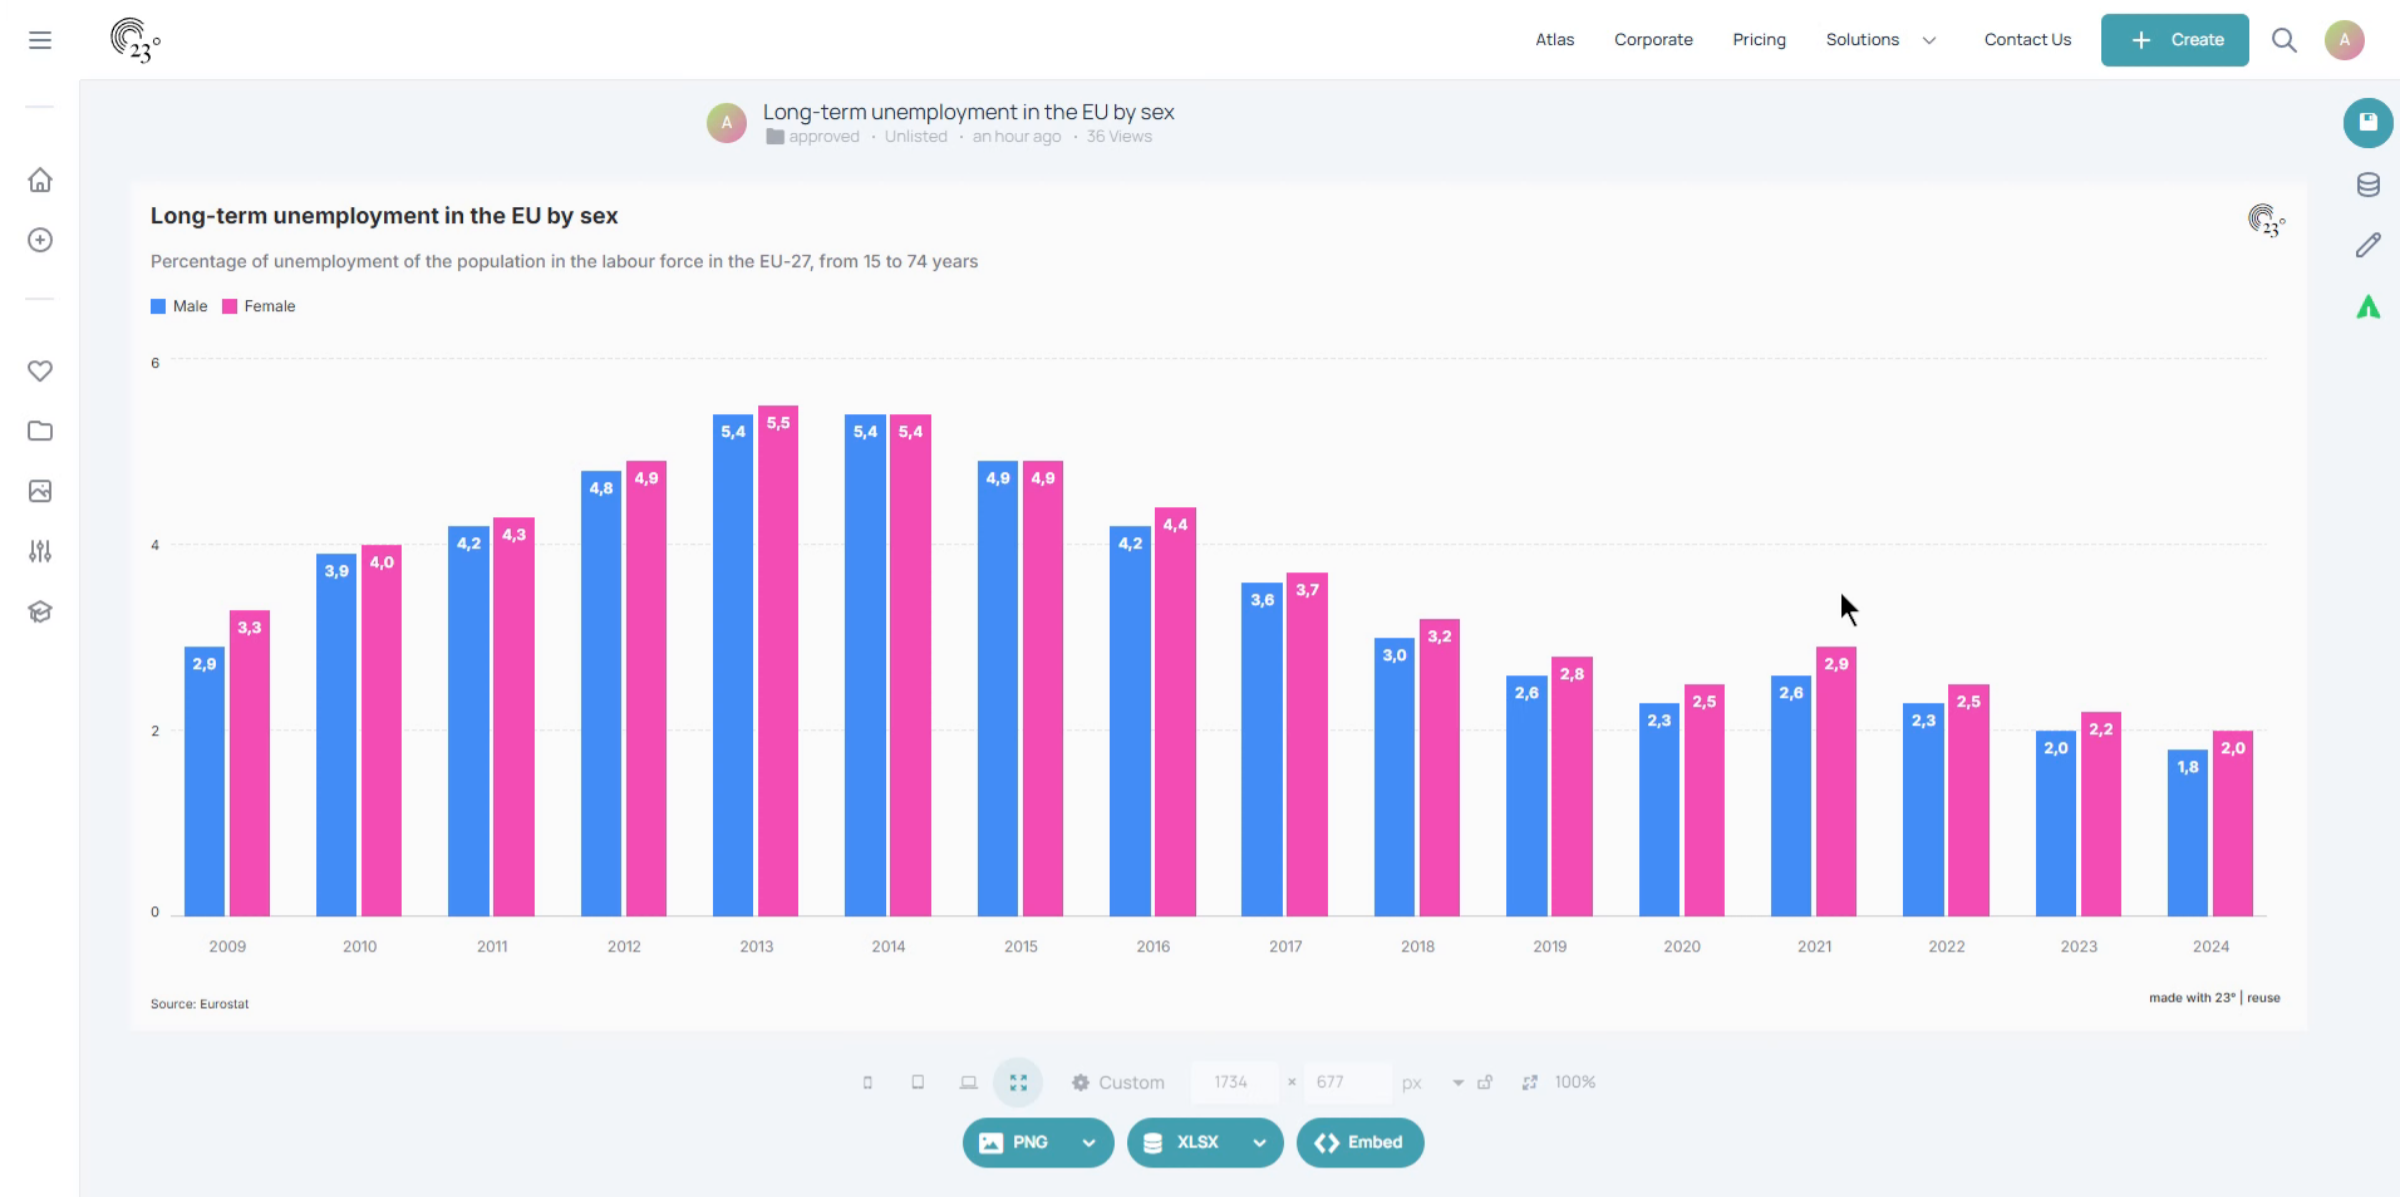
2. Desktop
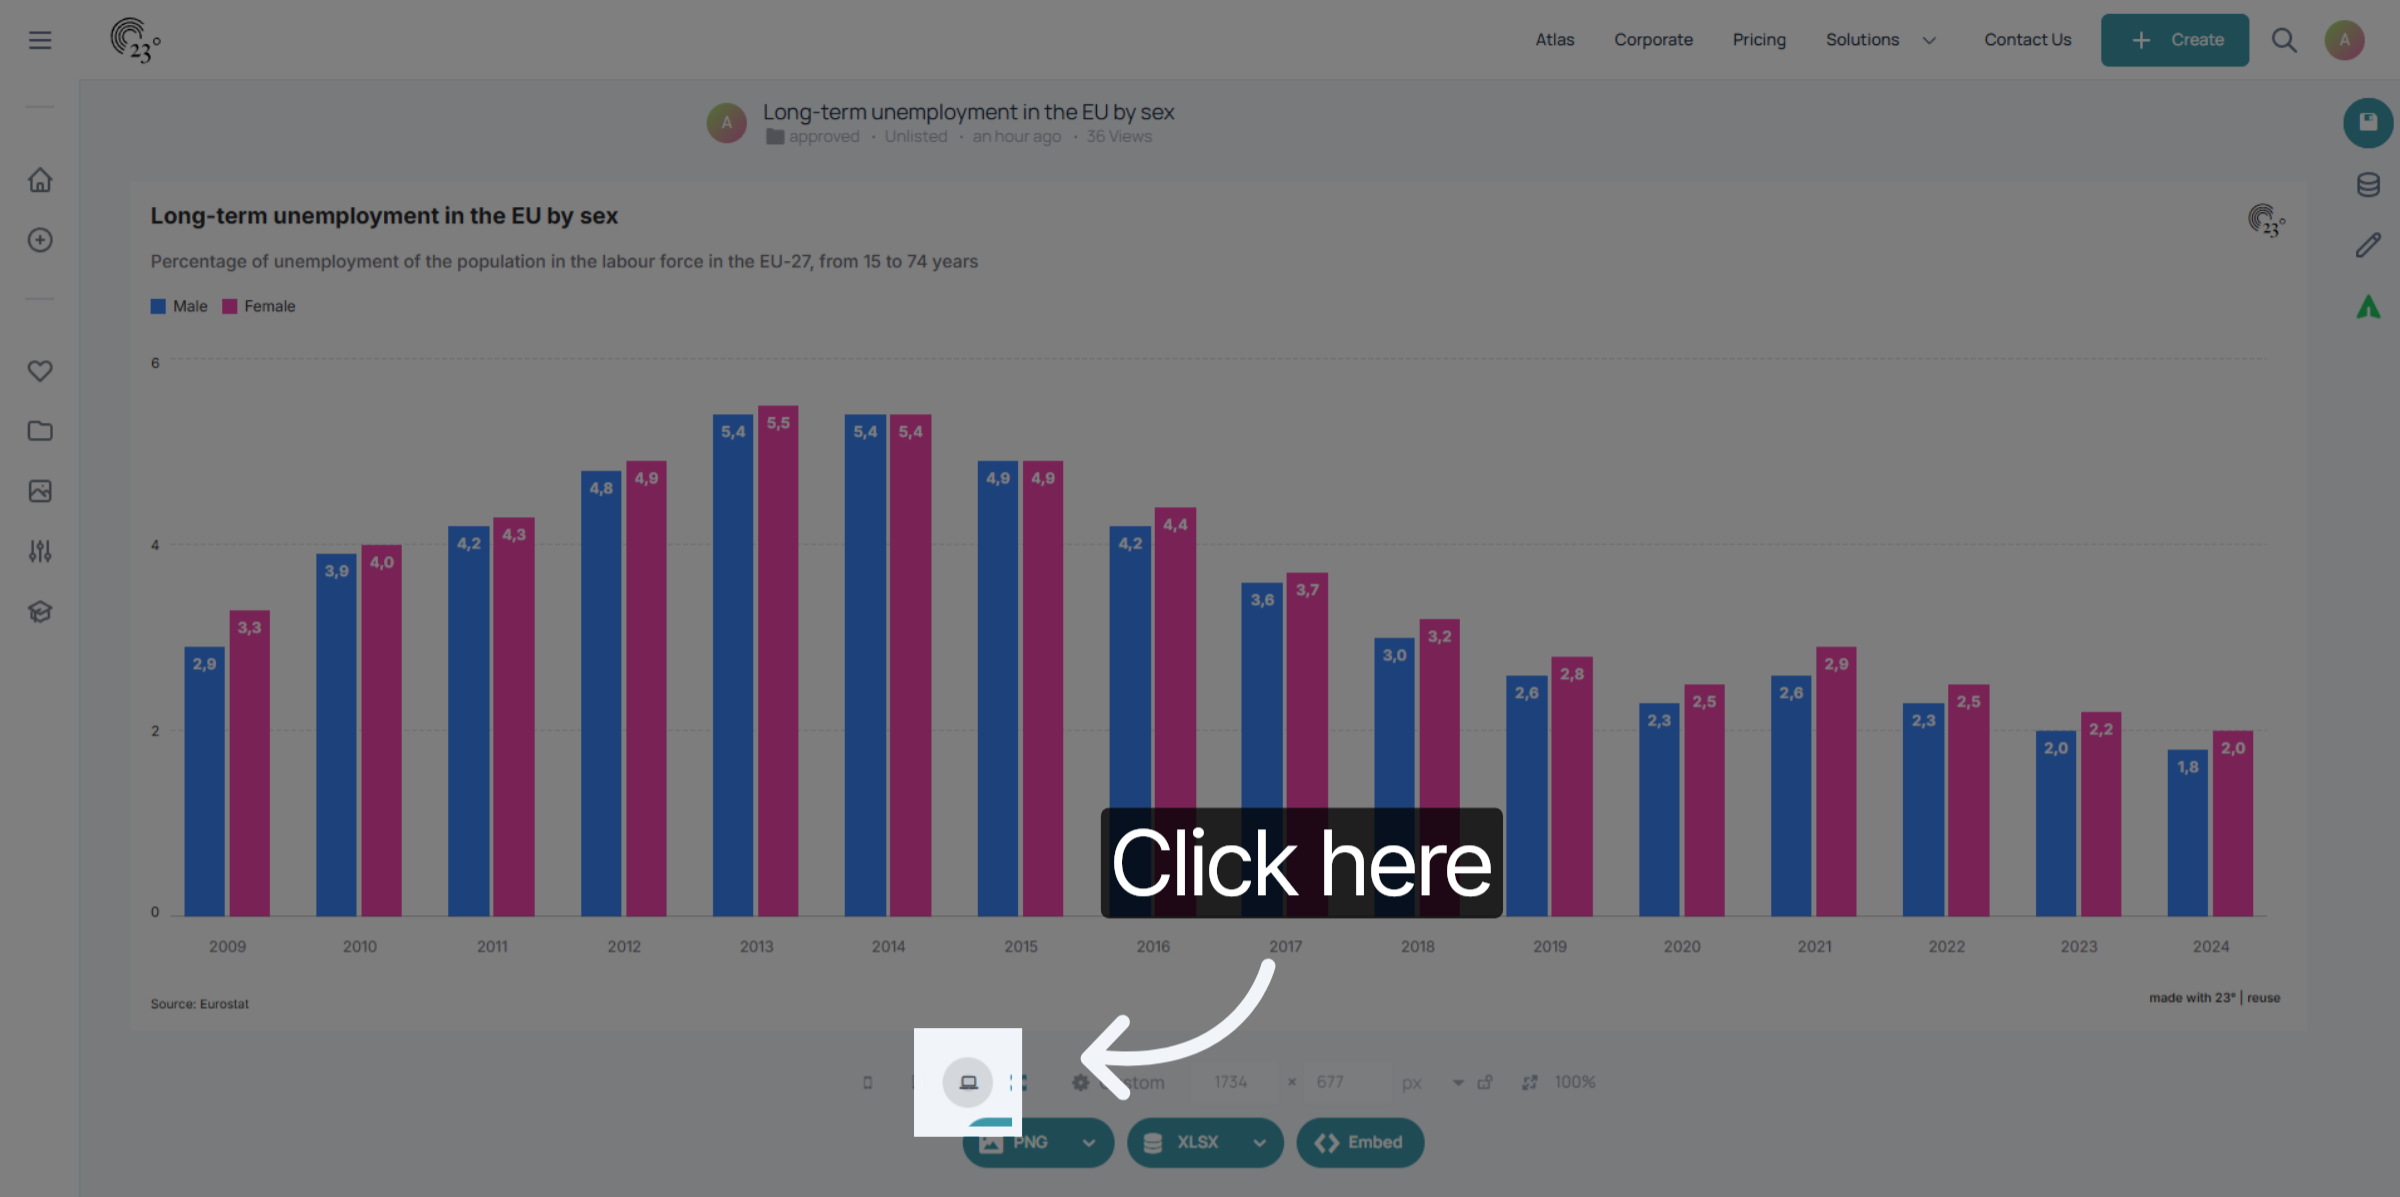
Click on the laptop icon to view your chart in a desktop environment.
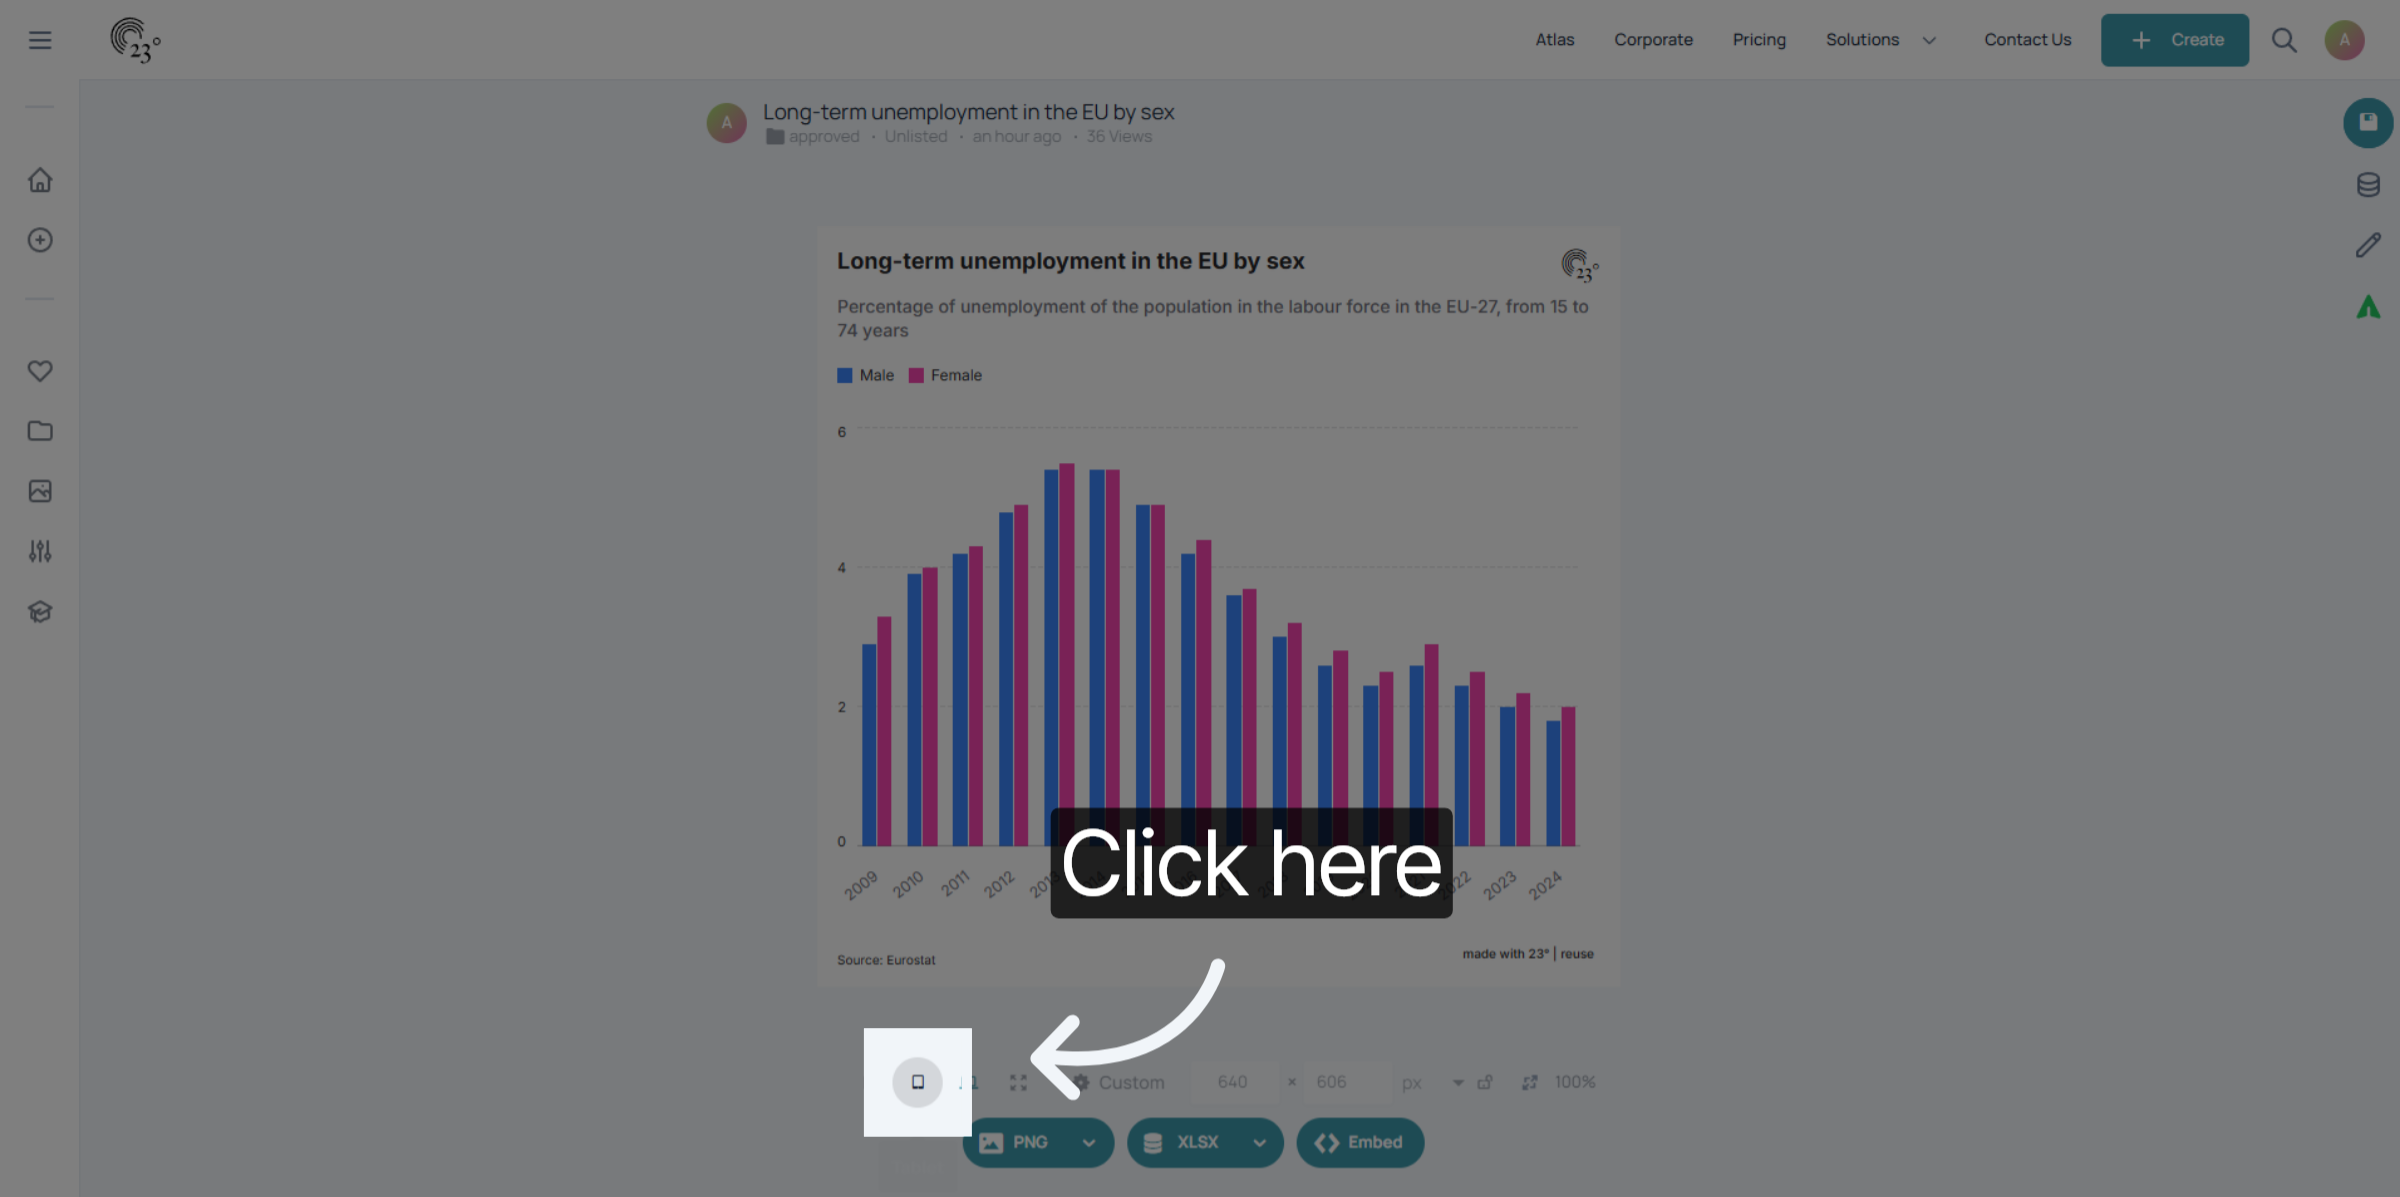
3. Tablet
Click on the tablet for a tablet preview.
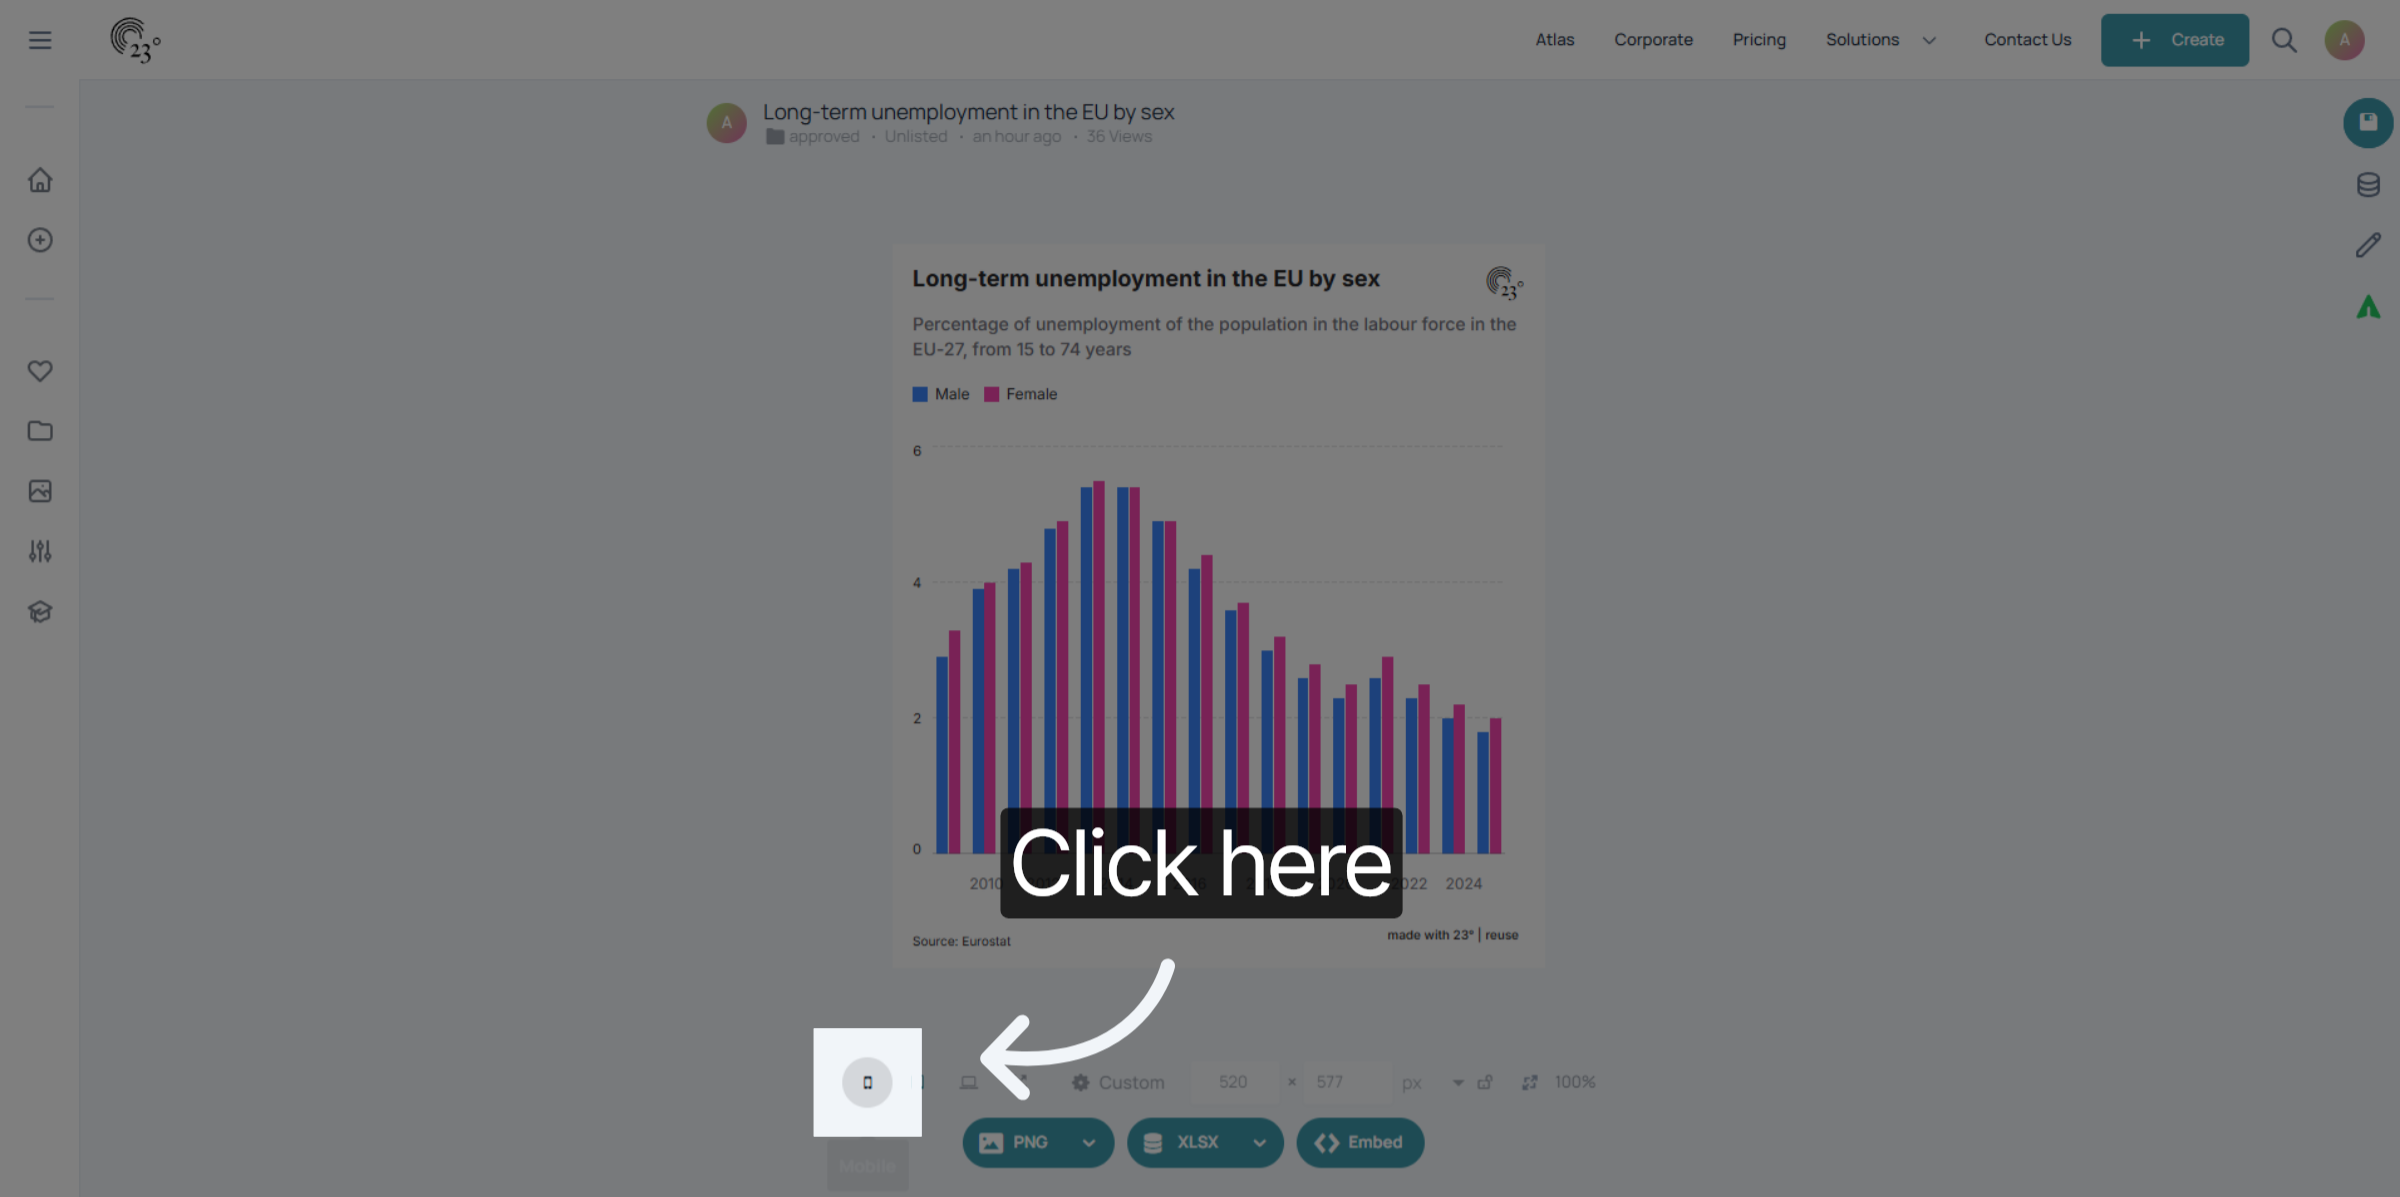
4. Mobile
and on mobile to see what your chart would look like on mobile devices.
You have successfully viewed the chart in different modes while editing, ensuring that your chart looks great on any device. For more insights check out other tutorials!