Configure Value Axis And Custom Values In 23degrees
This tutorial guides you through configuring the value axis and setting custom values in 23degrees.
You will learn how to enable and customize axis settings to tailor your chart display.
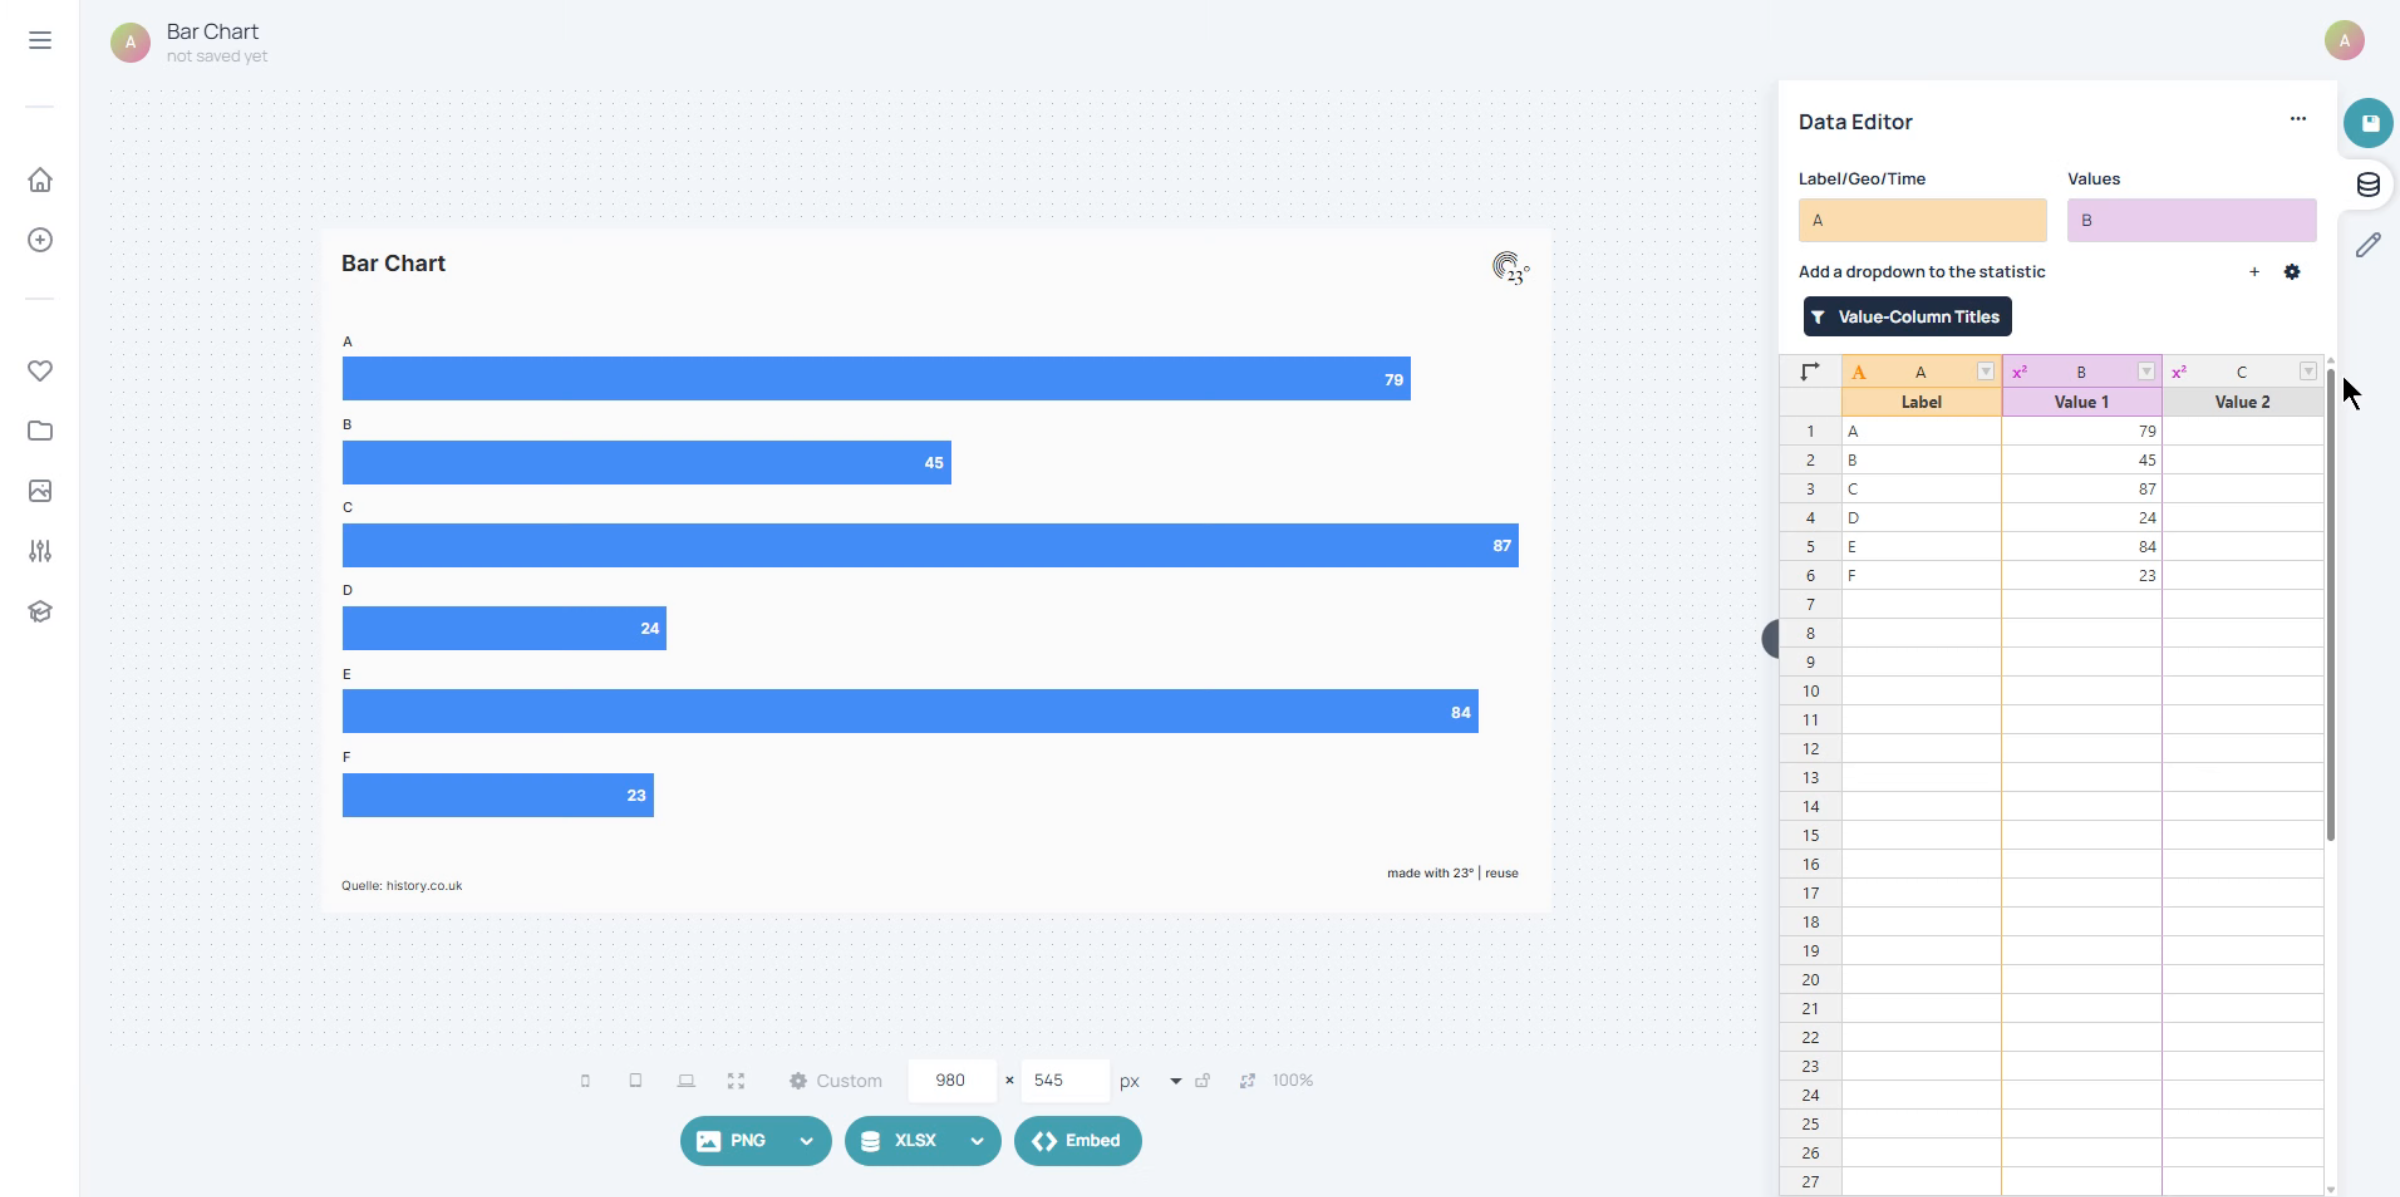
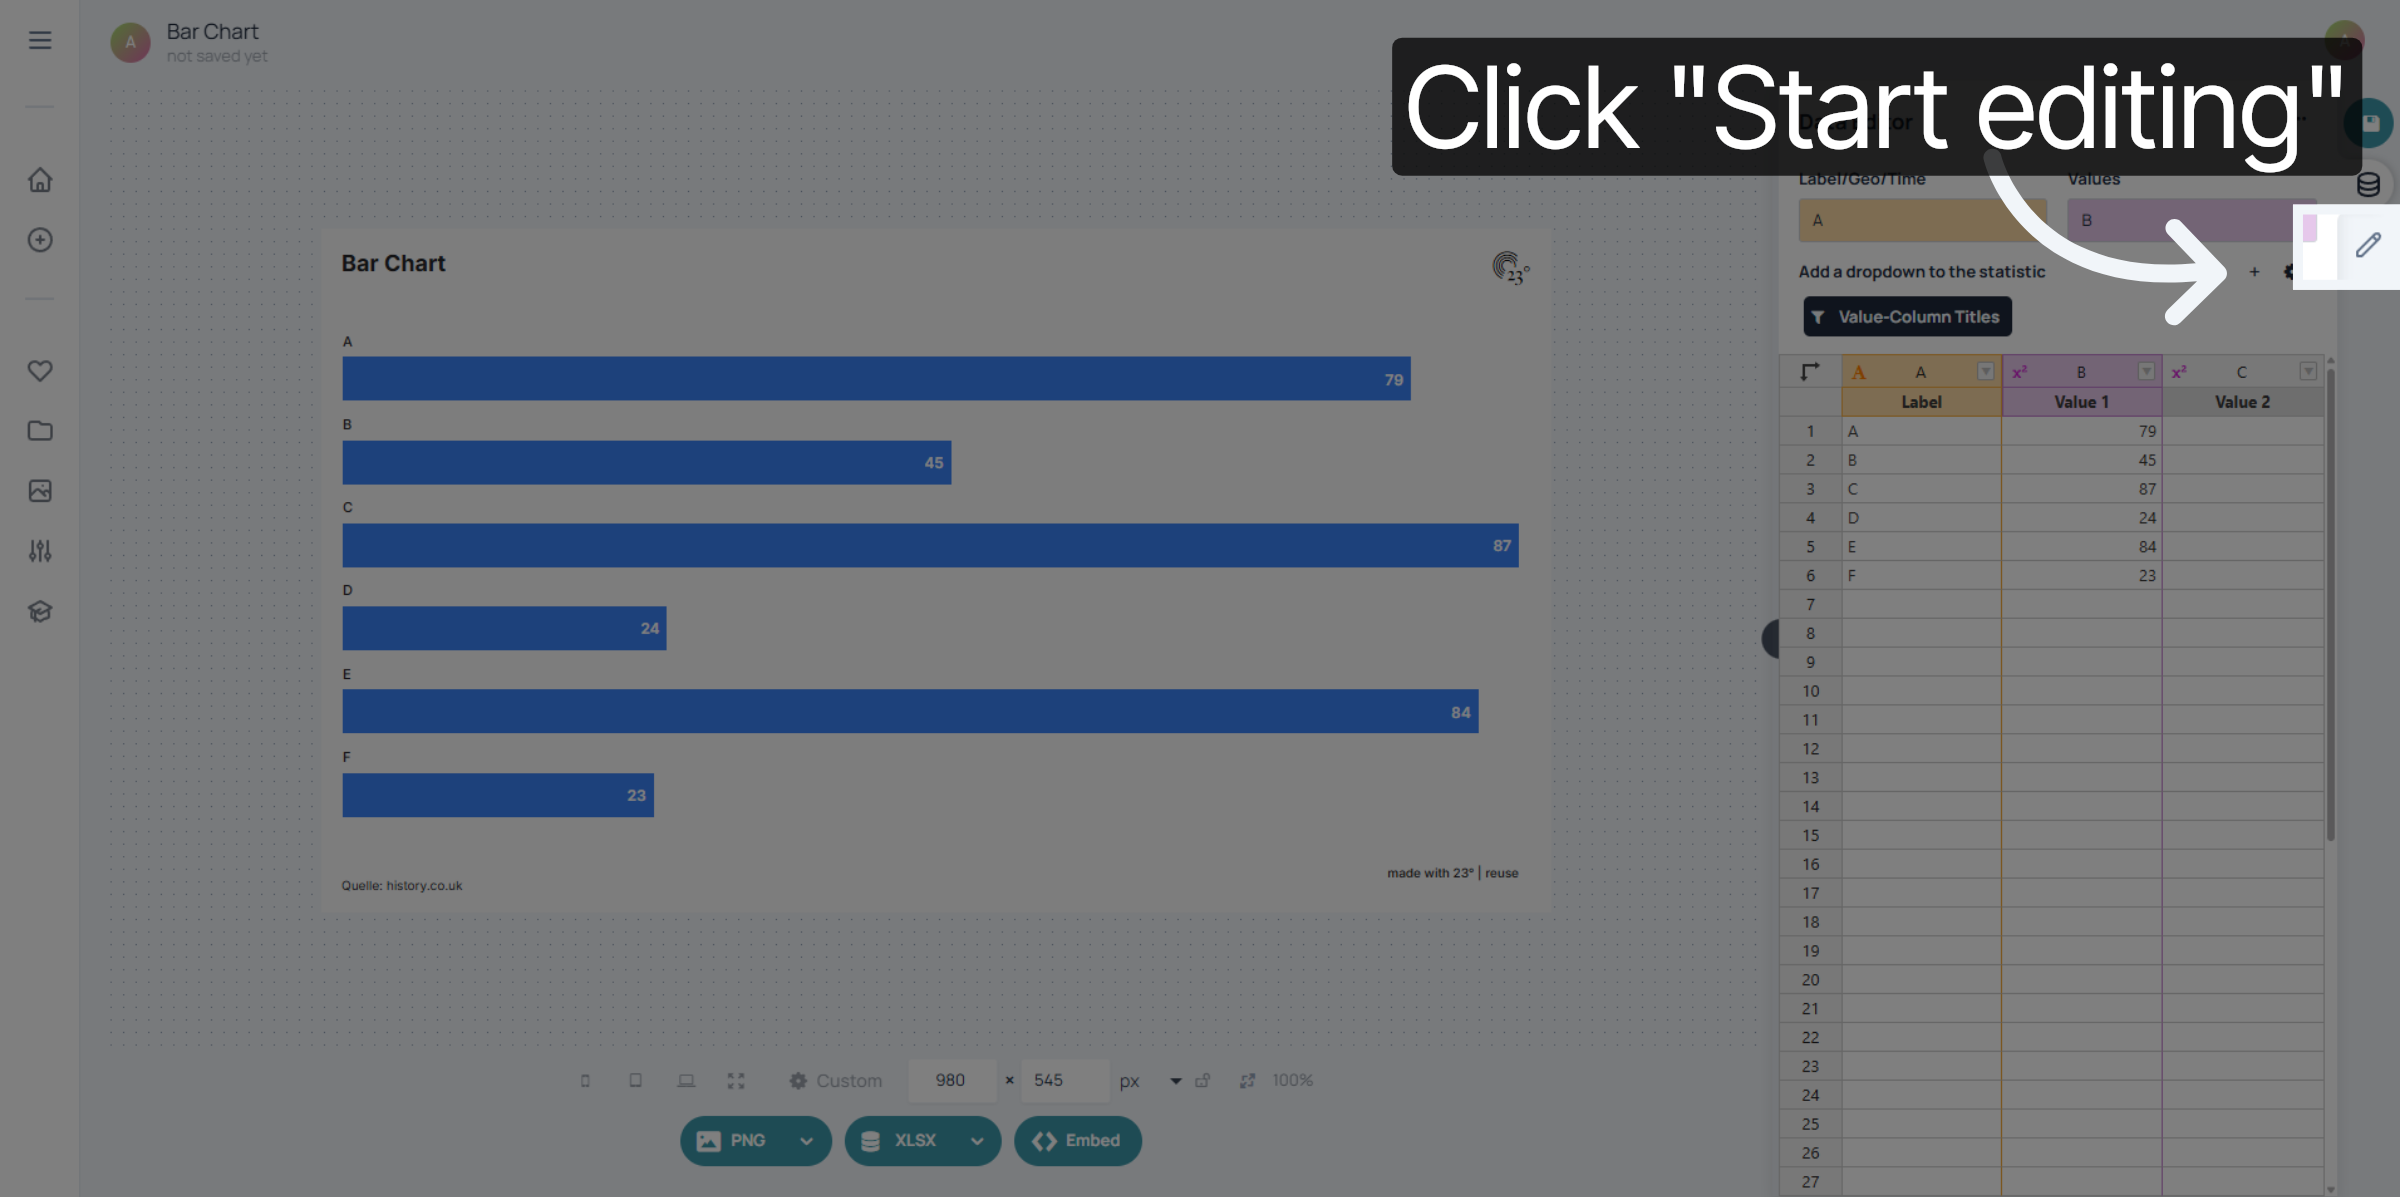
Click the Start editing button to begin modifying your chart settings.
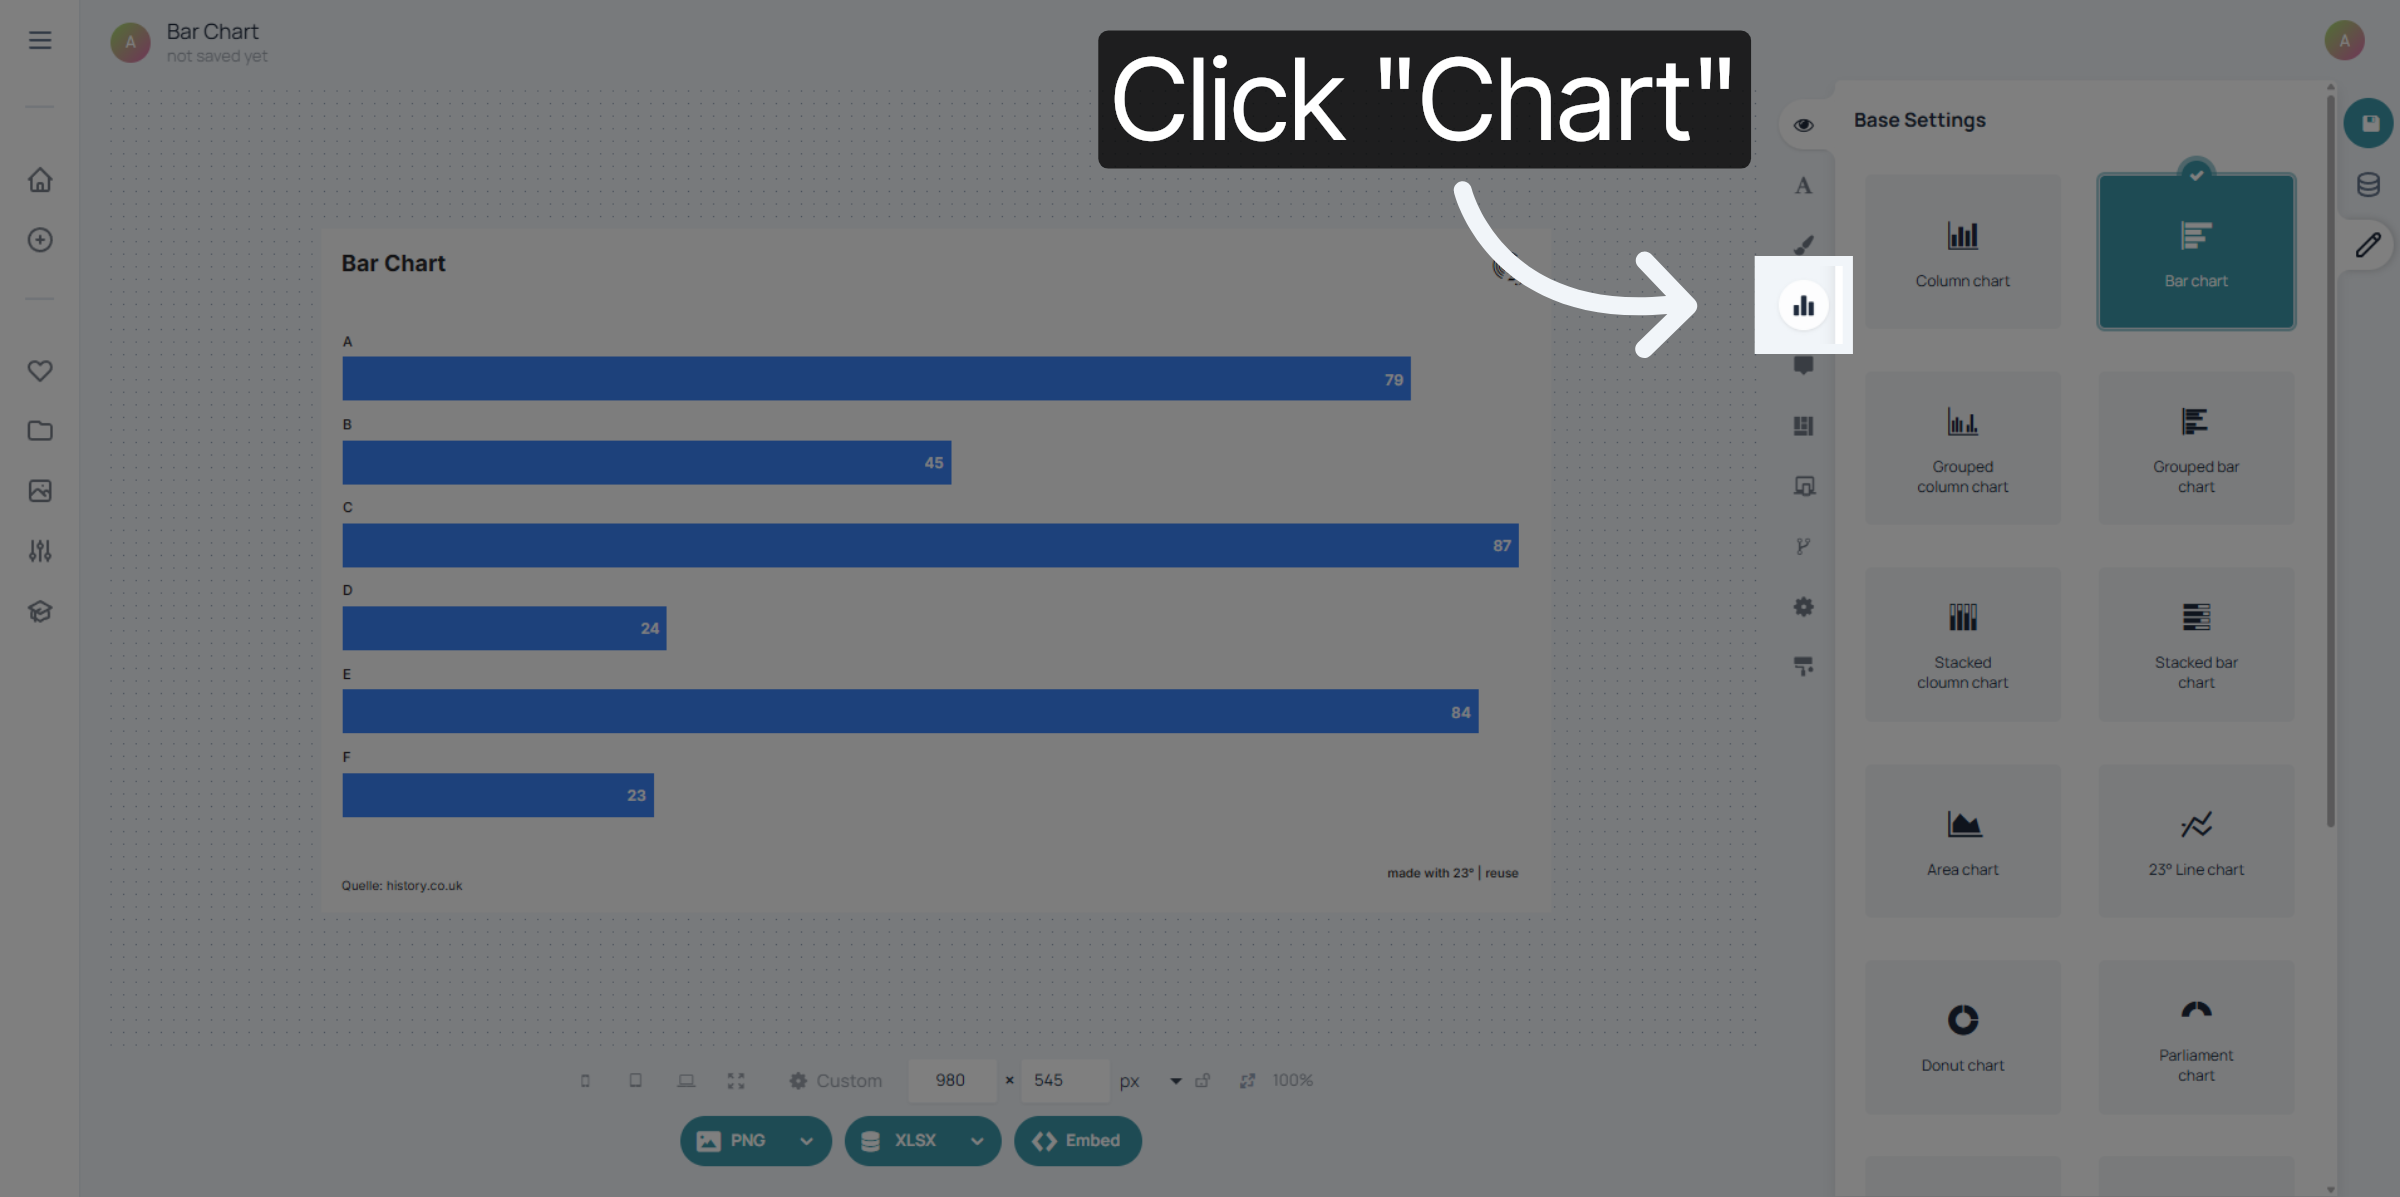
Click the Chart menu to access chart configuration options.
Click the Value axis option to open the axis customization settings.
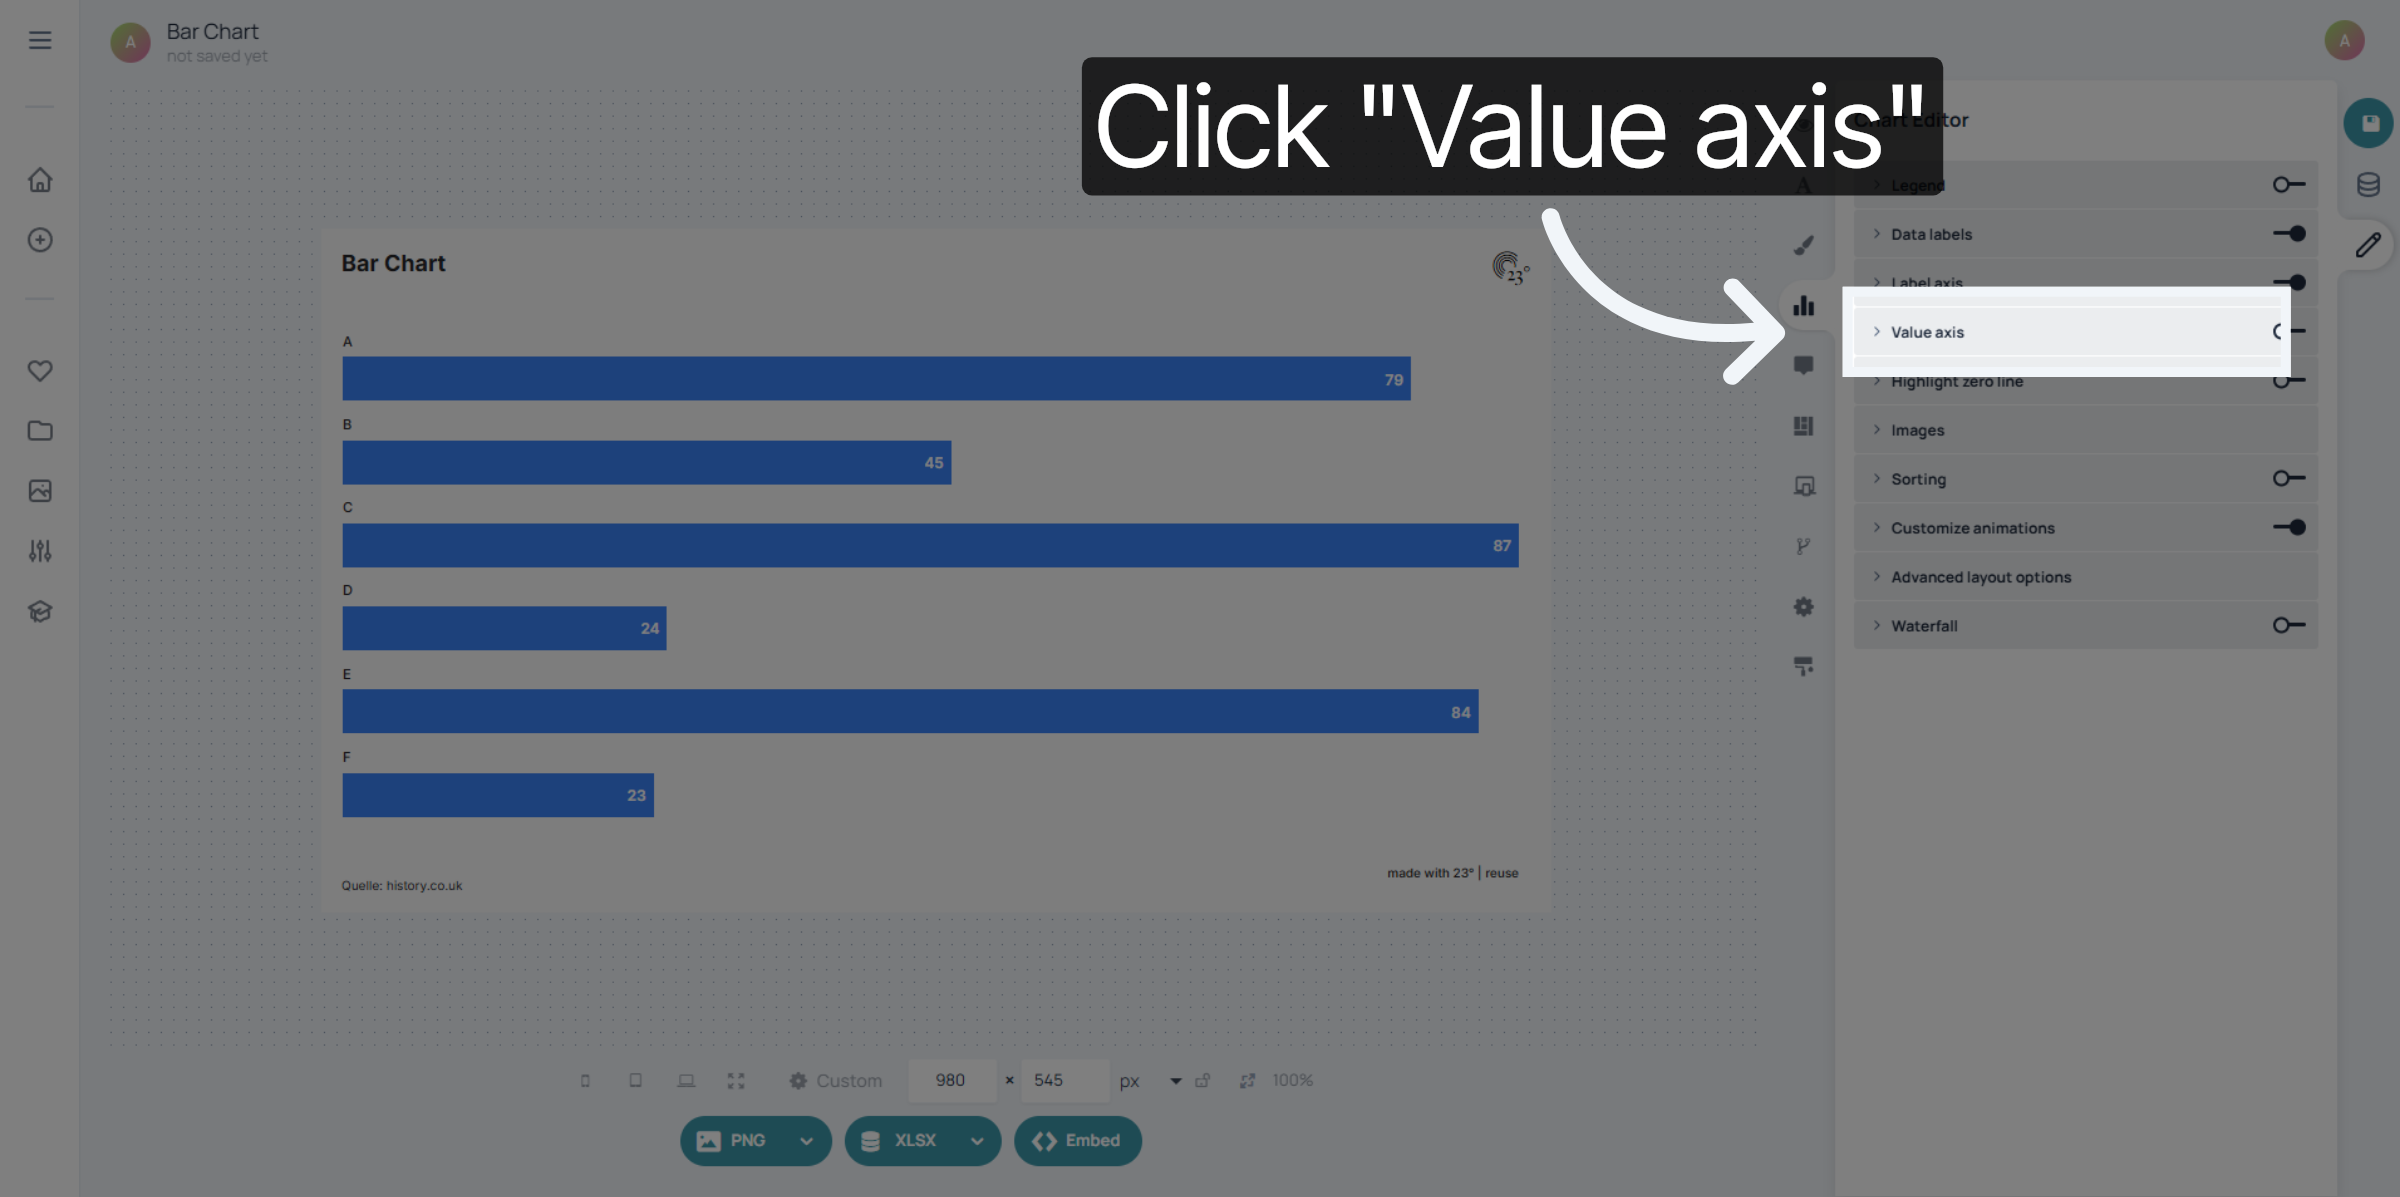
Click the toggle to turn the value axis on.
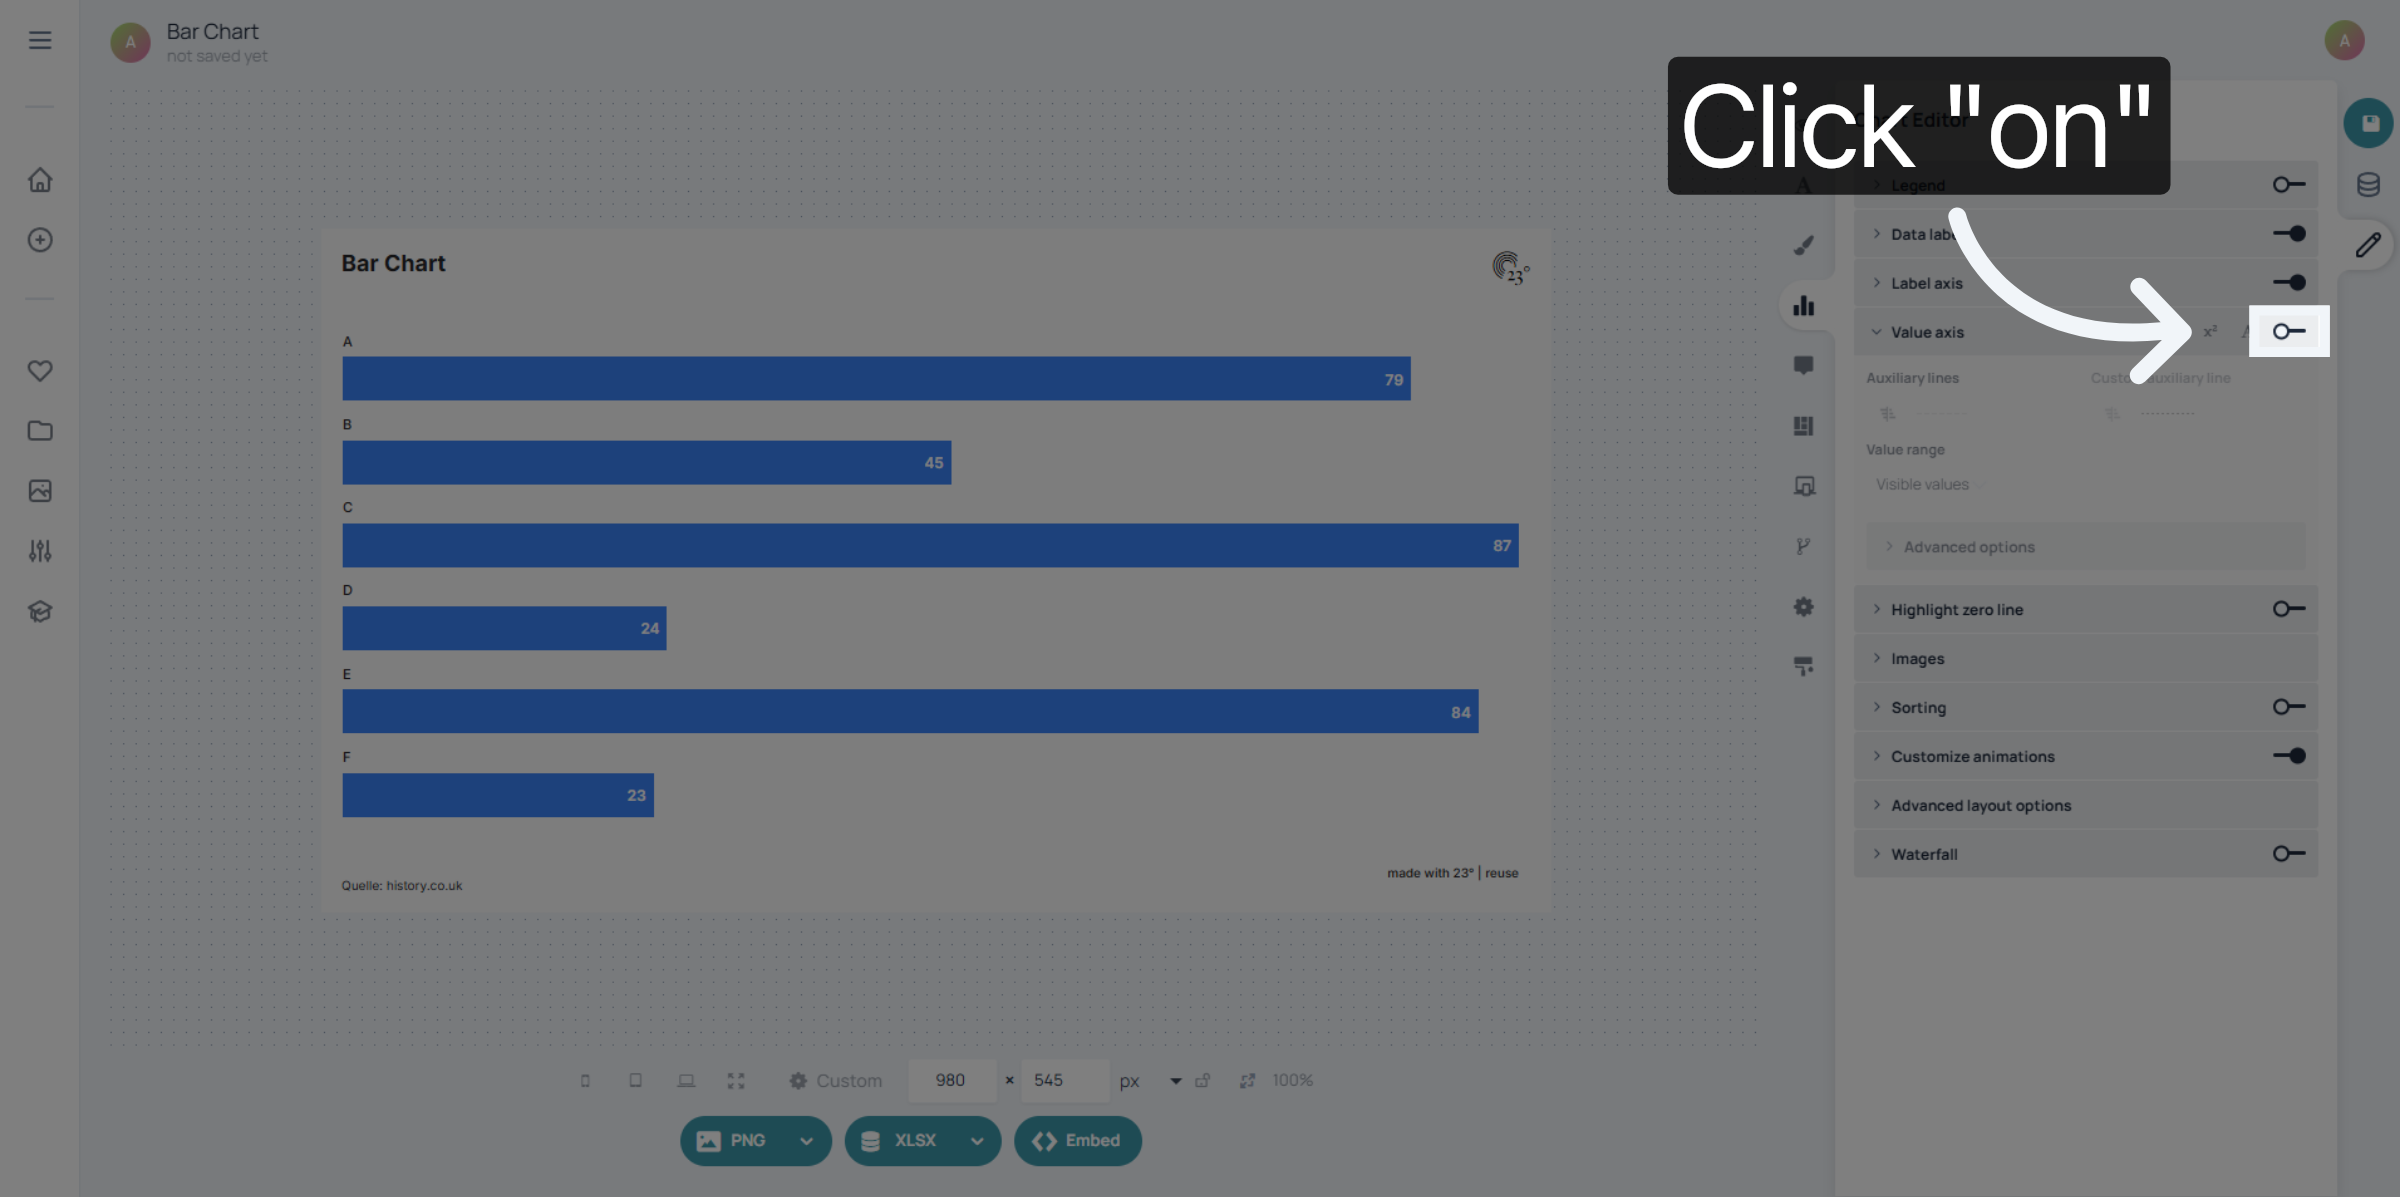
Fill the value axis toggle to confirm it is enabled.
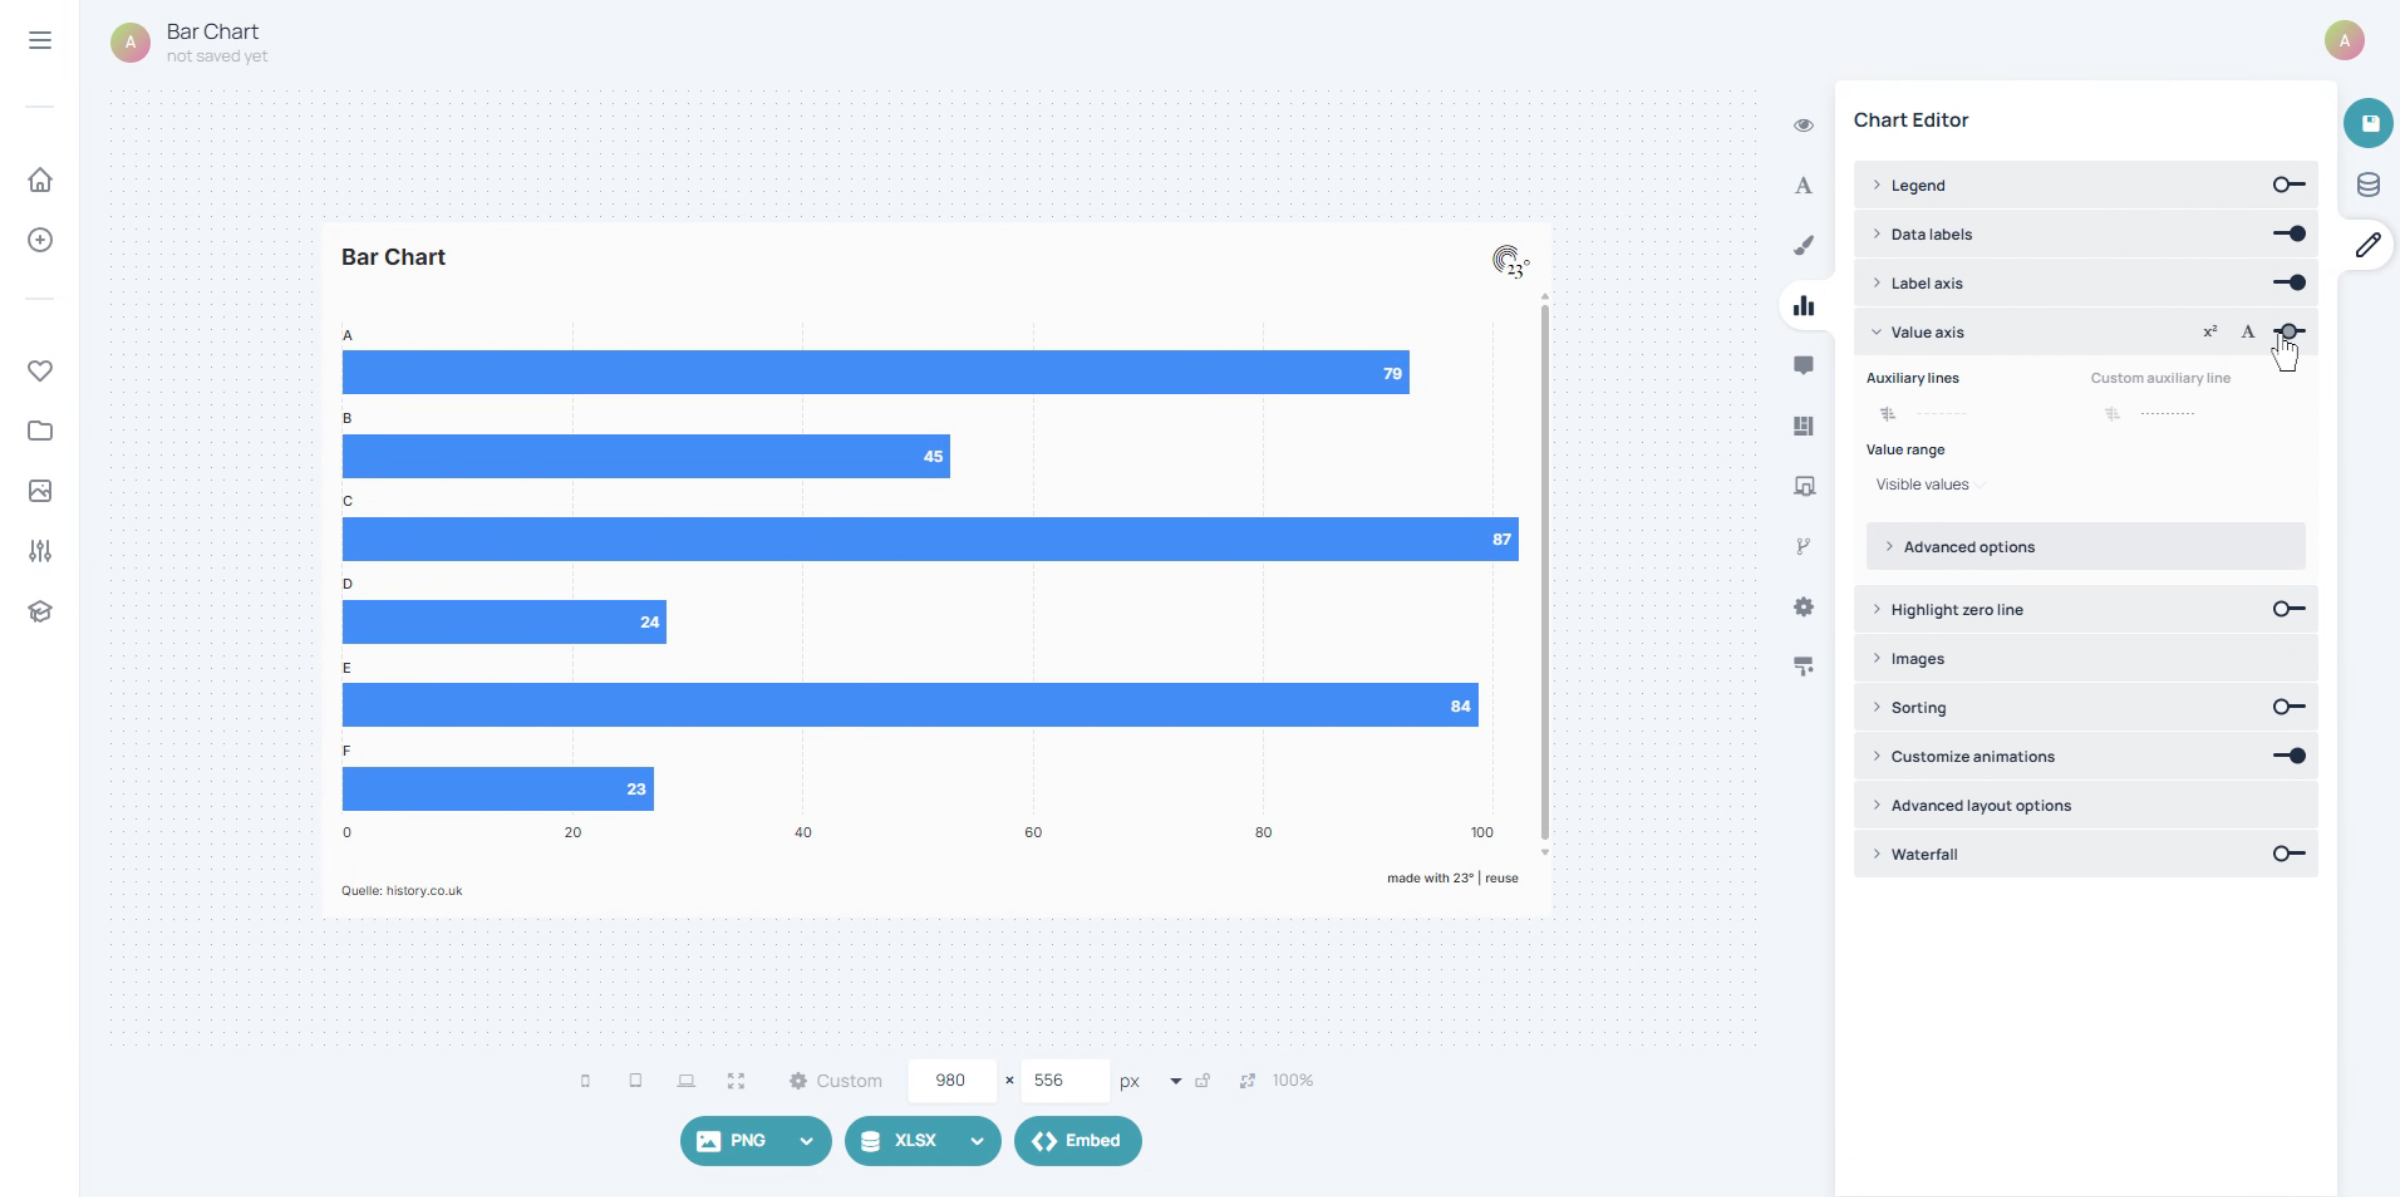
Click the axis scale settings to adjust the scale parameters.
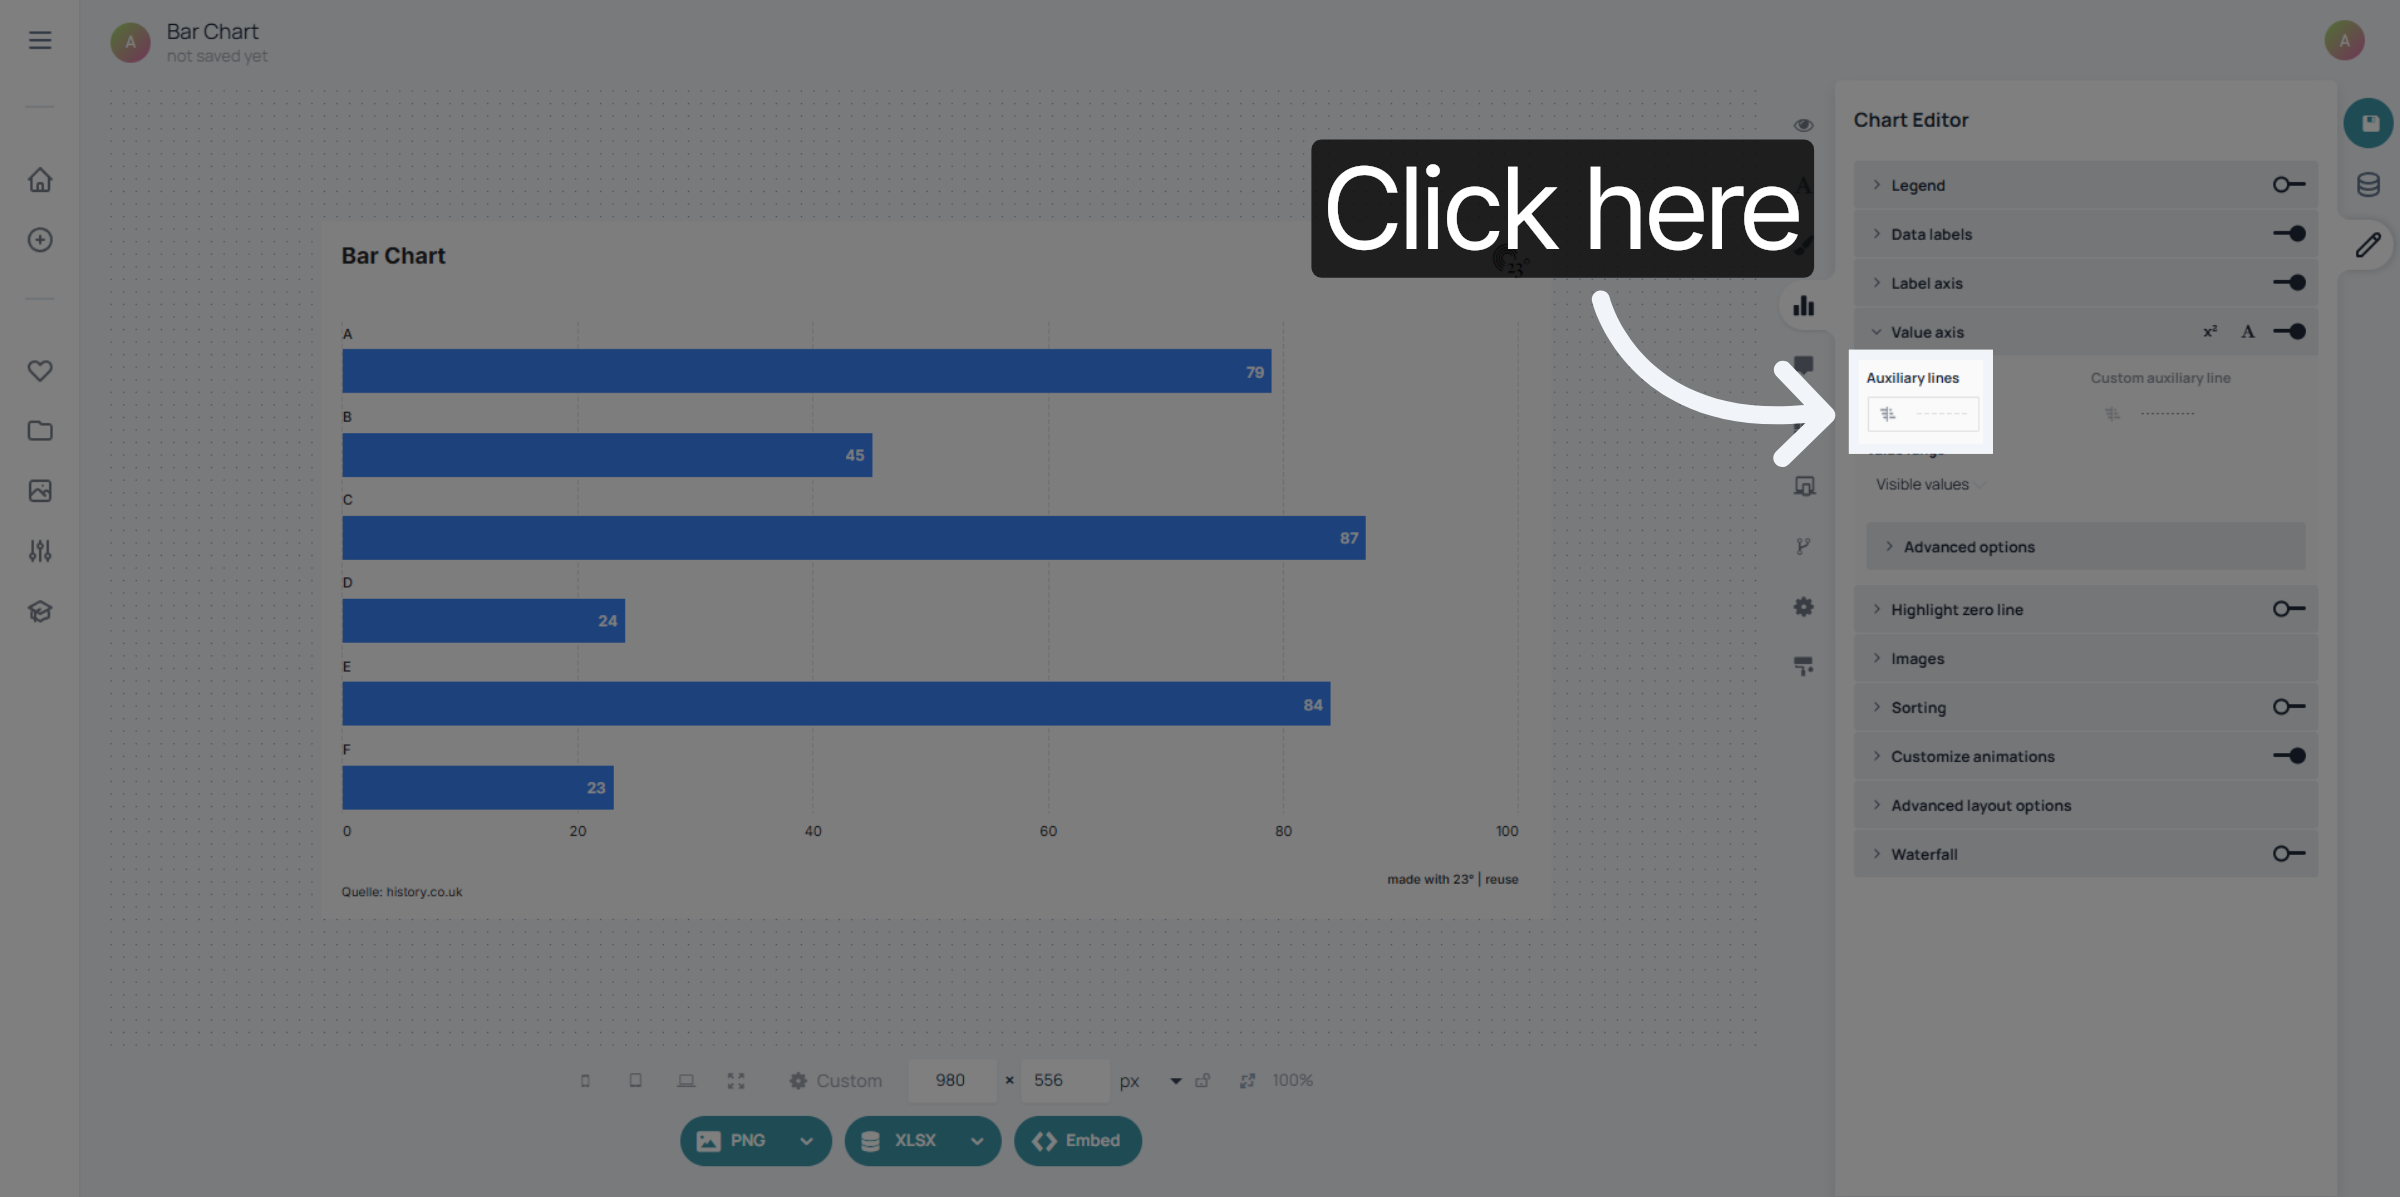
Enter the number of lines you want to display.
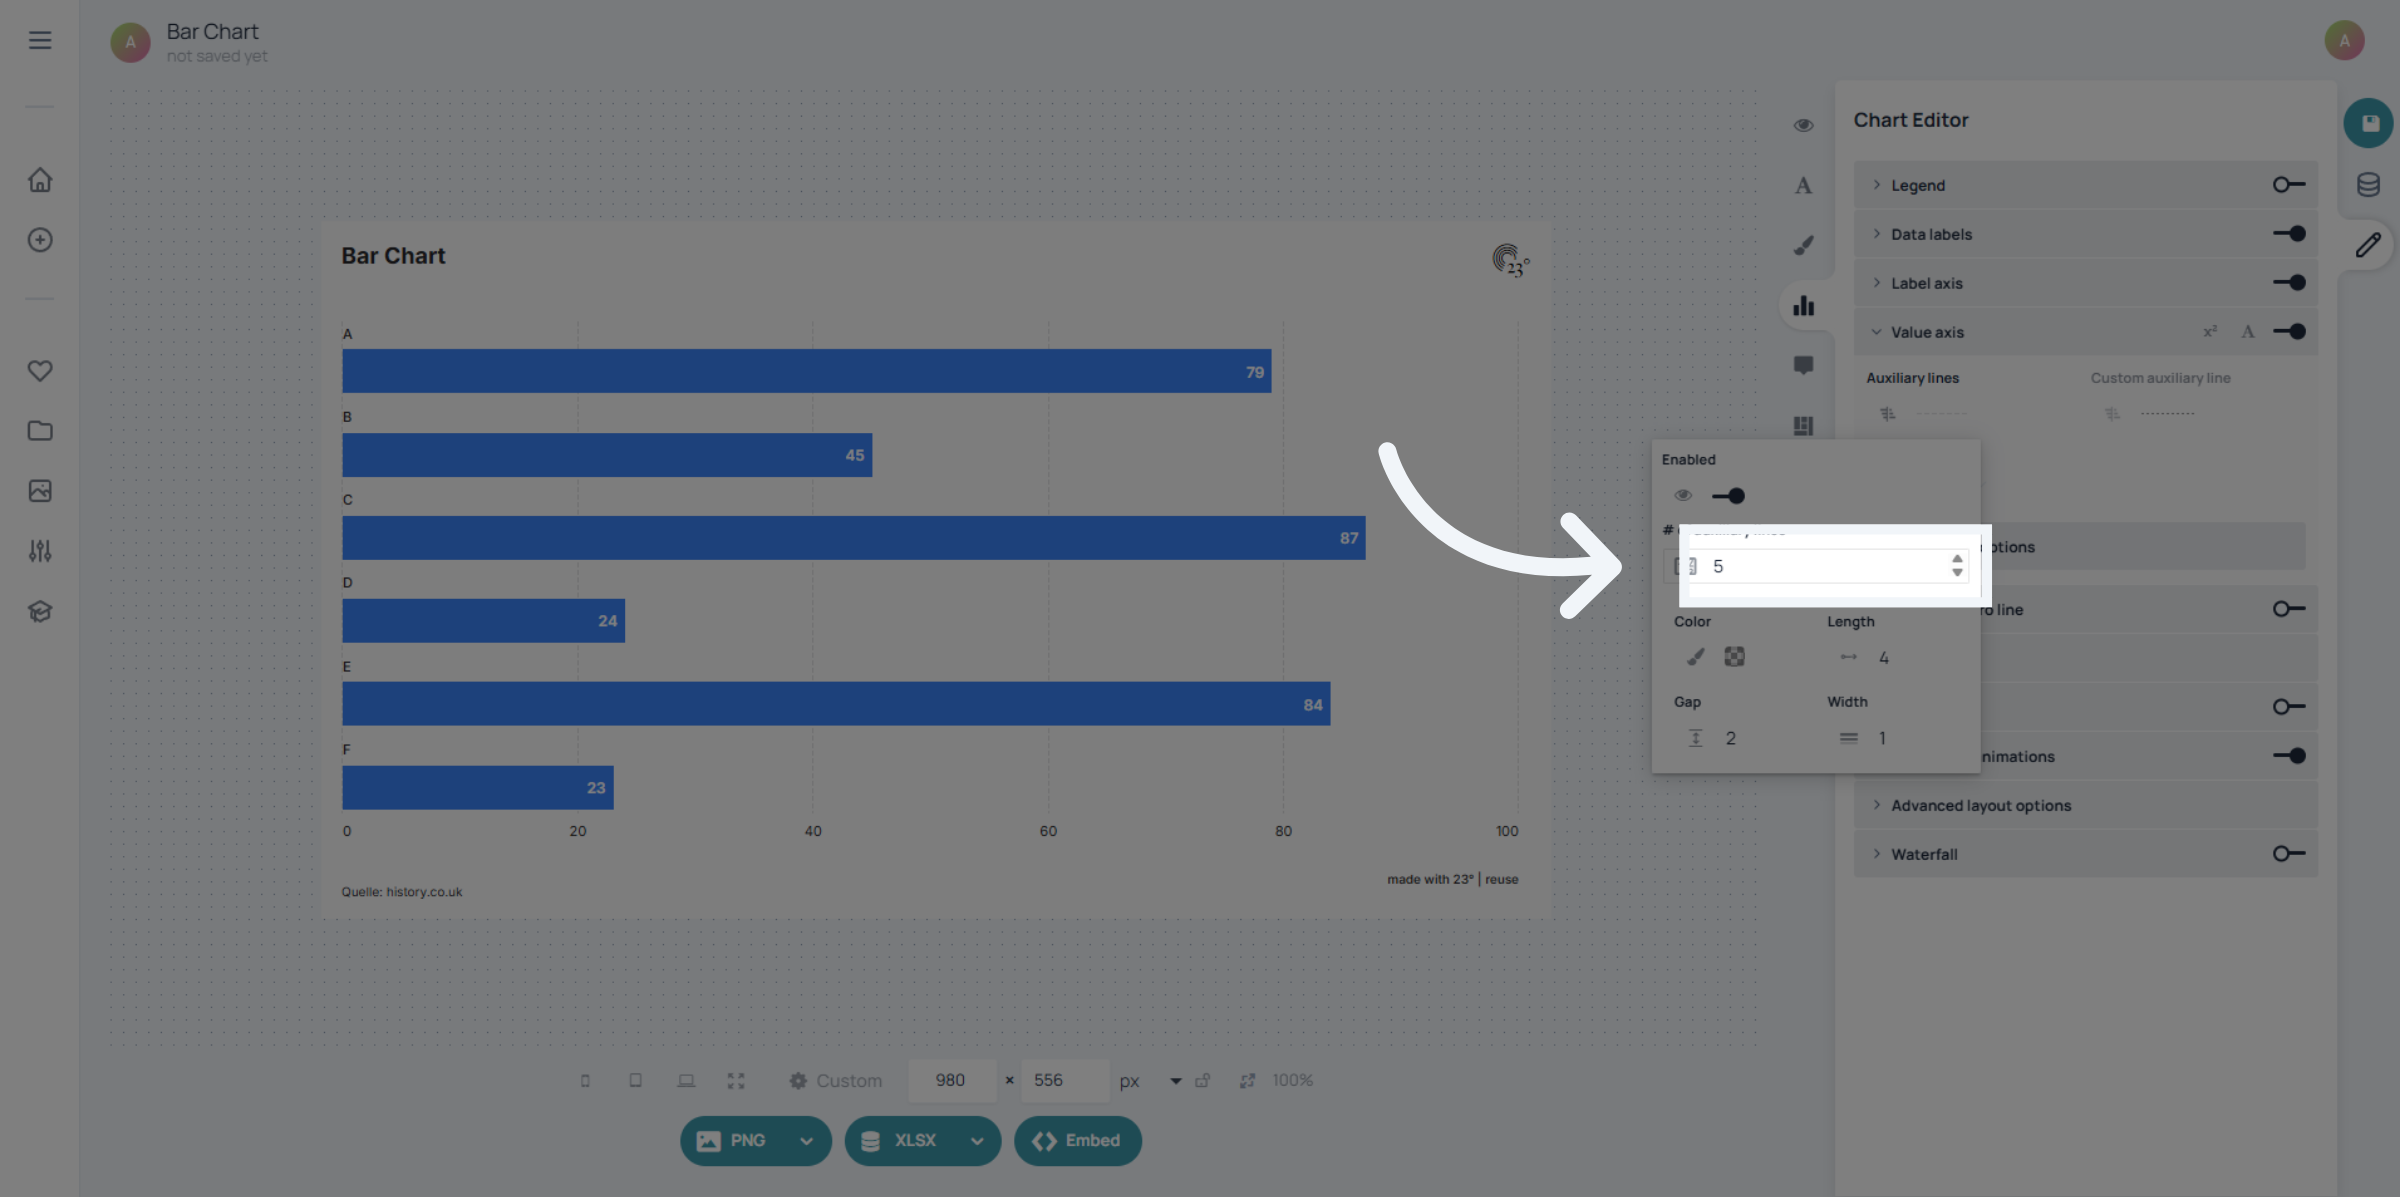
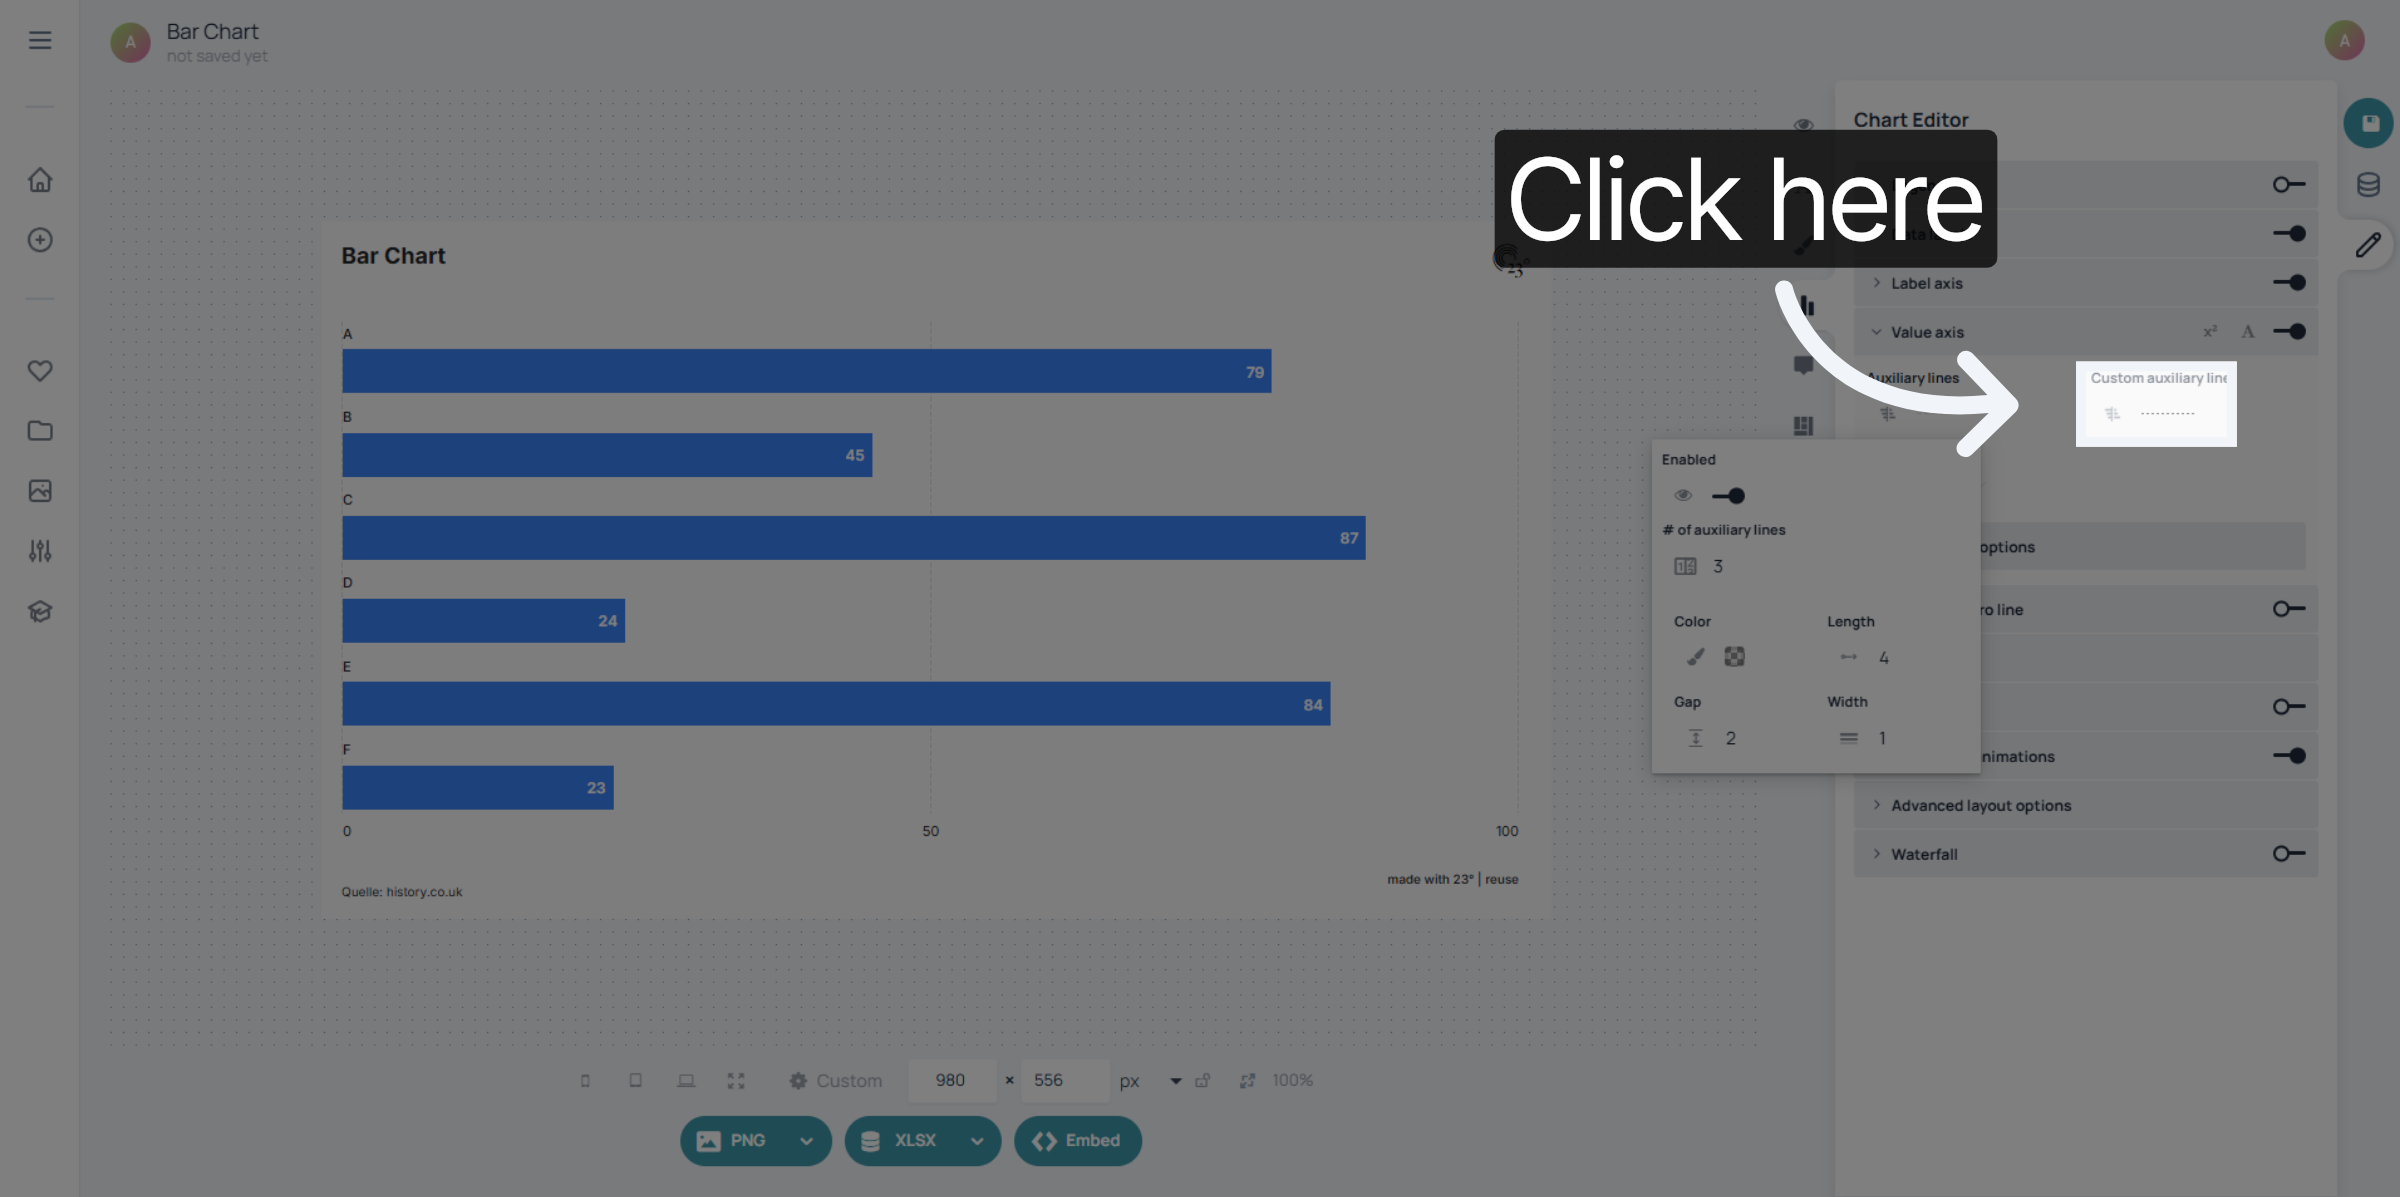
Click here to set custom auxiliary line values.
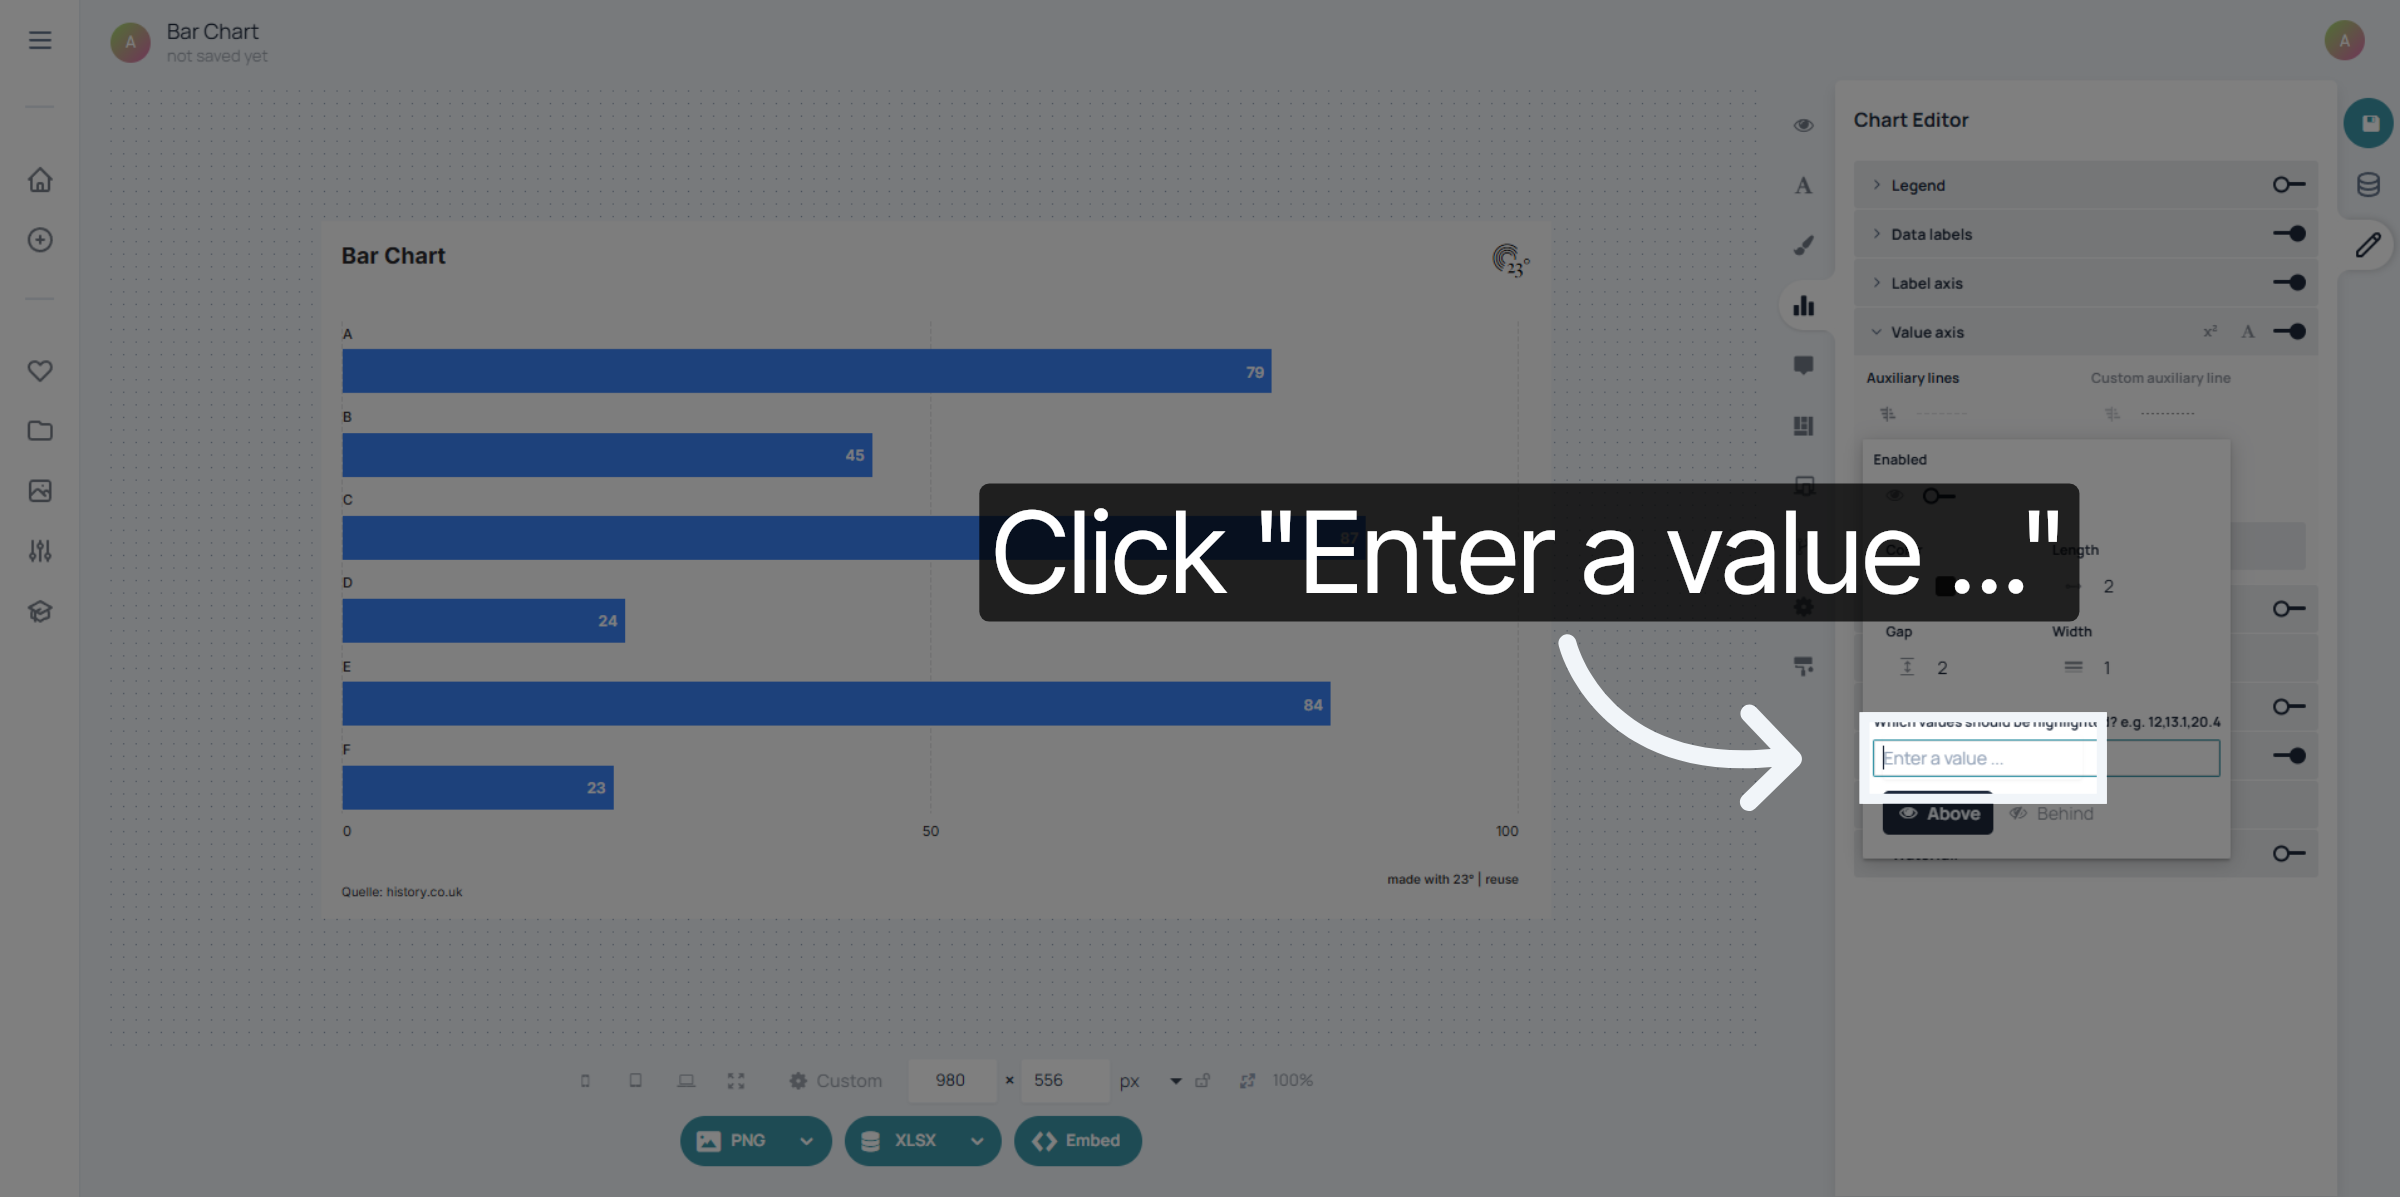
Enter a custom value. You can add multiple custom values but you have to separate them by a comma.
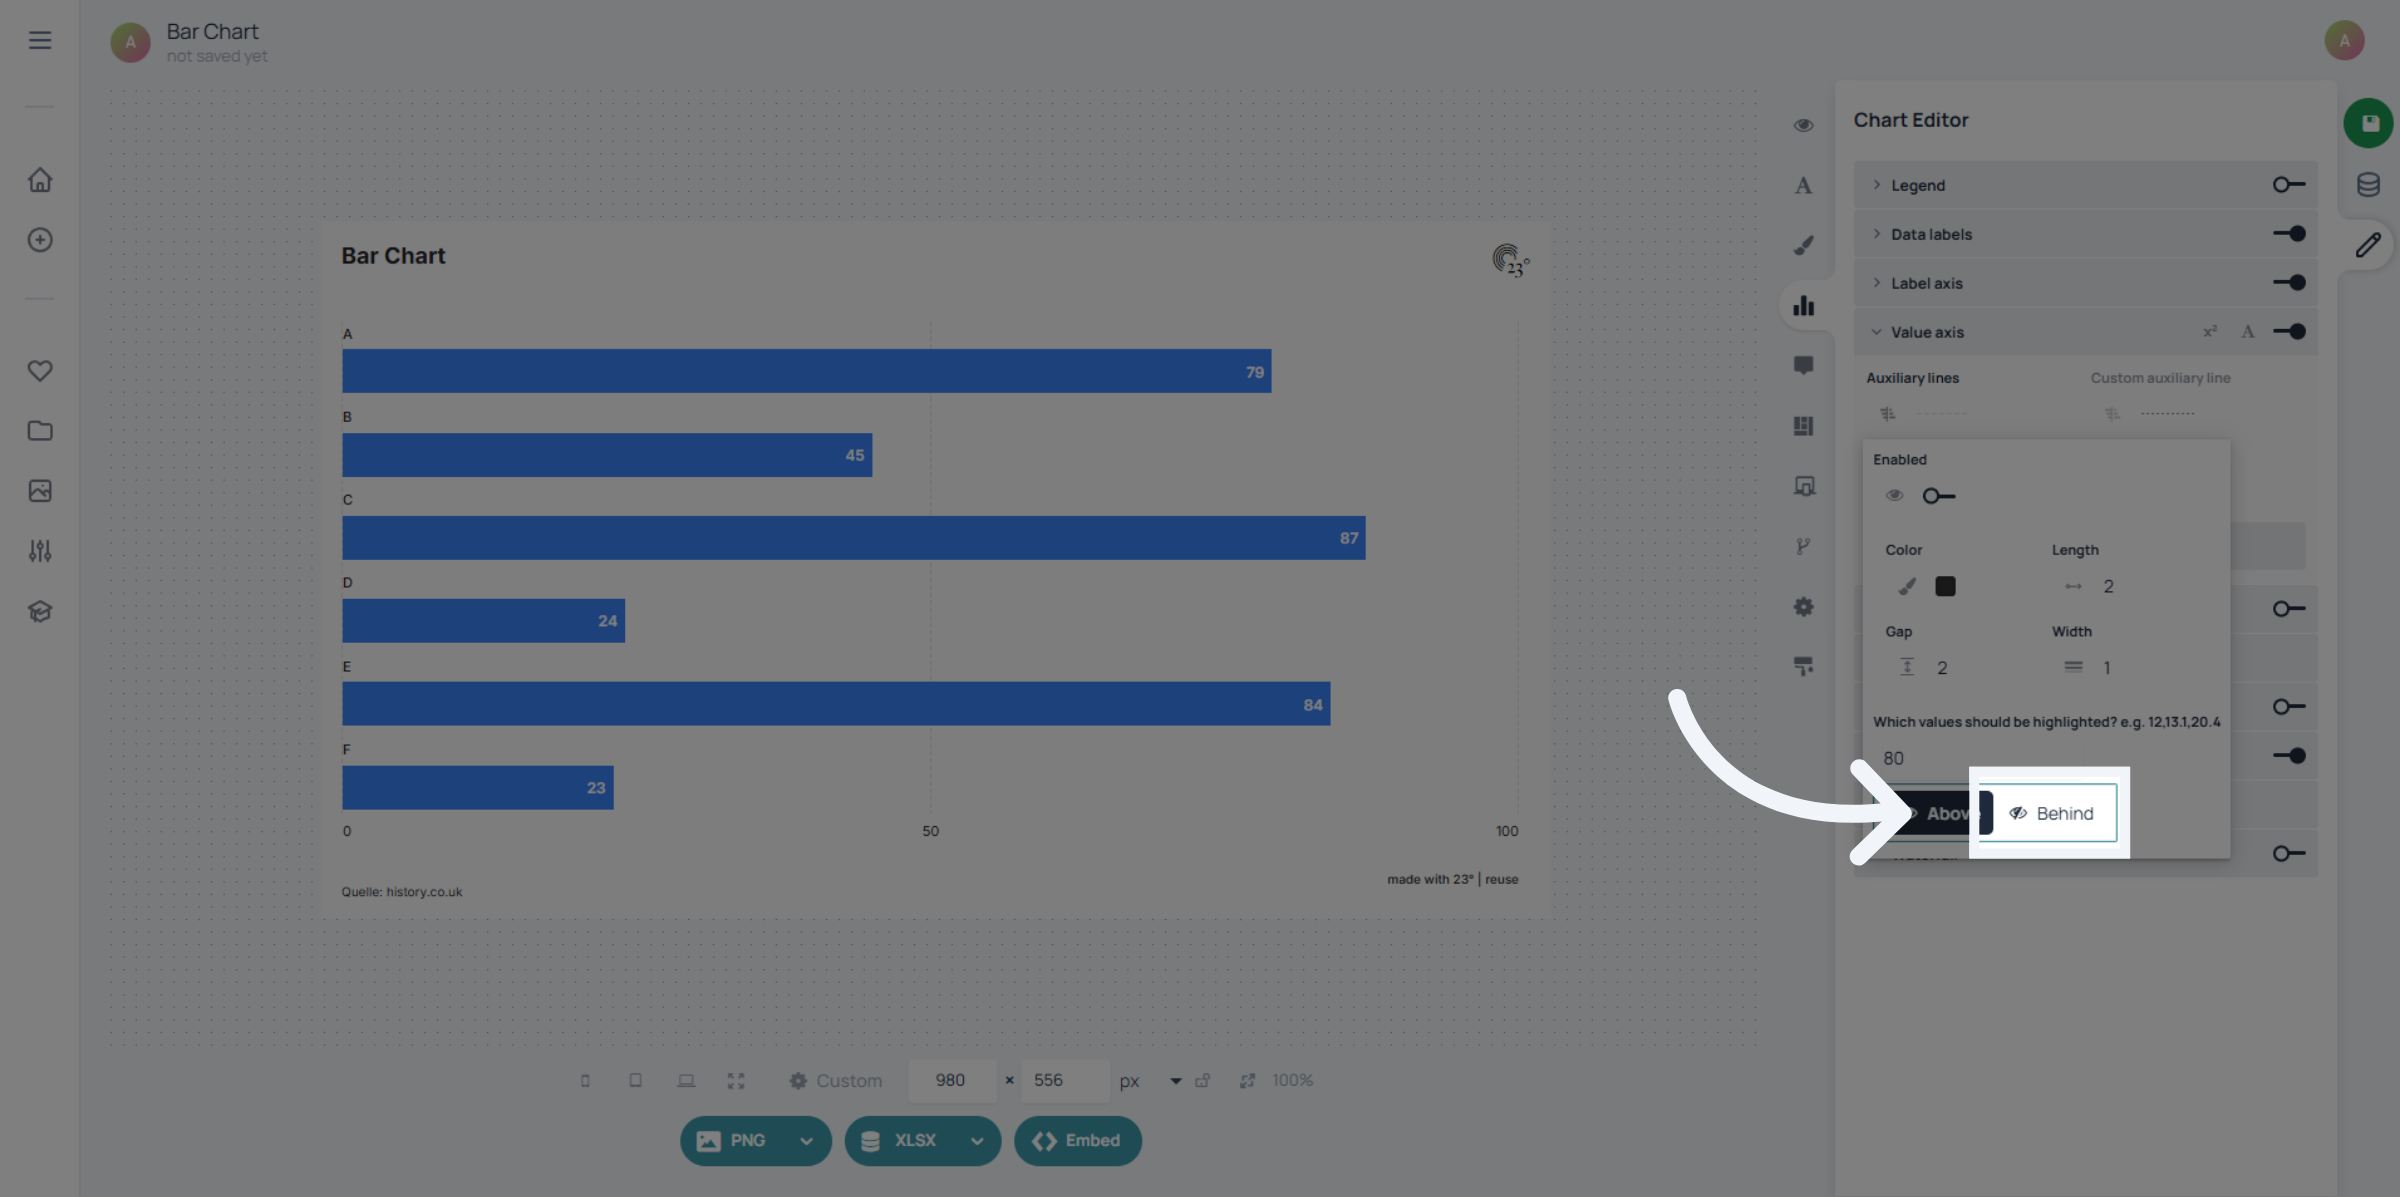
Select your axis position here. It can either be above or behind the bar.
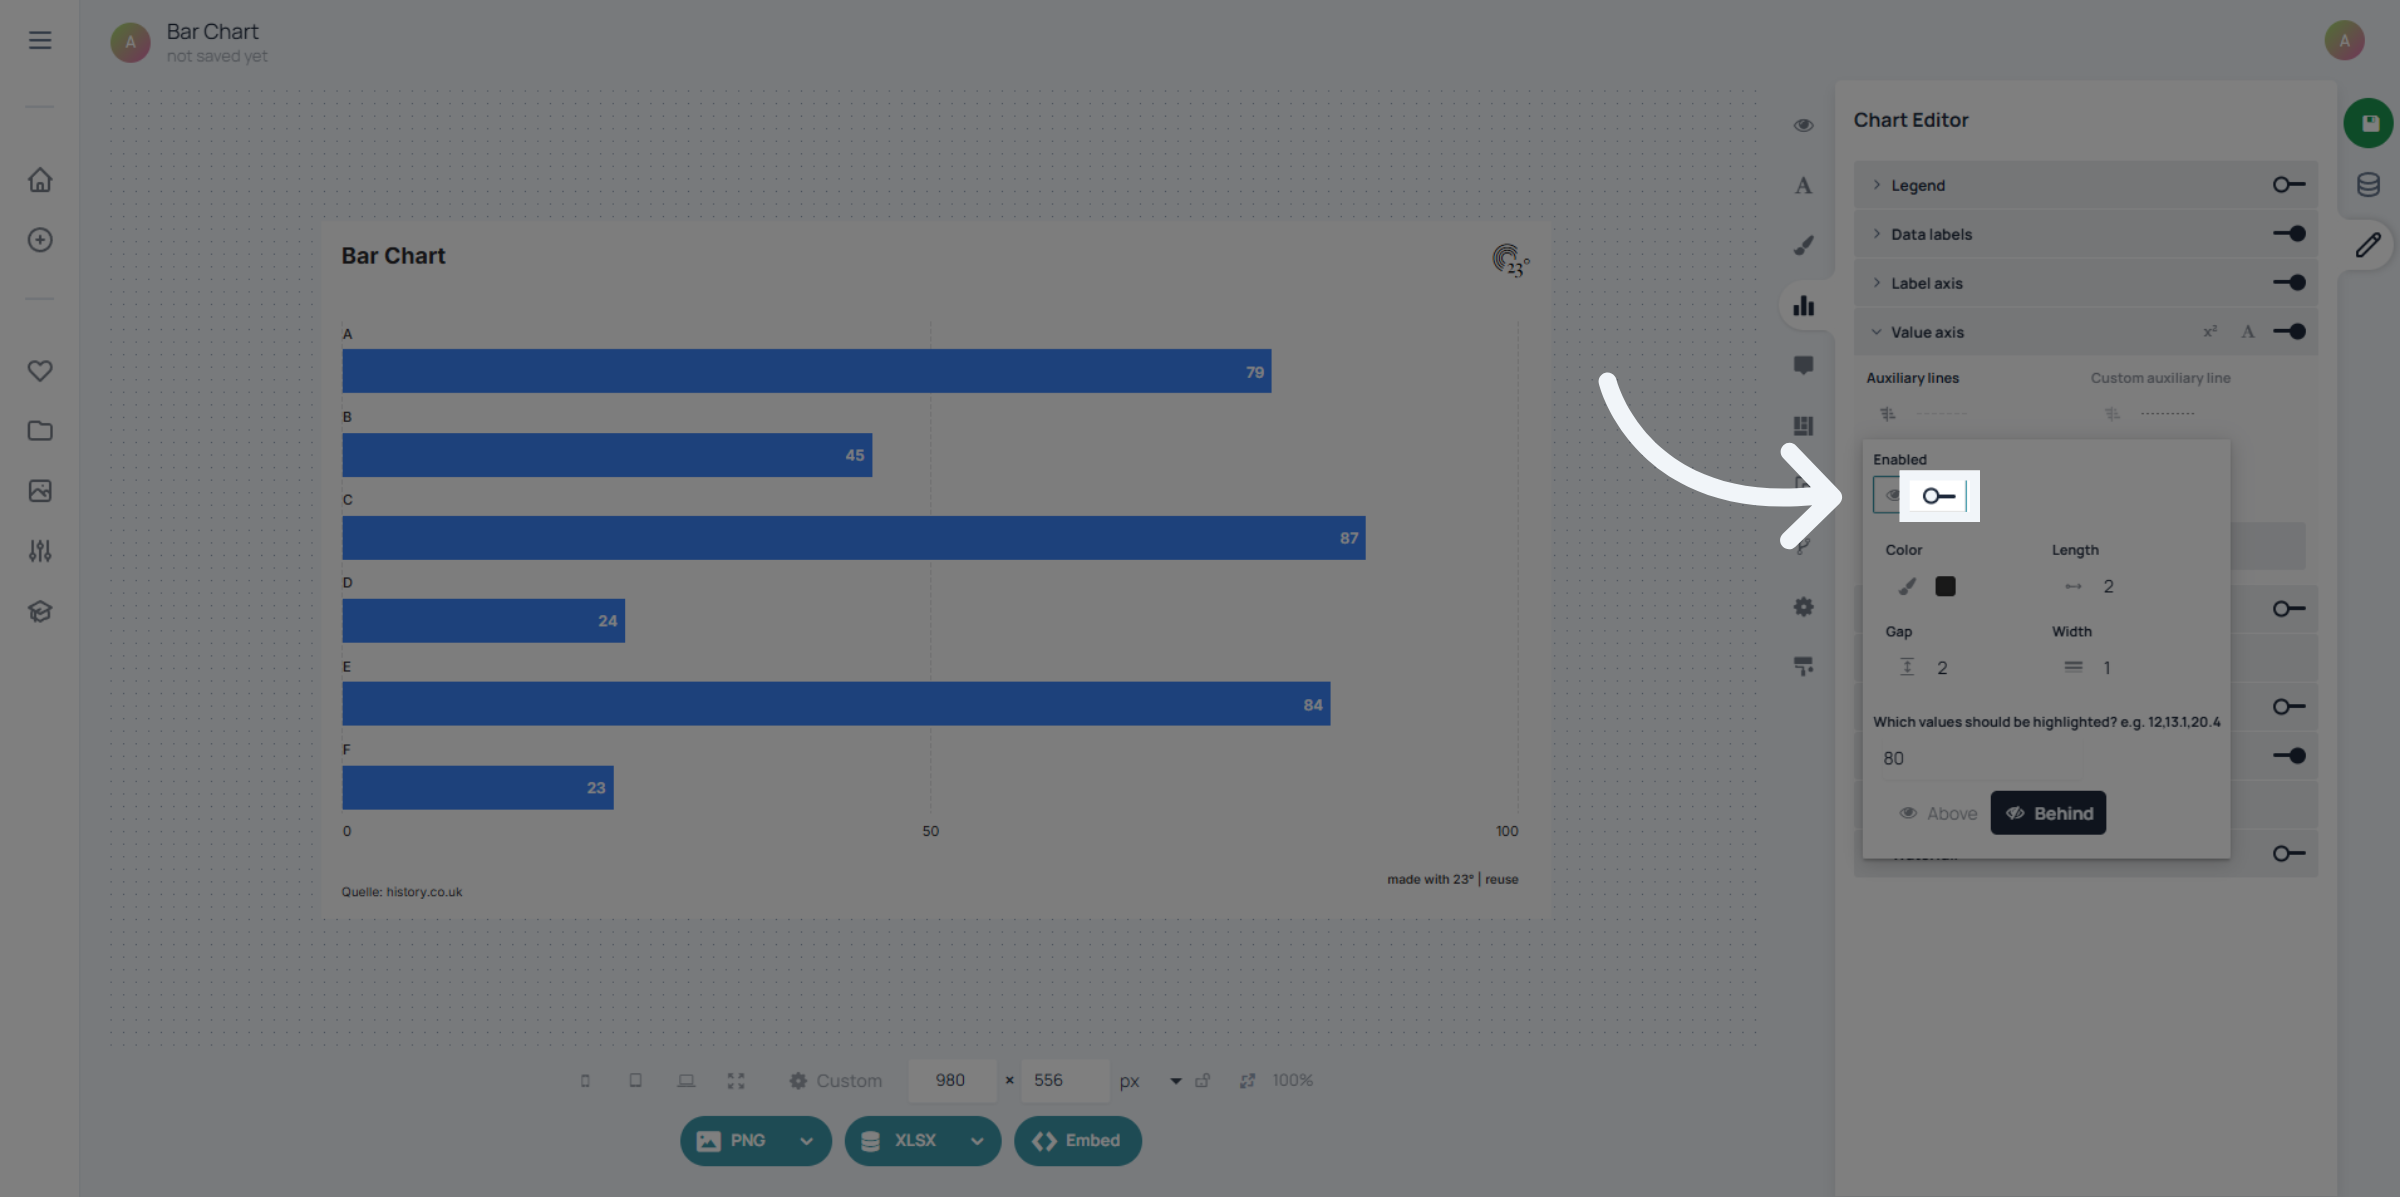
Dont forget to enable your axis by enabling it here.
You have successfully configured the value axis and set custom values in 23degrees. Your chart now reflects the customized axis settings for improved data visualization.