How to style the legend in a Choropleth Map
This tutorial will show you how to style the legend of a Choropleth Map.
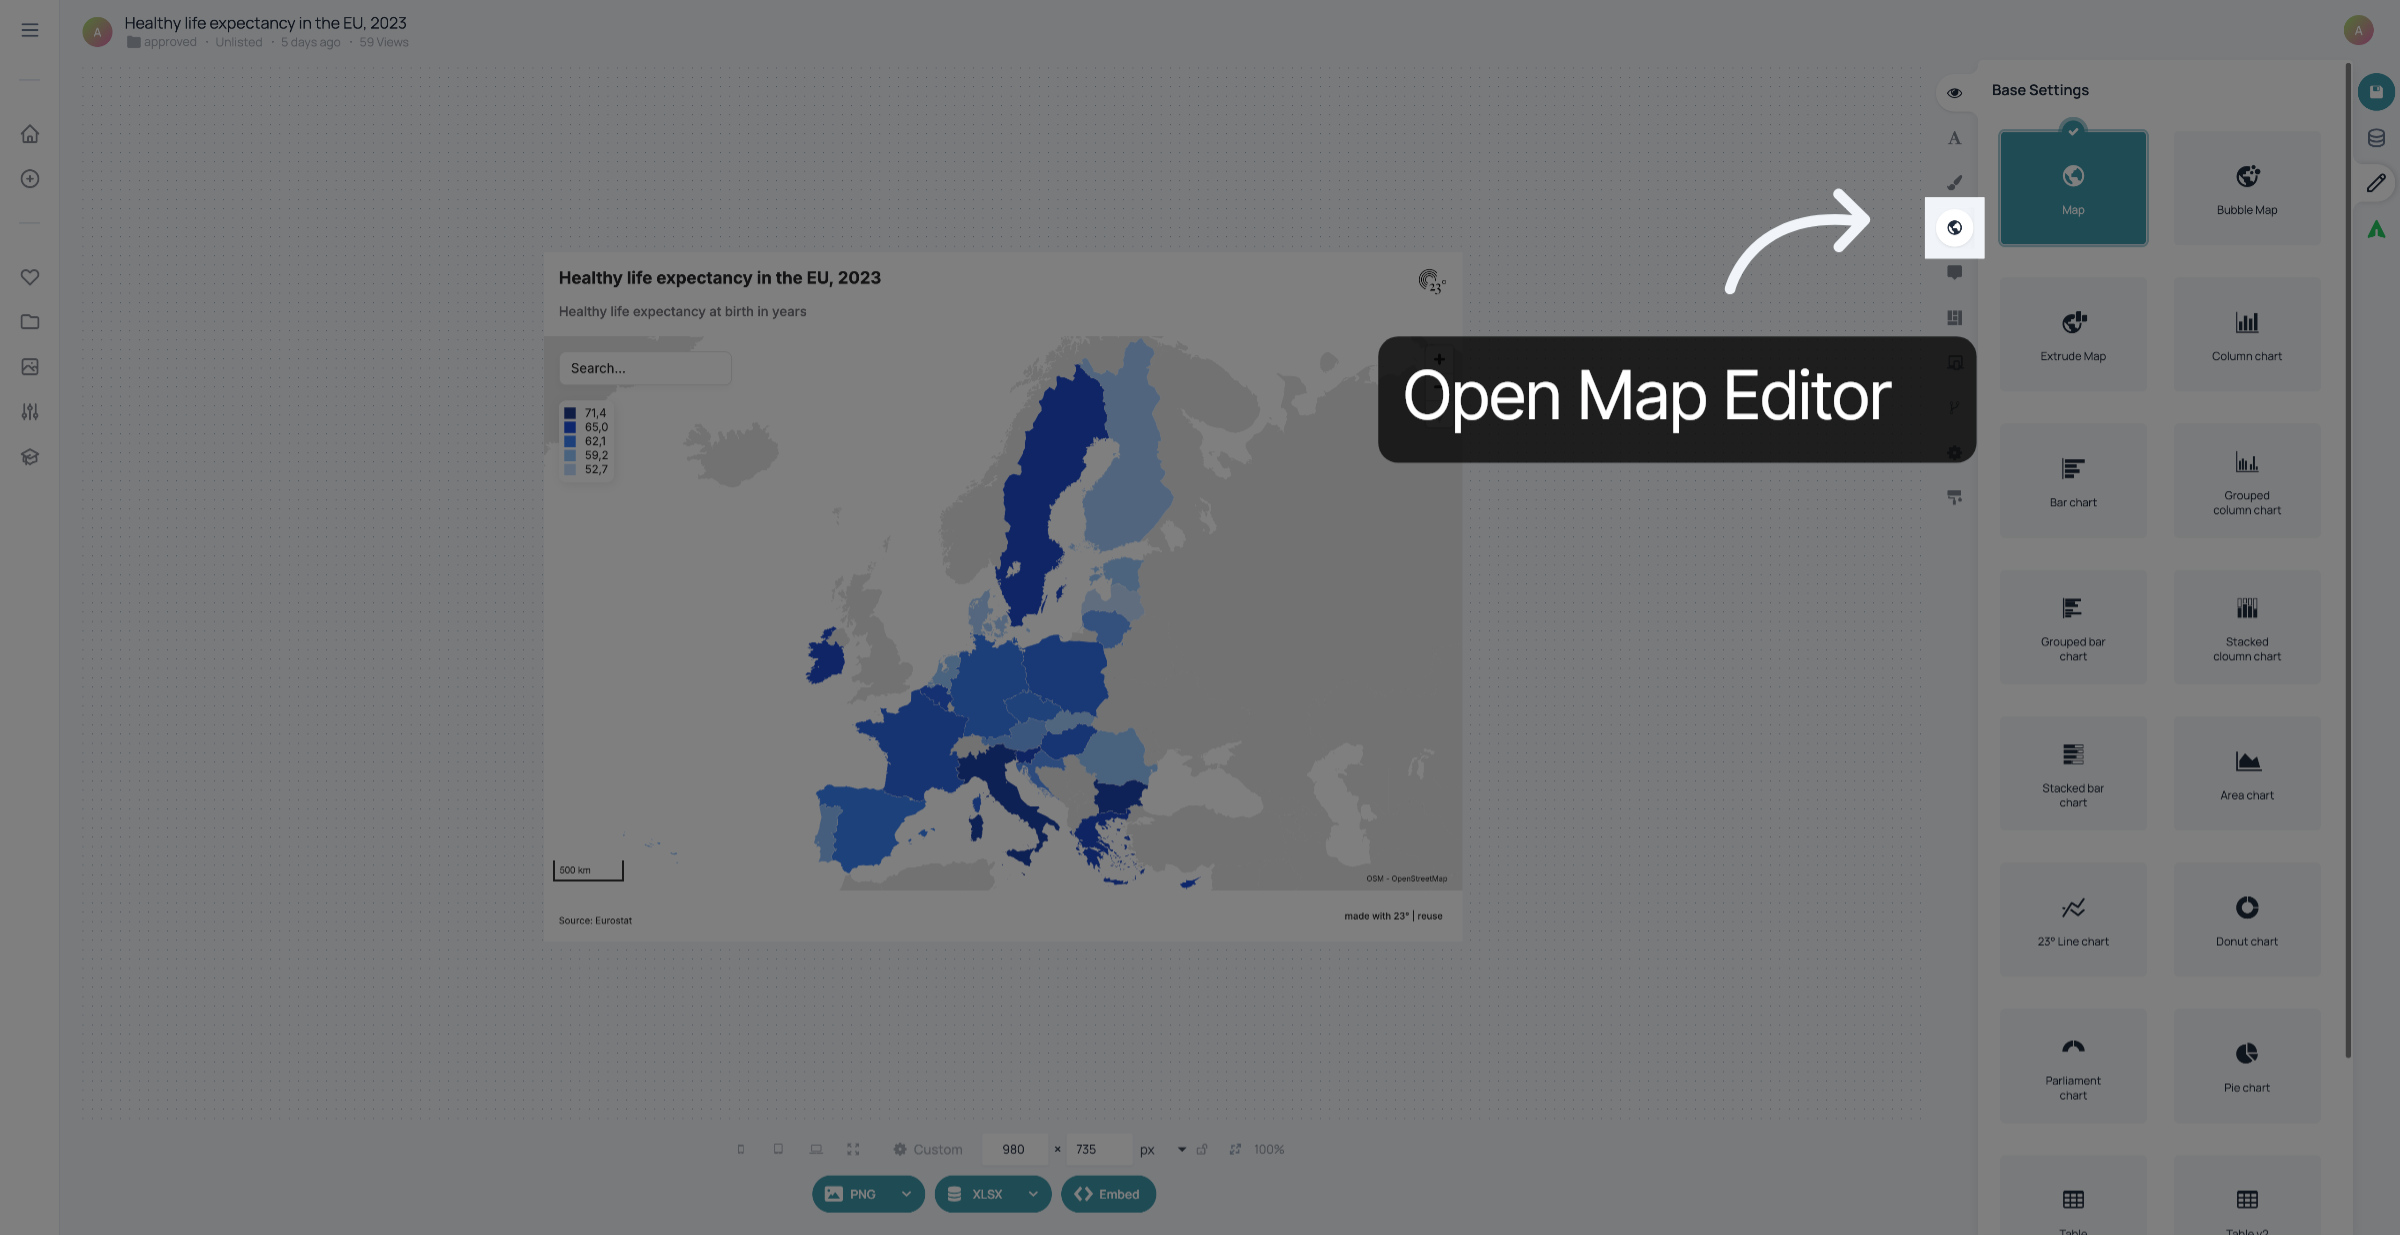
Click here to open the Map Editor.
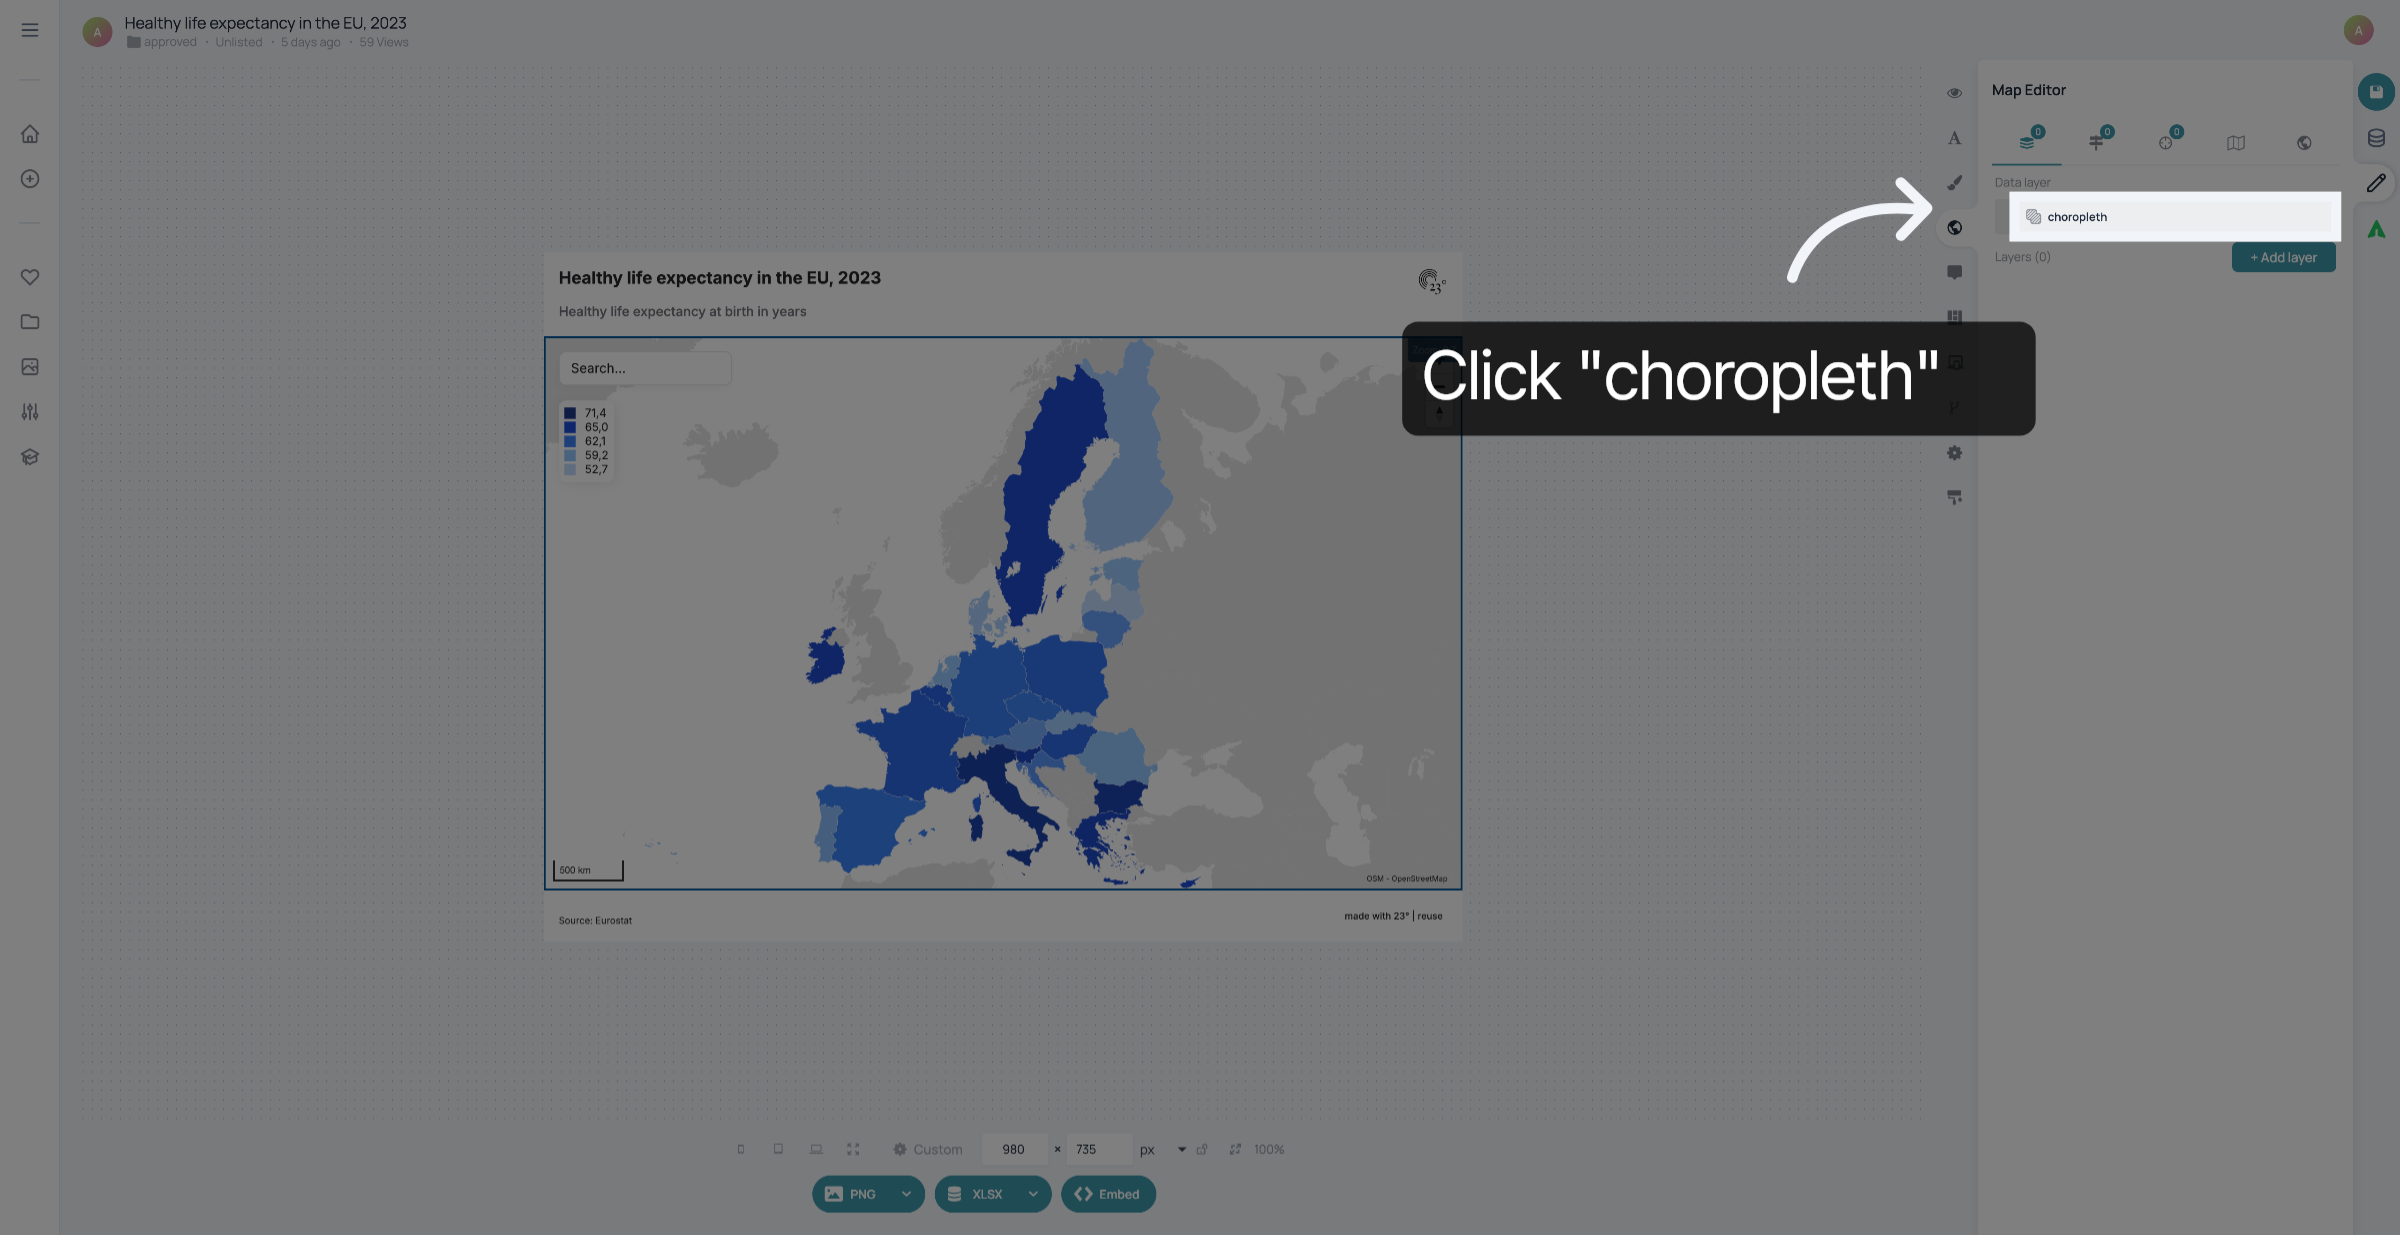
Click "choropleth" to expand the map settings.
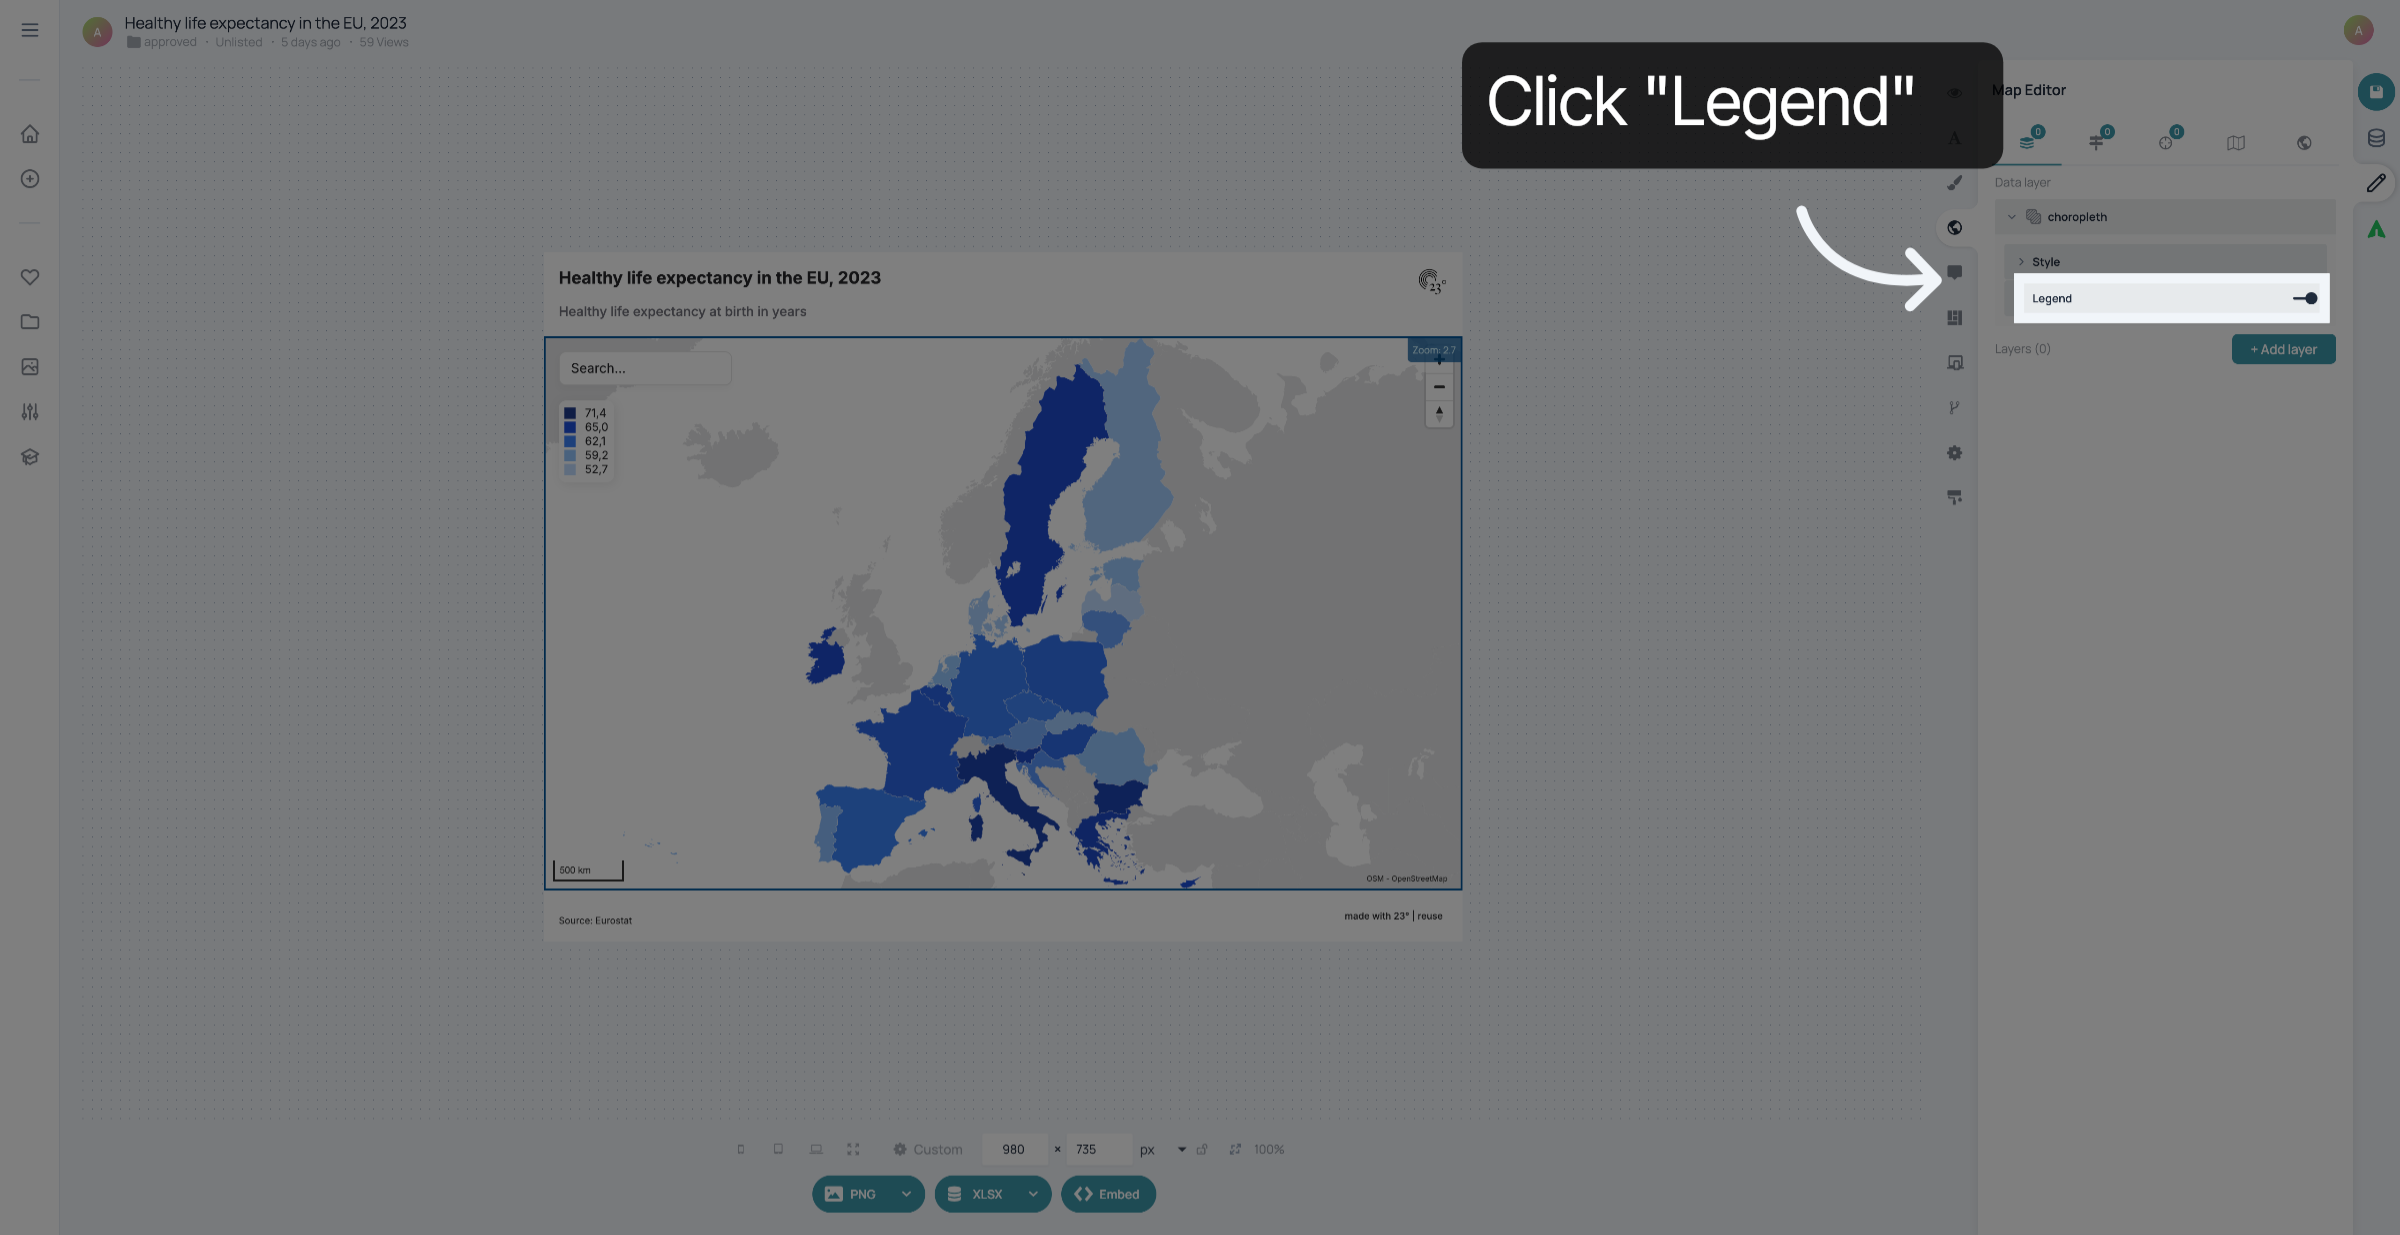
Click "Legend" to access the legend settings.
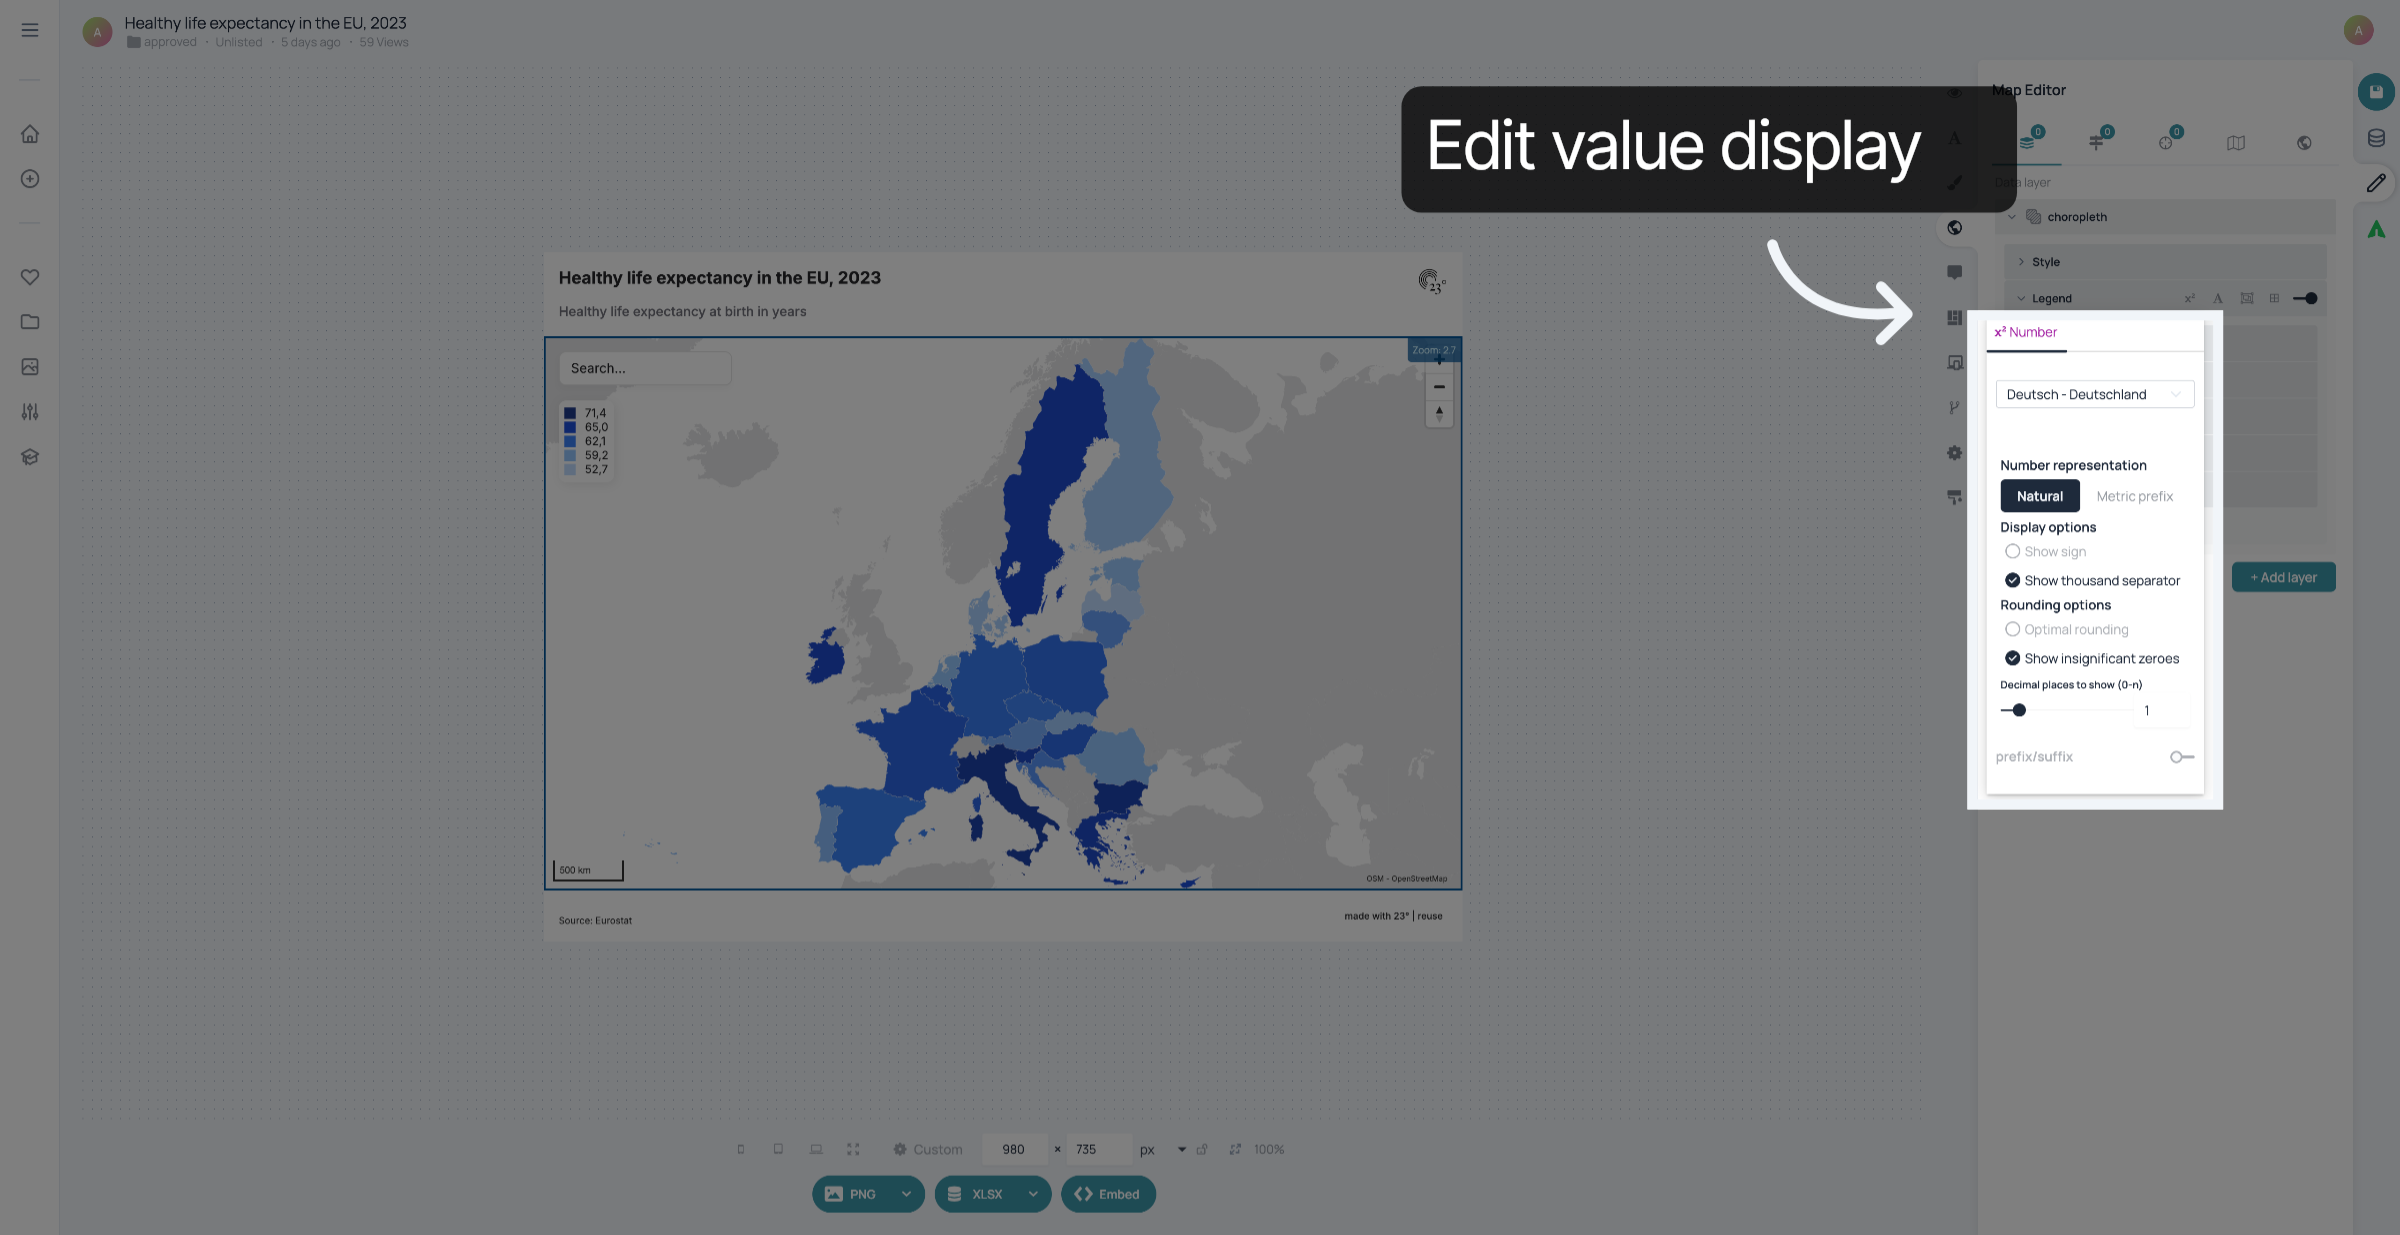
Click here to edit the display of the values
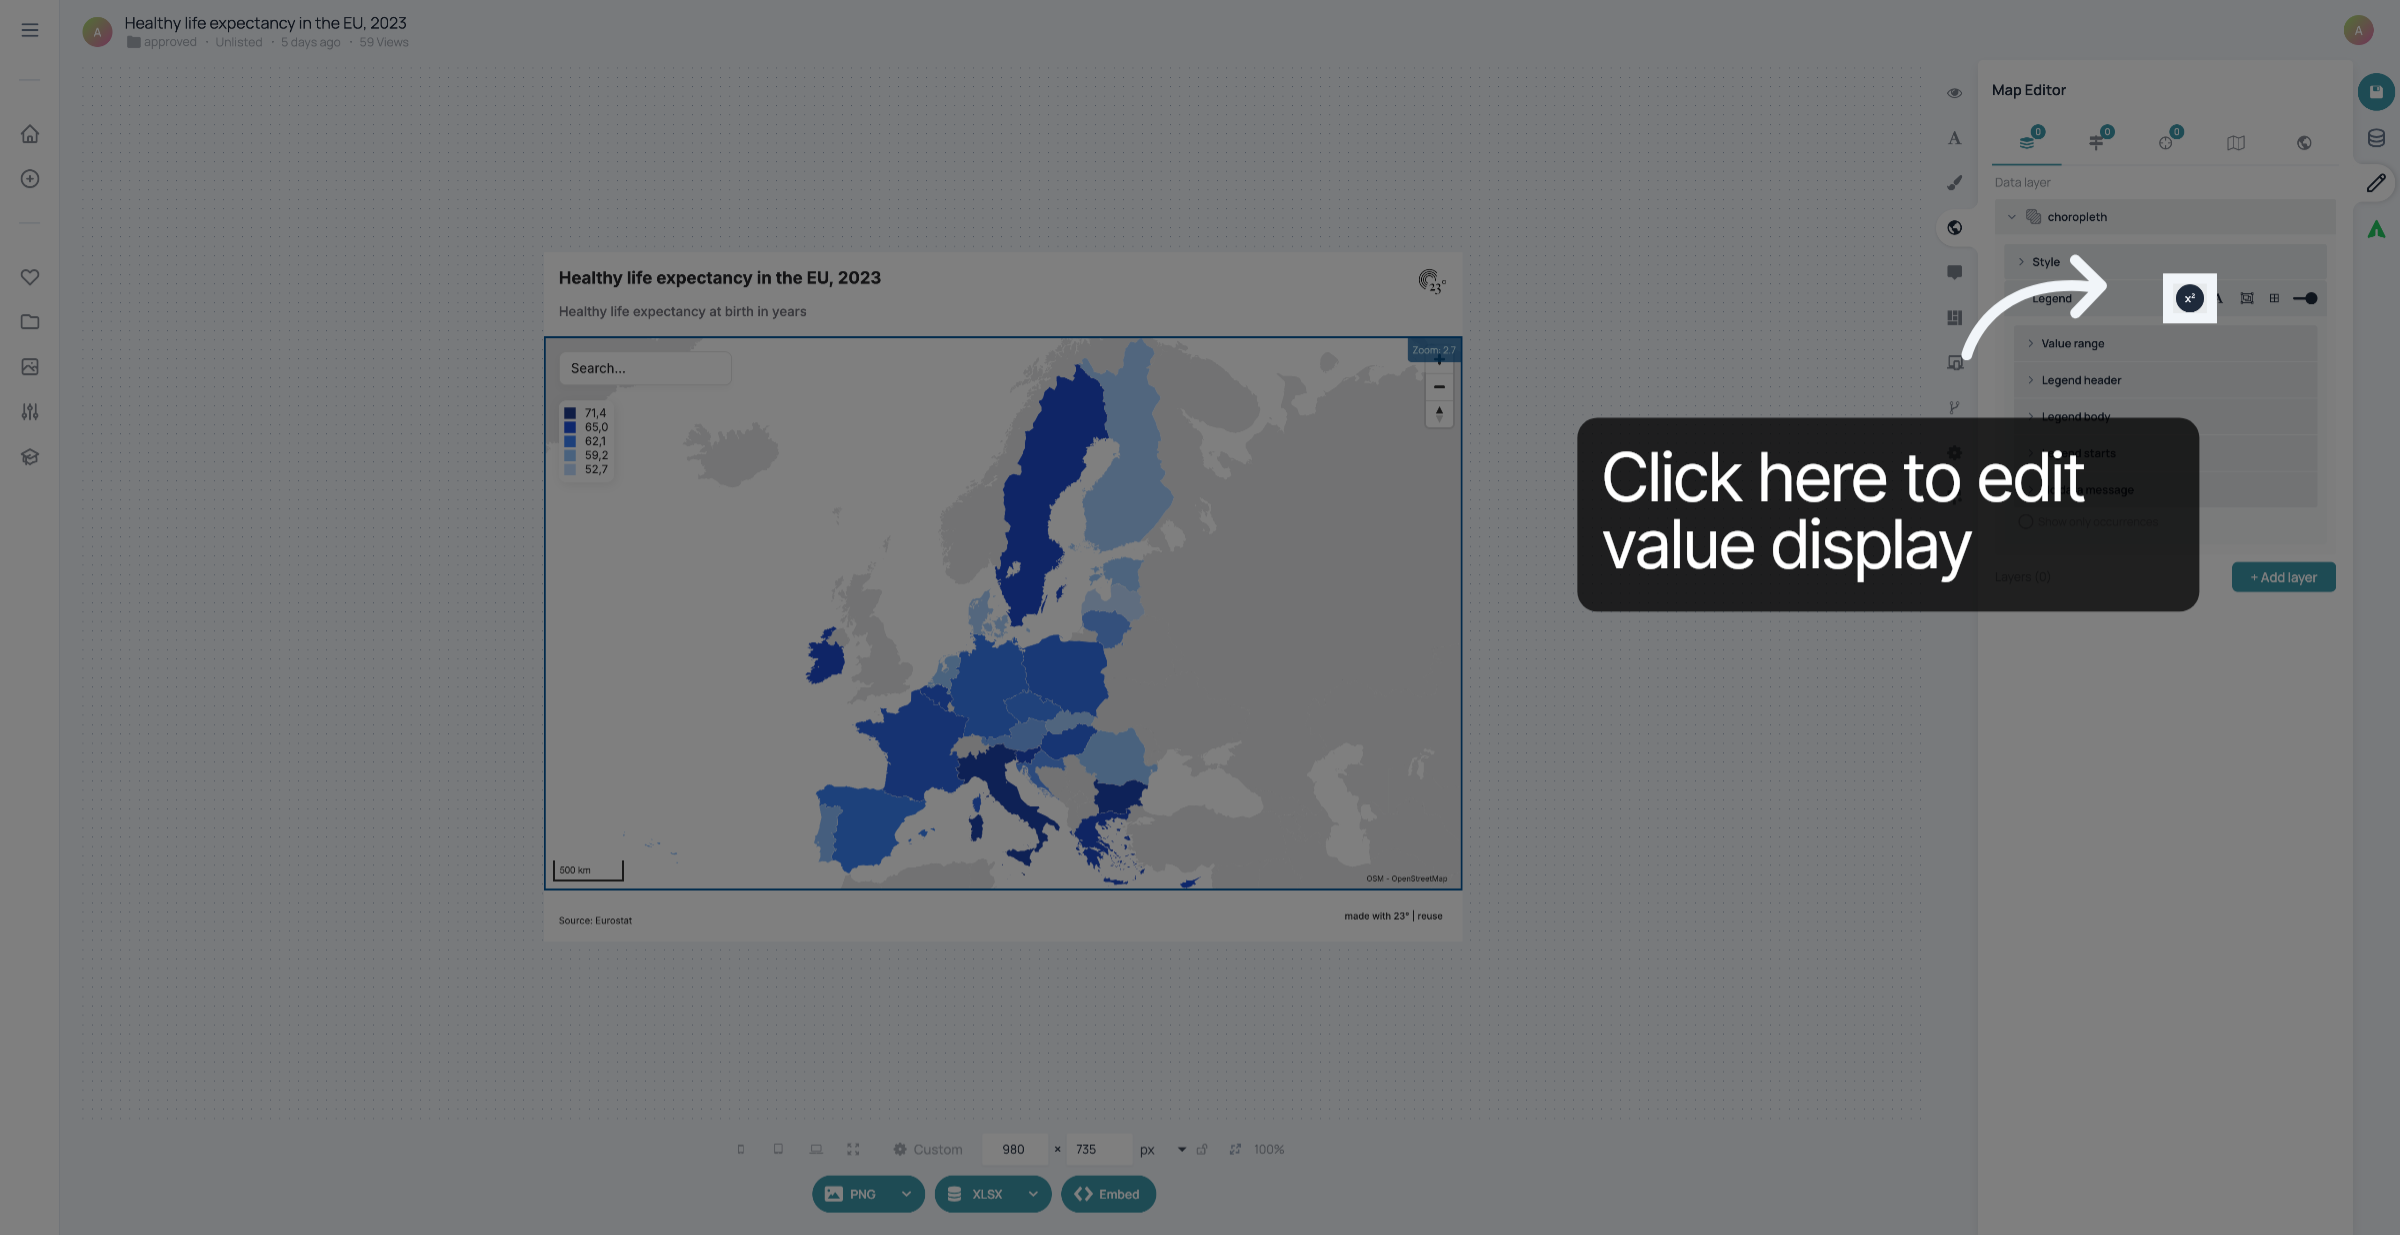
You can edit the rounding and decimal places here. You can also add a prefix or suffix if you want there to be a text or symbol, like the percent sign for example, before or after the values.
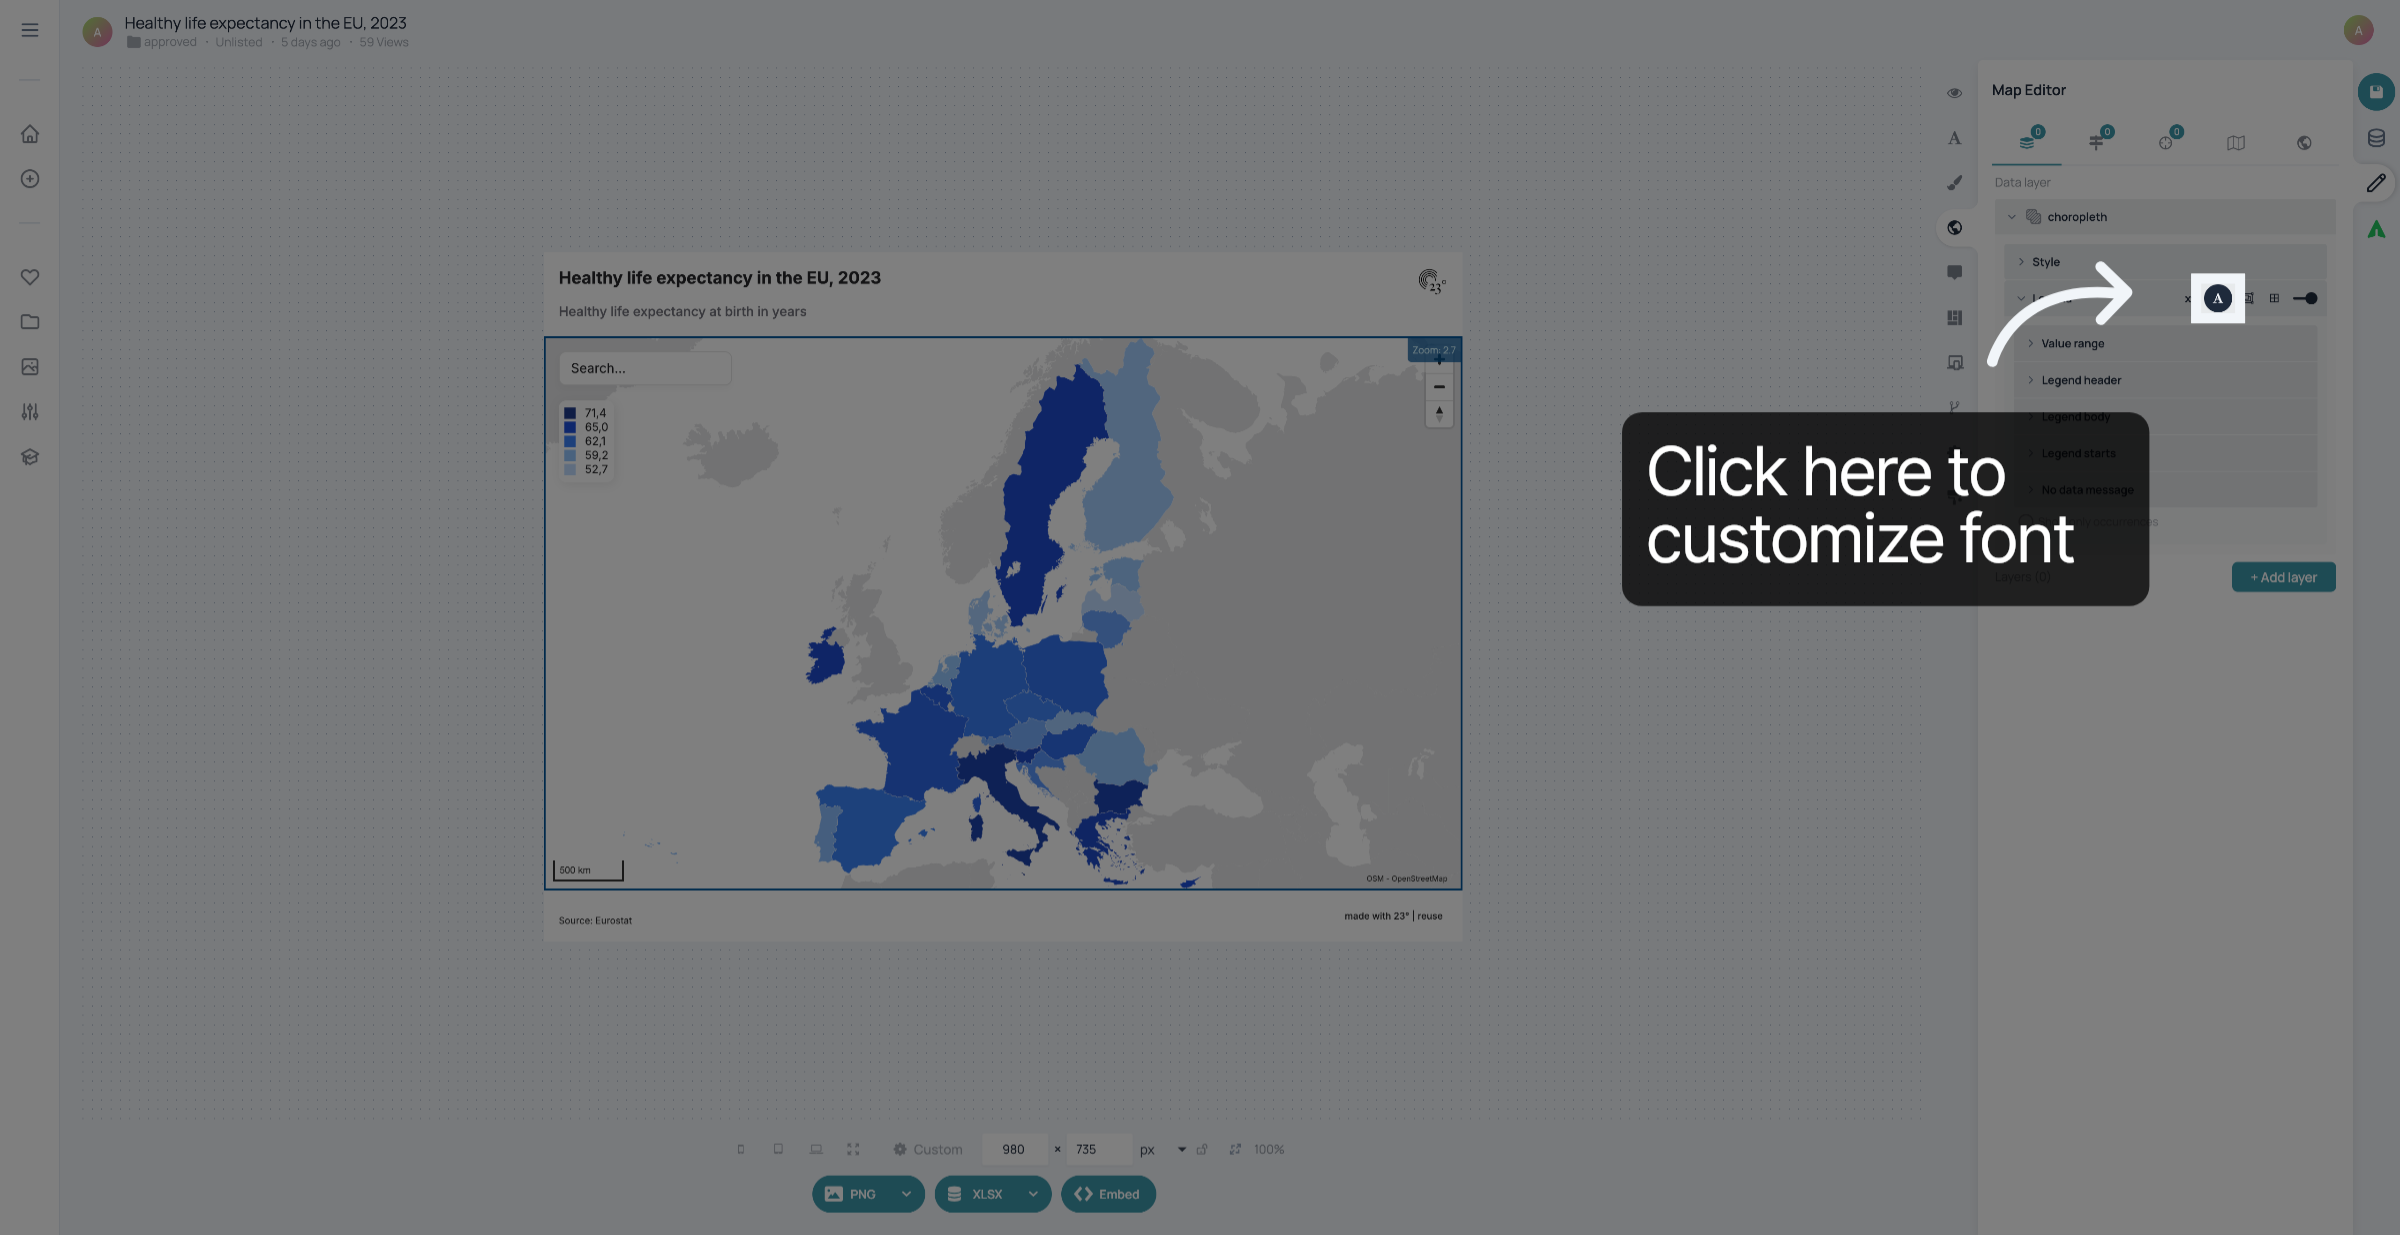
Click here to customize the font of the legend.
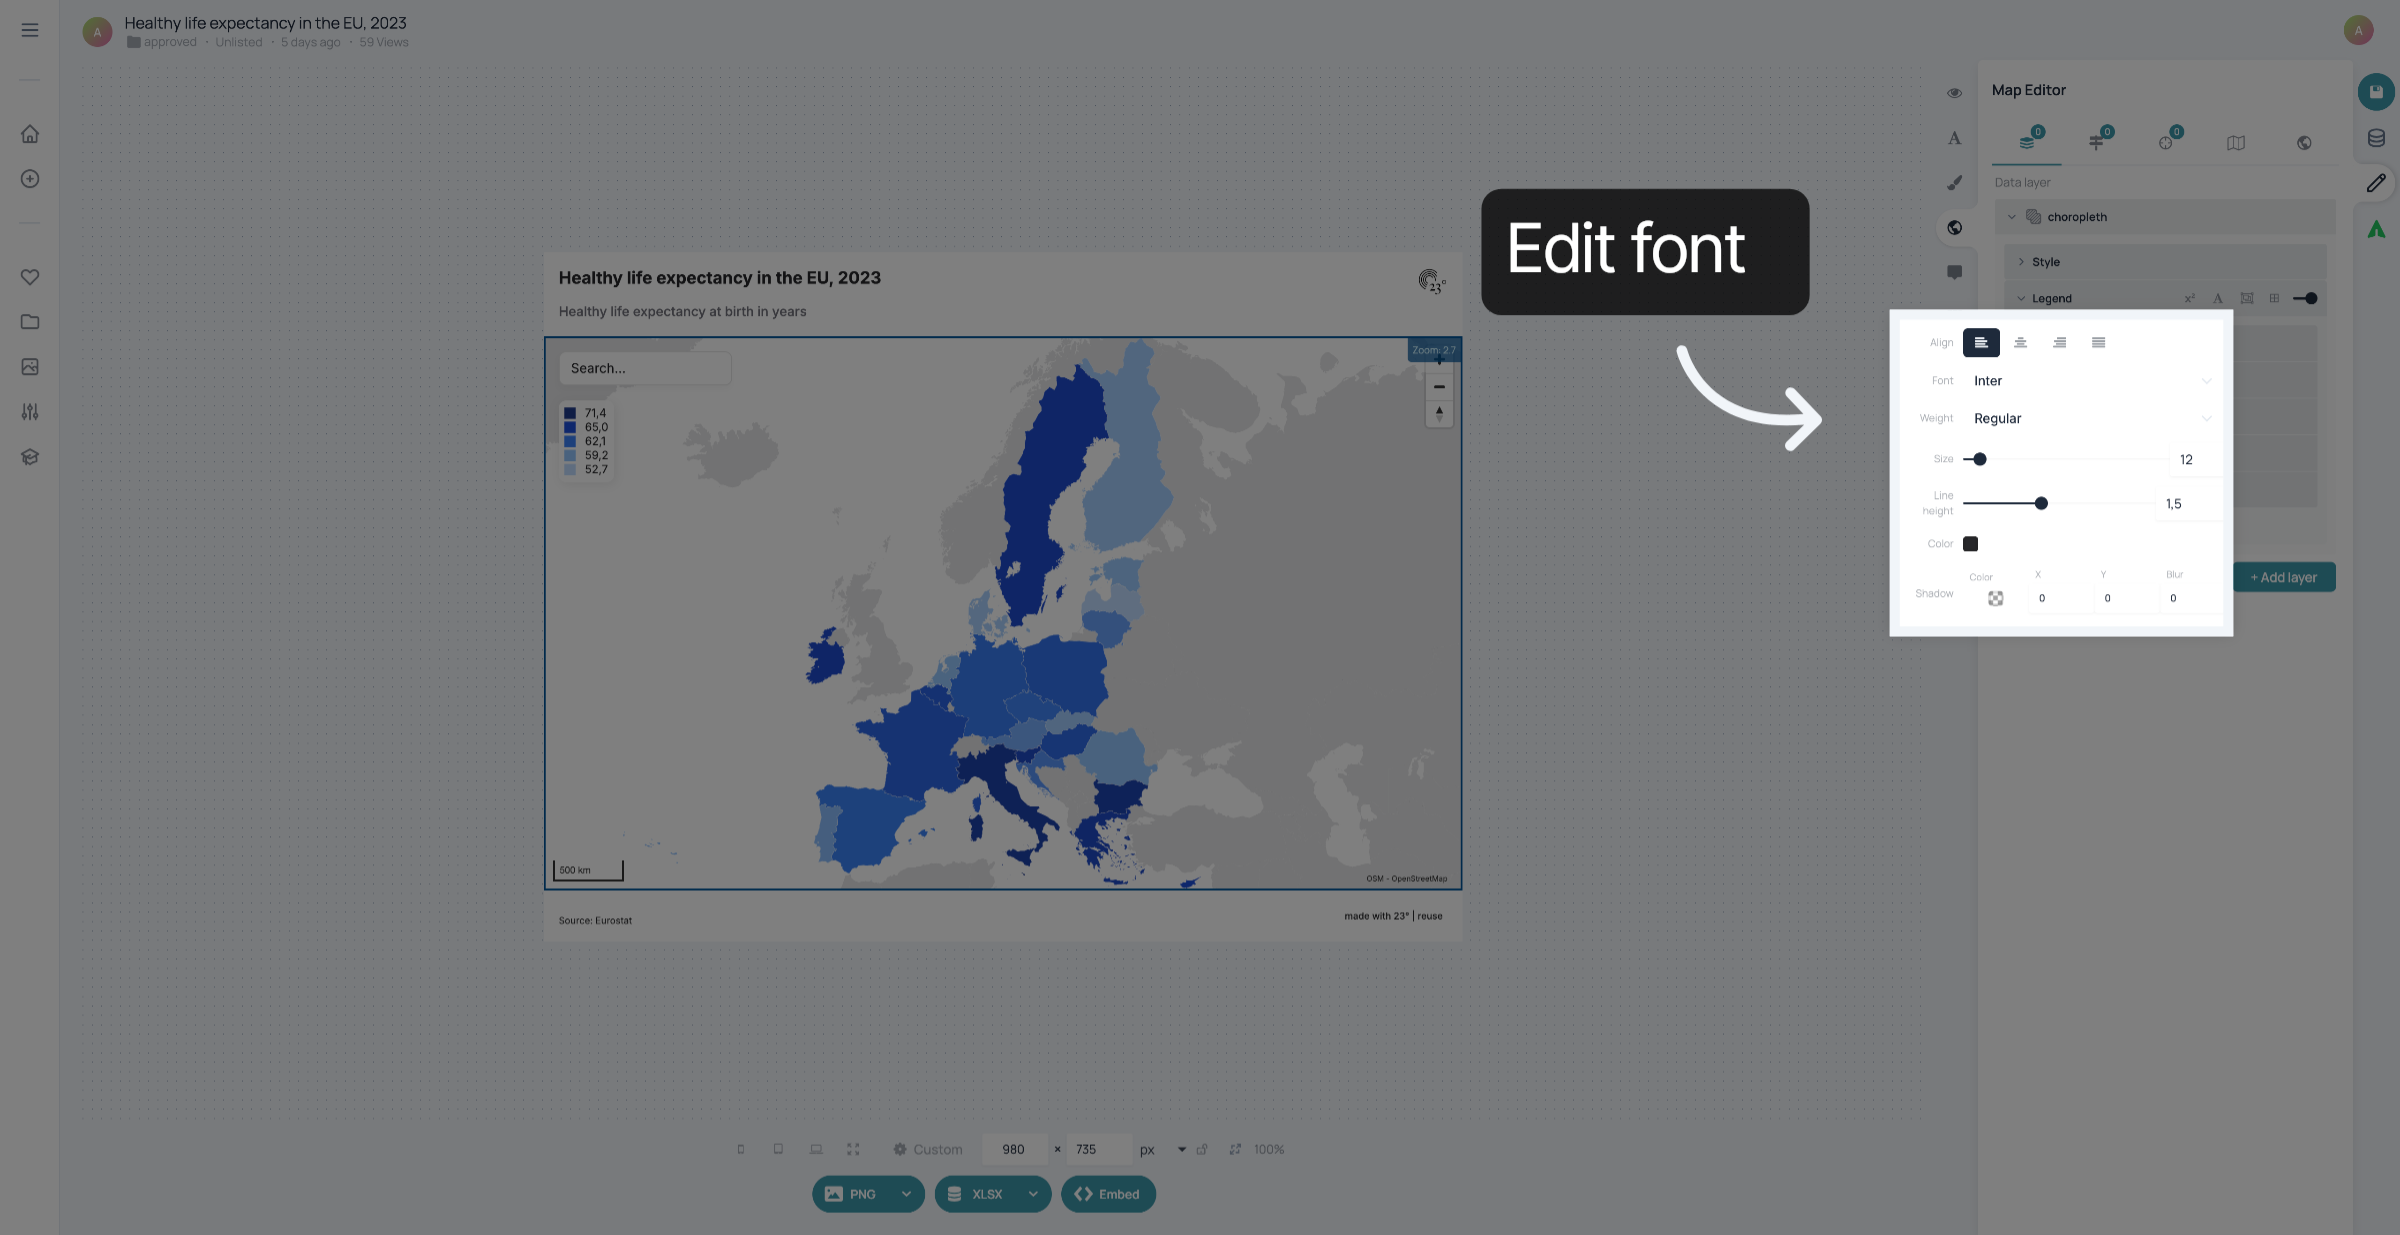
You can edit the alignment, font, weight size as well as the line height, colour and shadow of the font in your legend here.
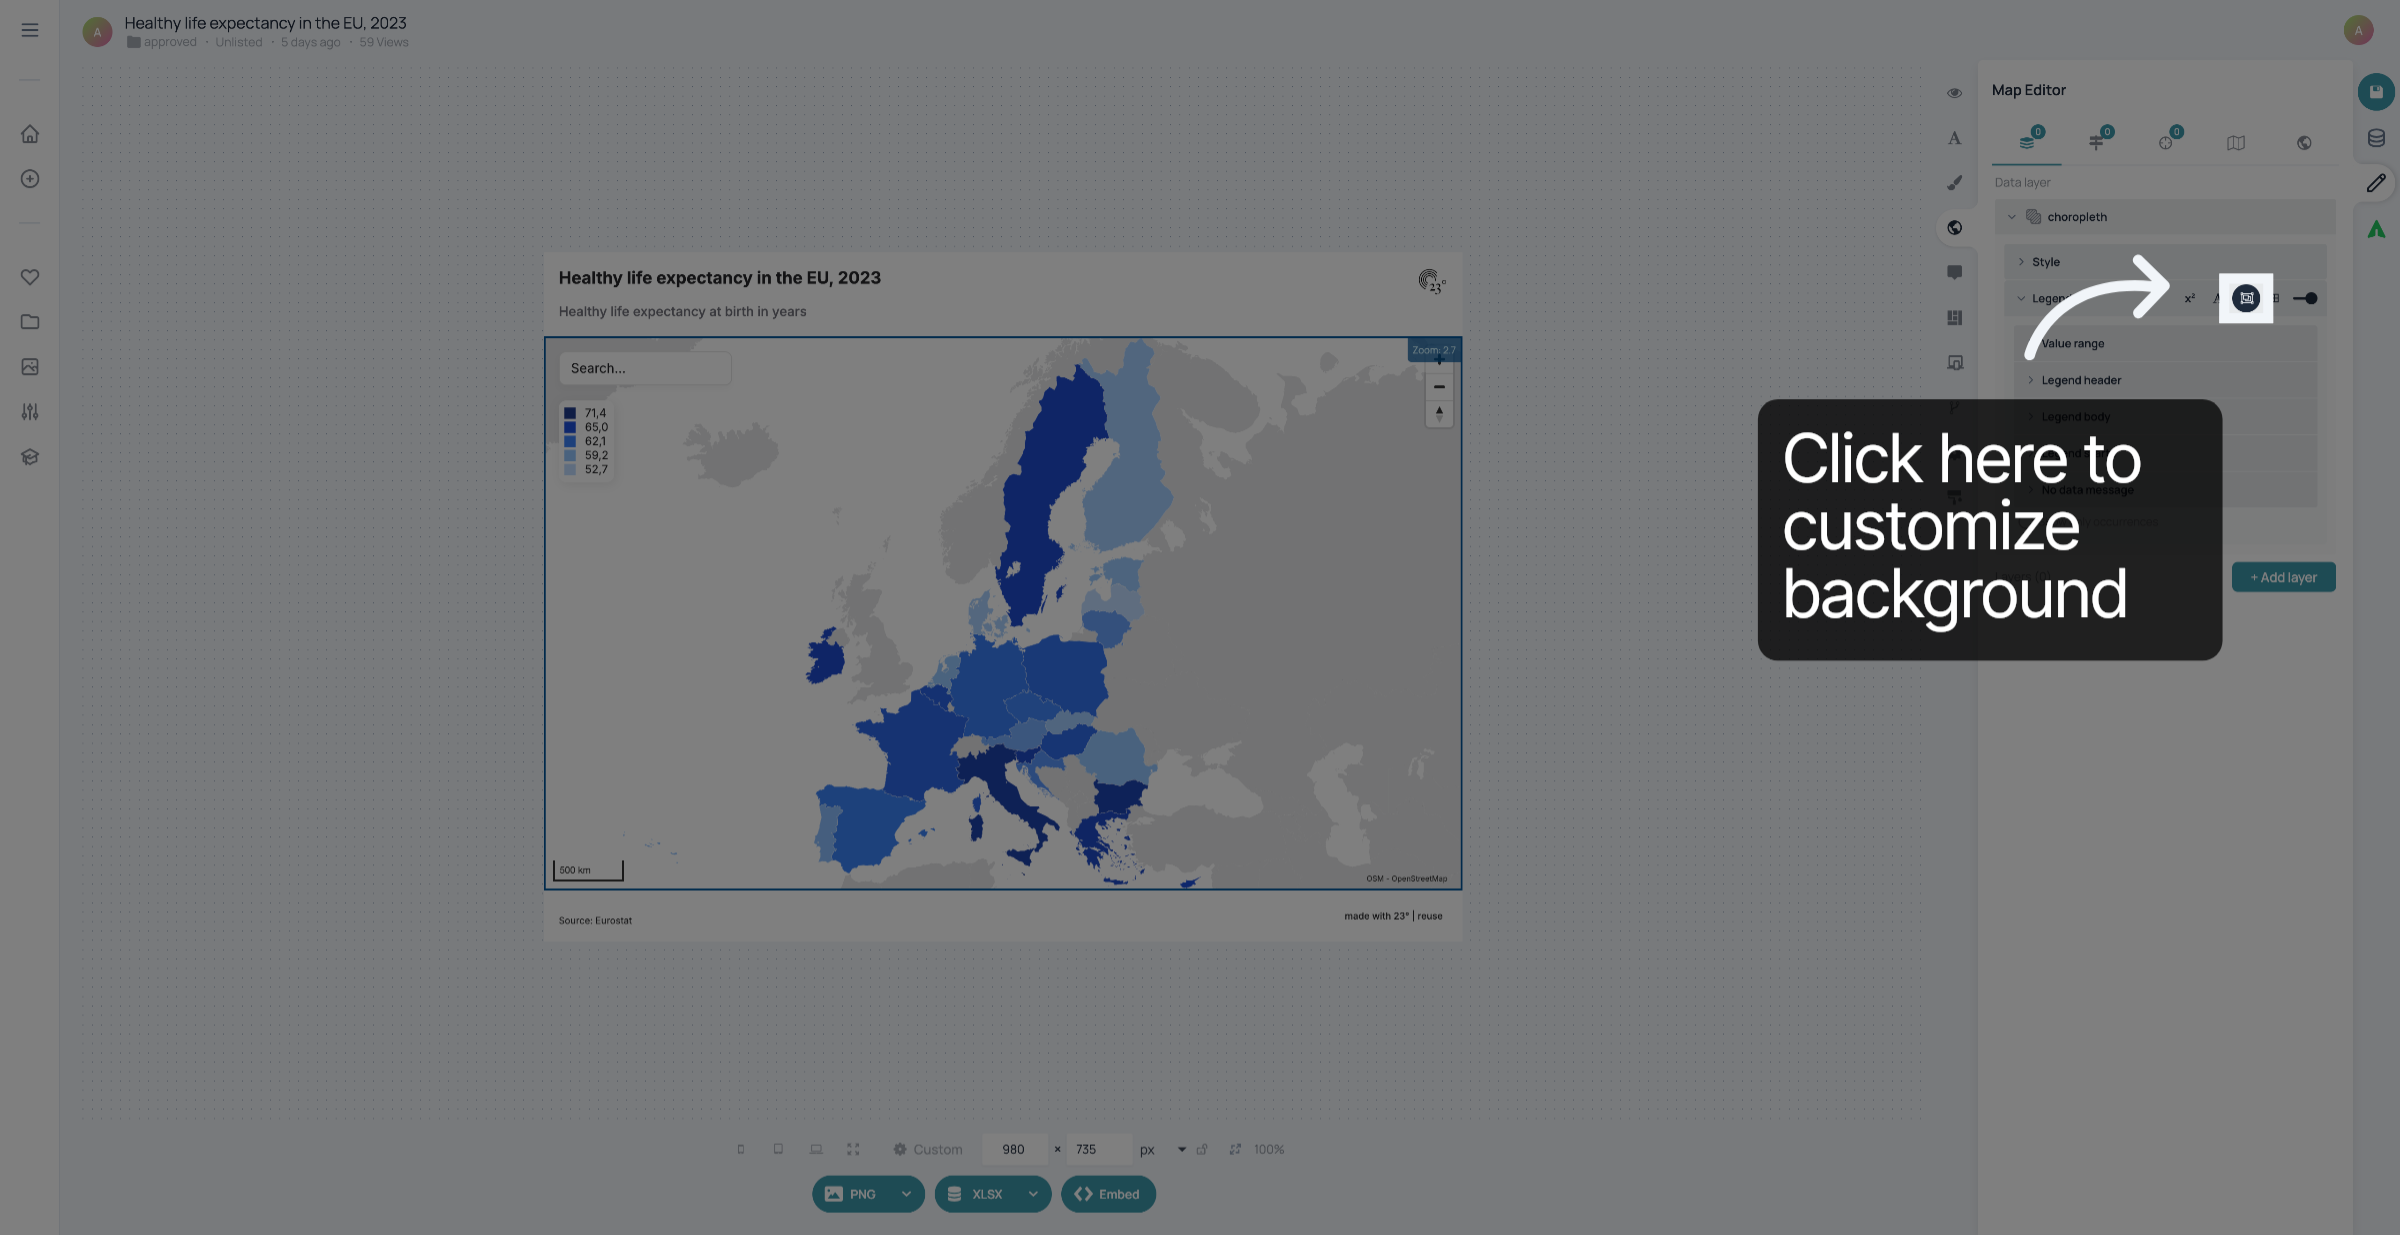
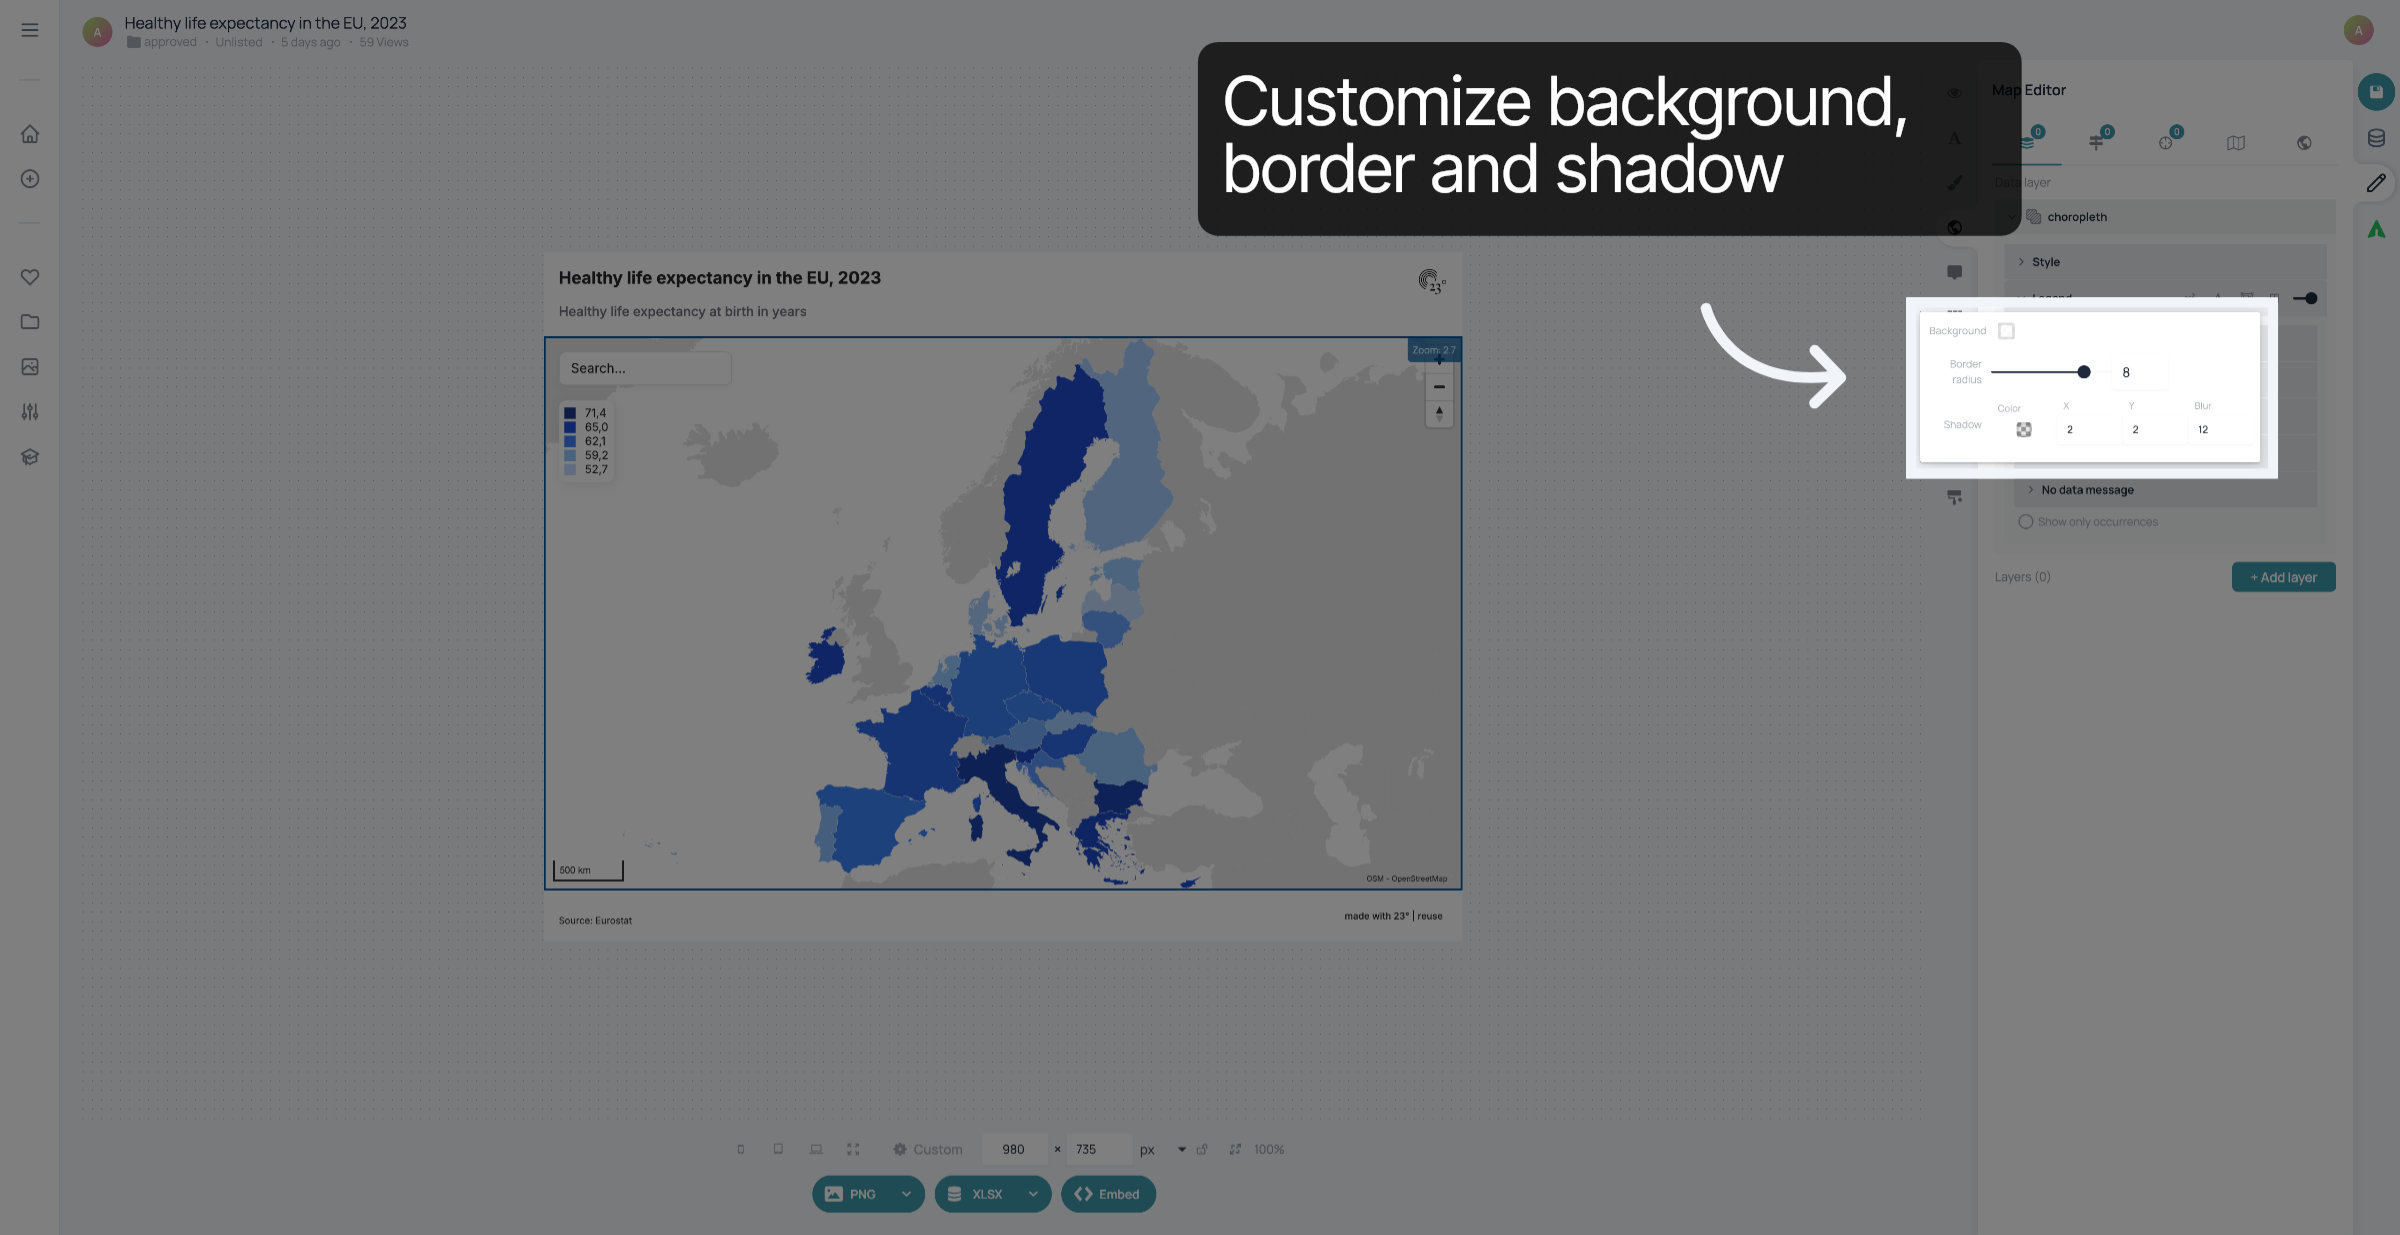
Click here to open the background settings.
Here you can customize the background, border radius and shadow of your legend.
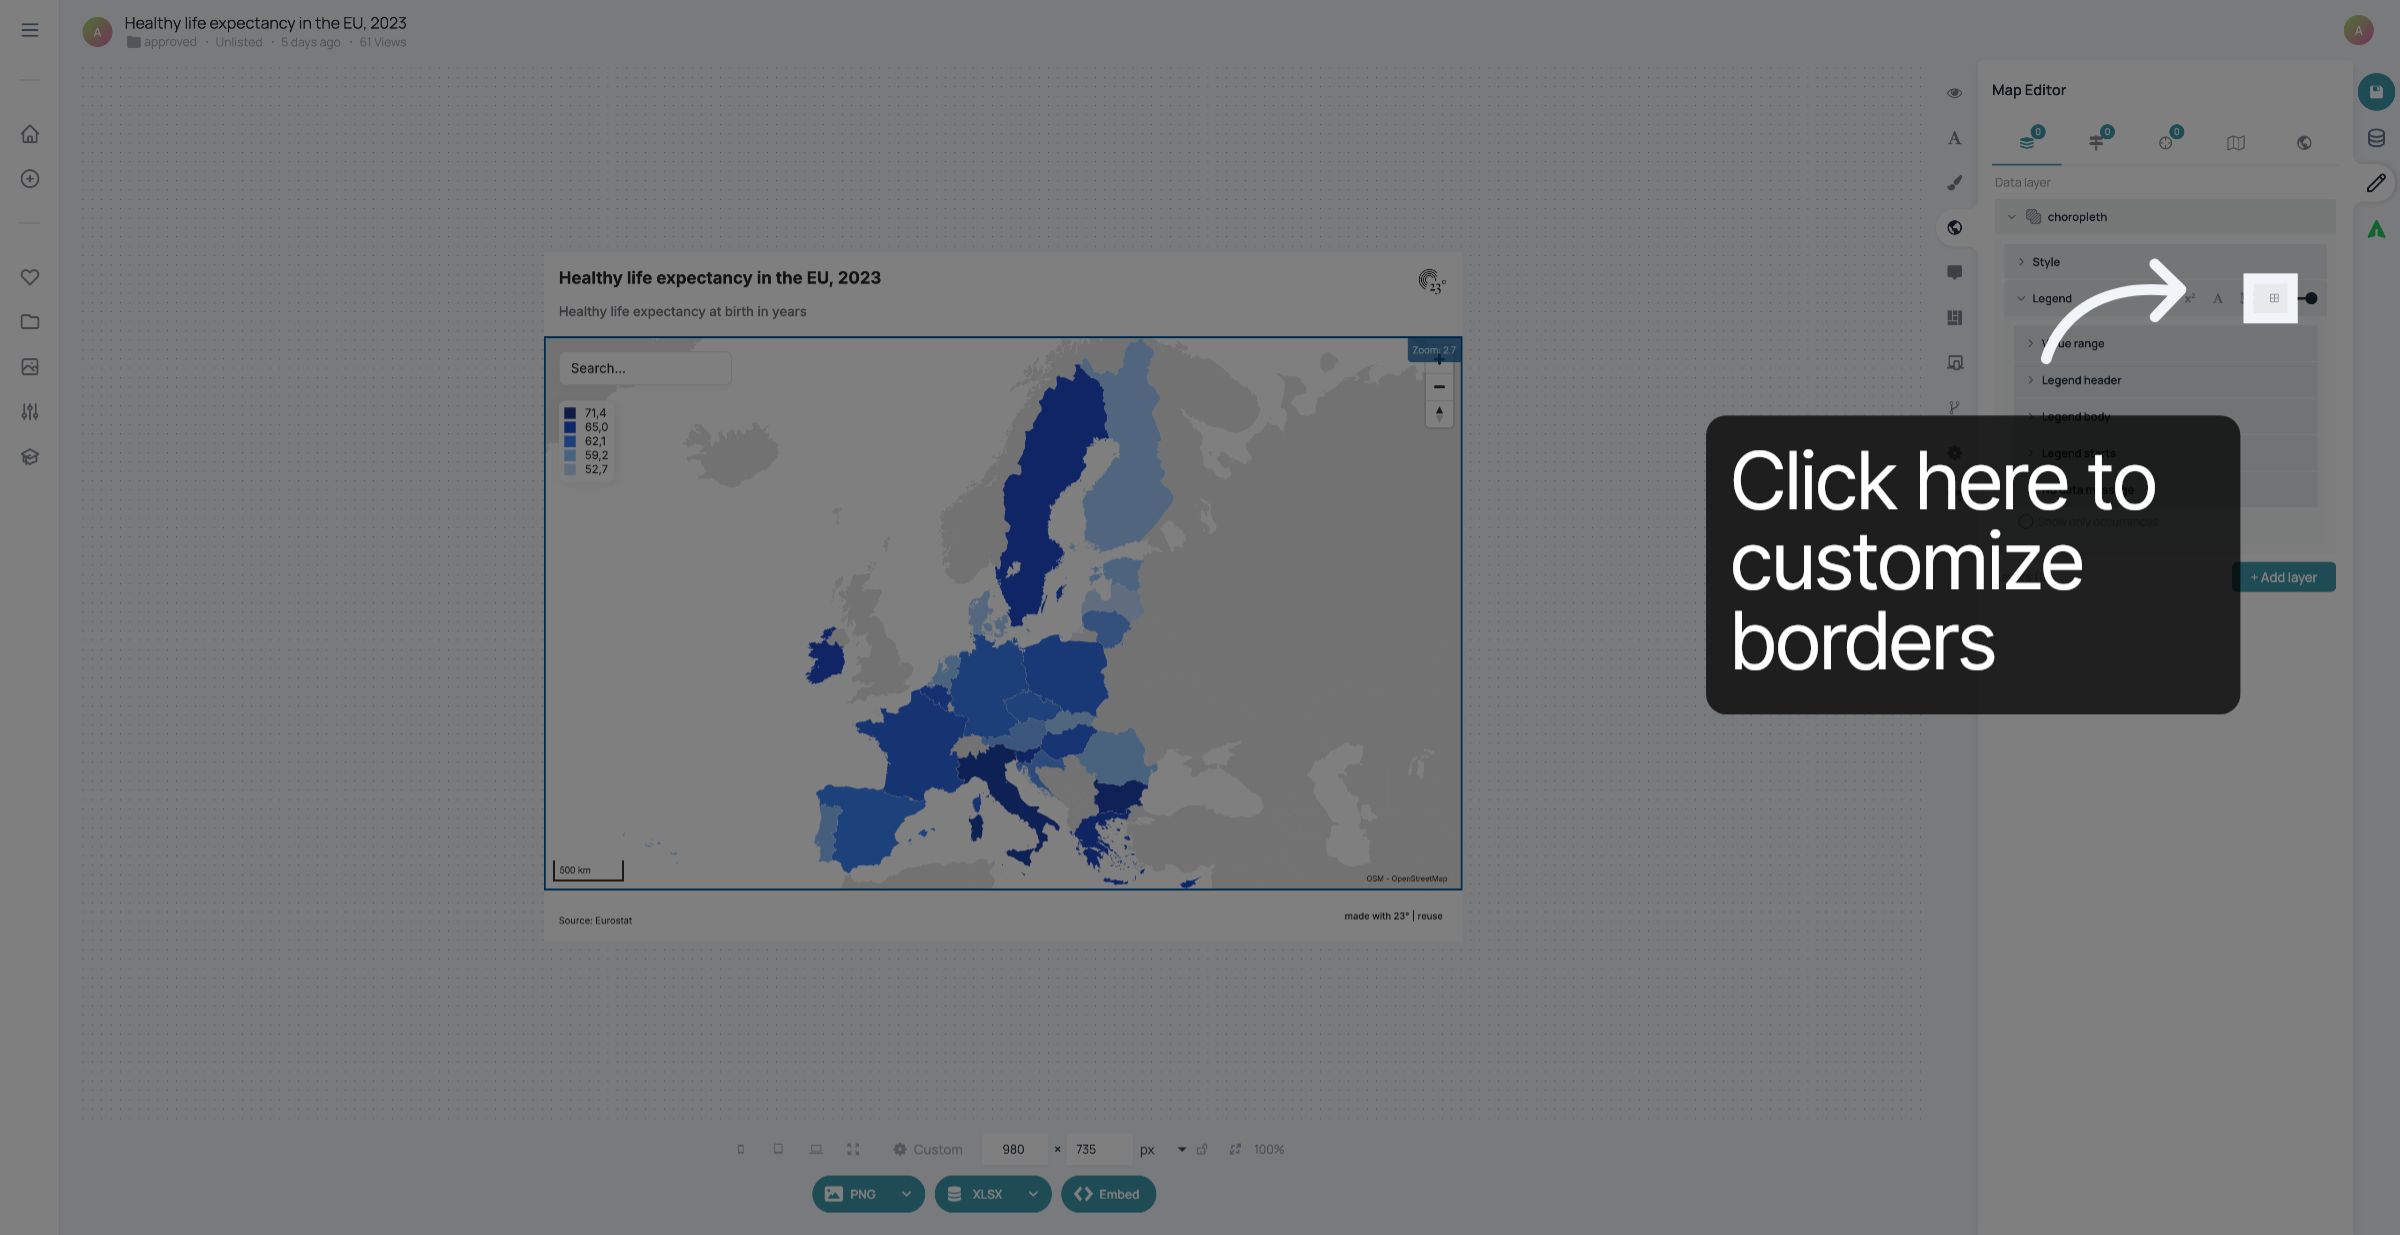
Click here to customize the borders of your legend.
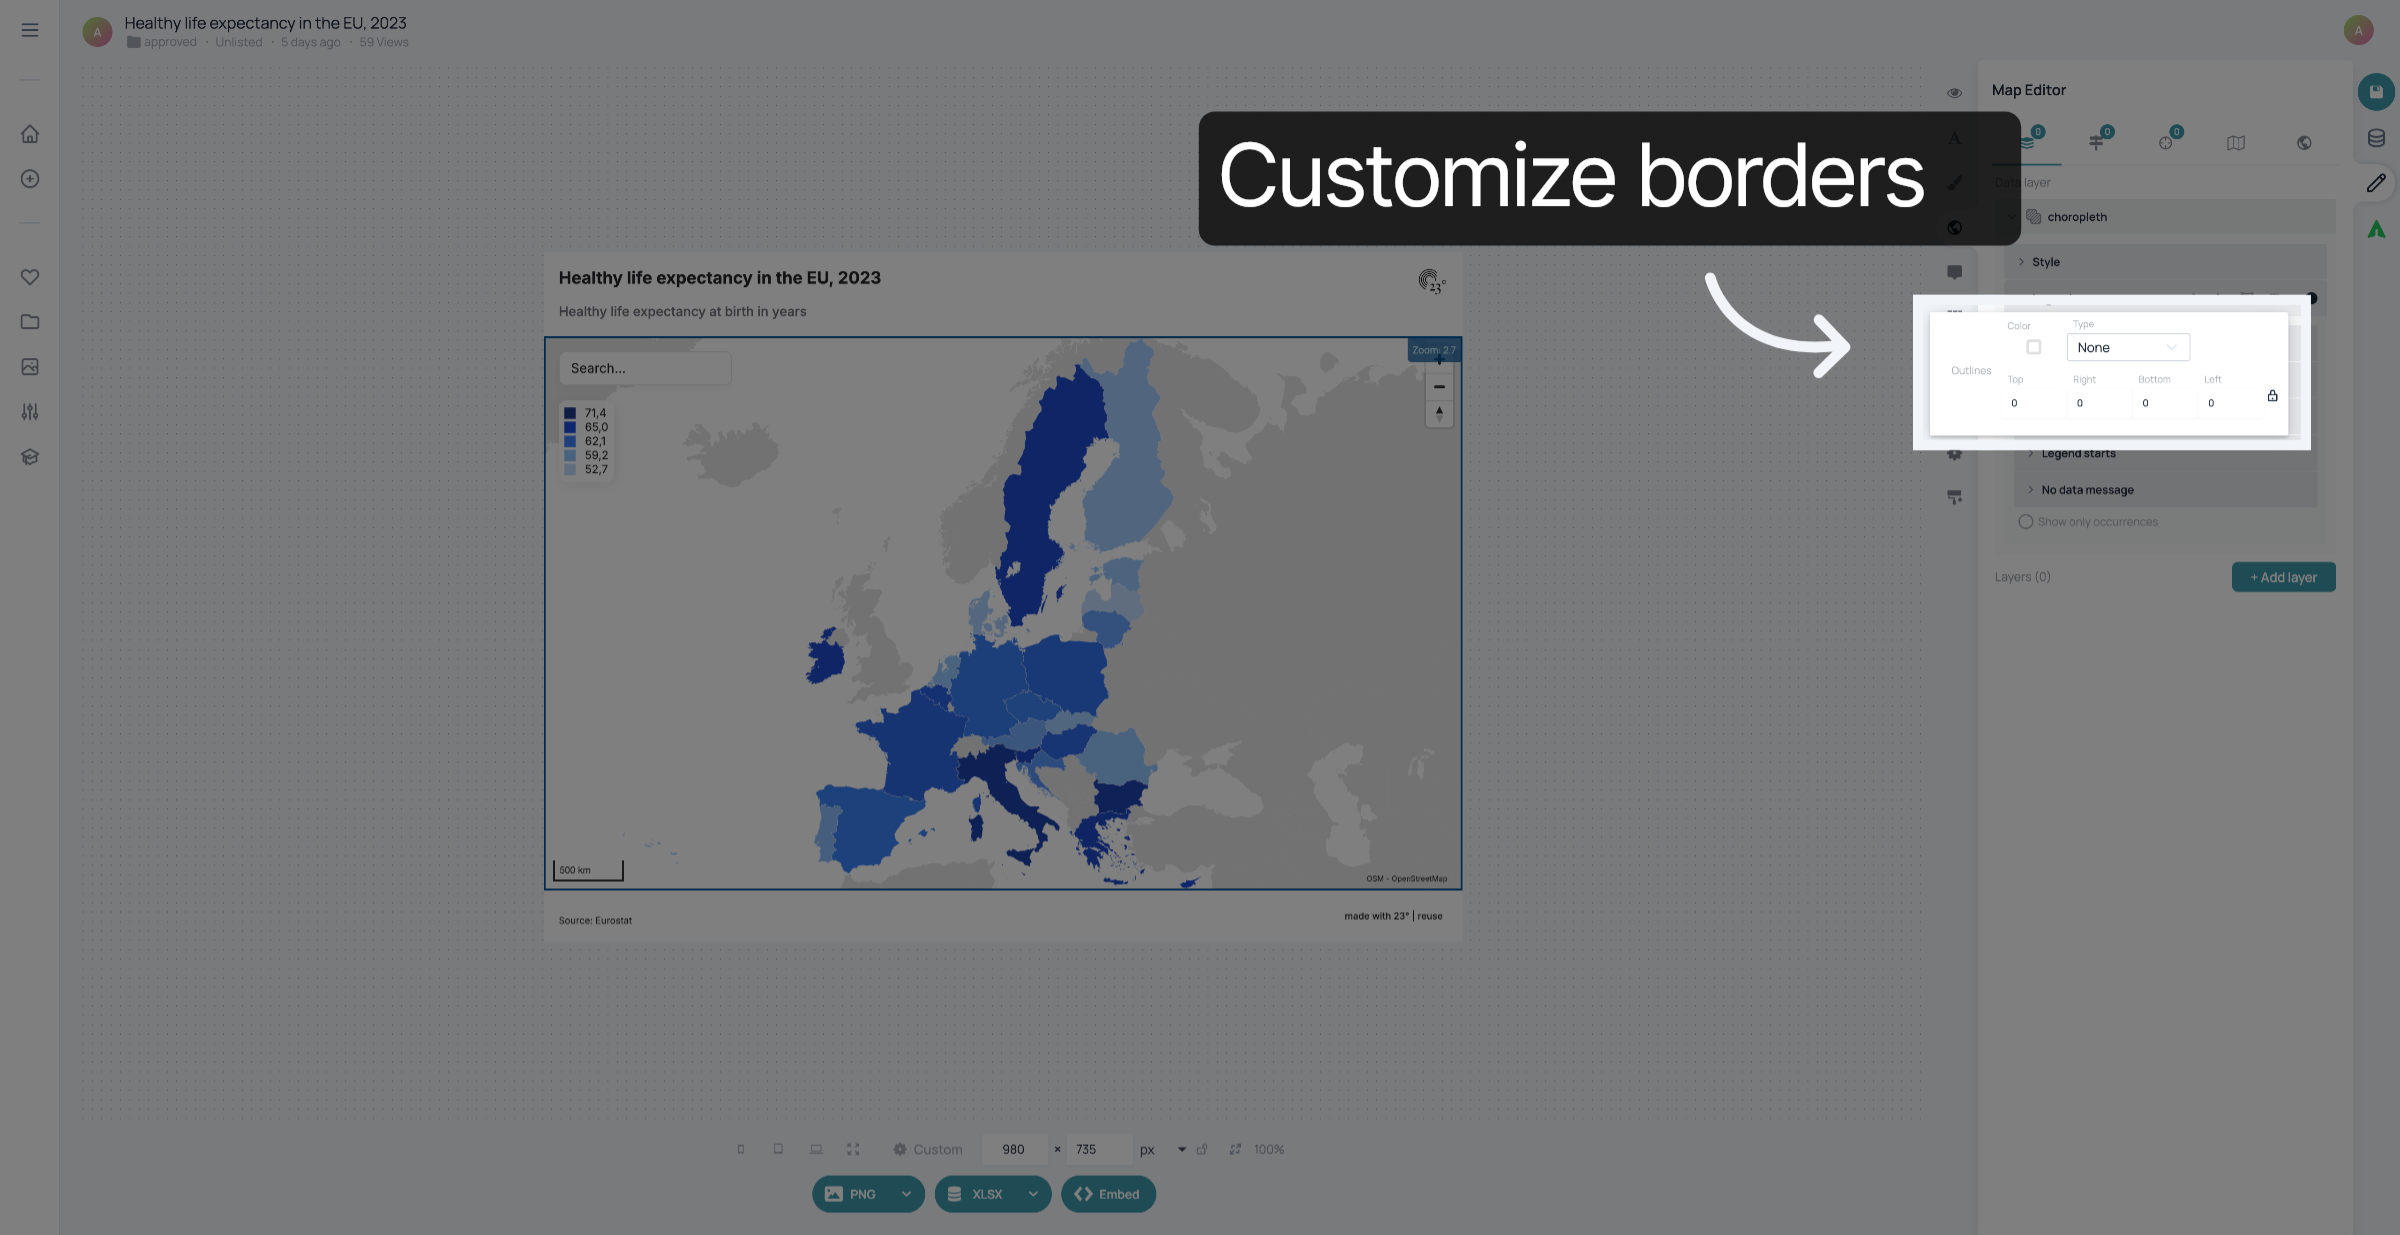
You can choose the style and colour of the outlines around your legend here.
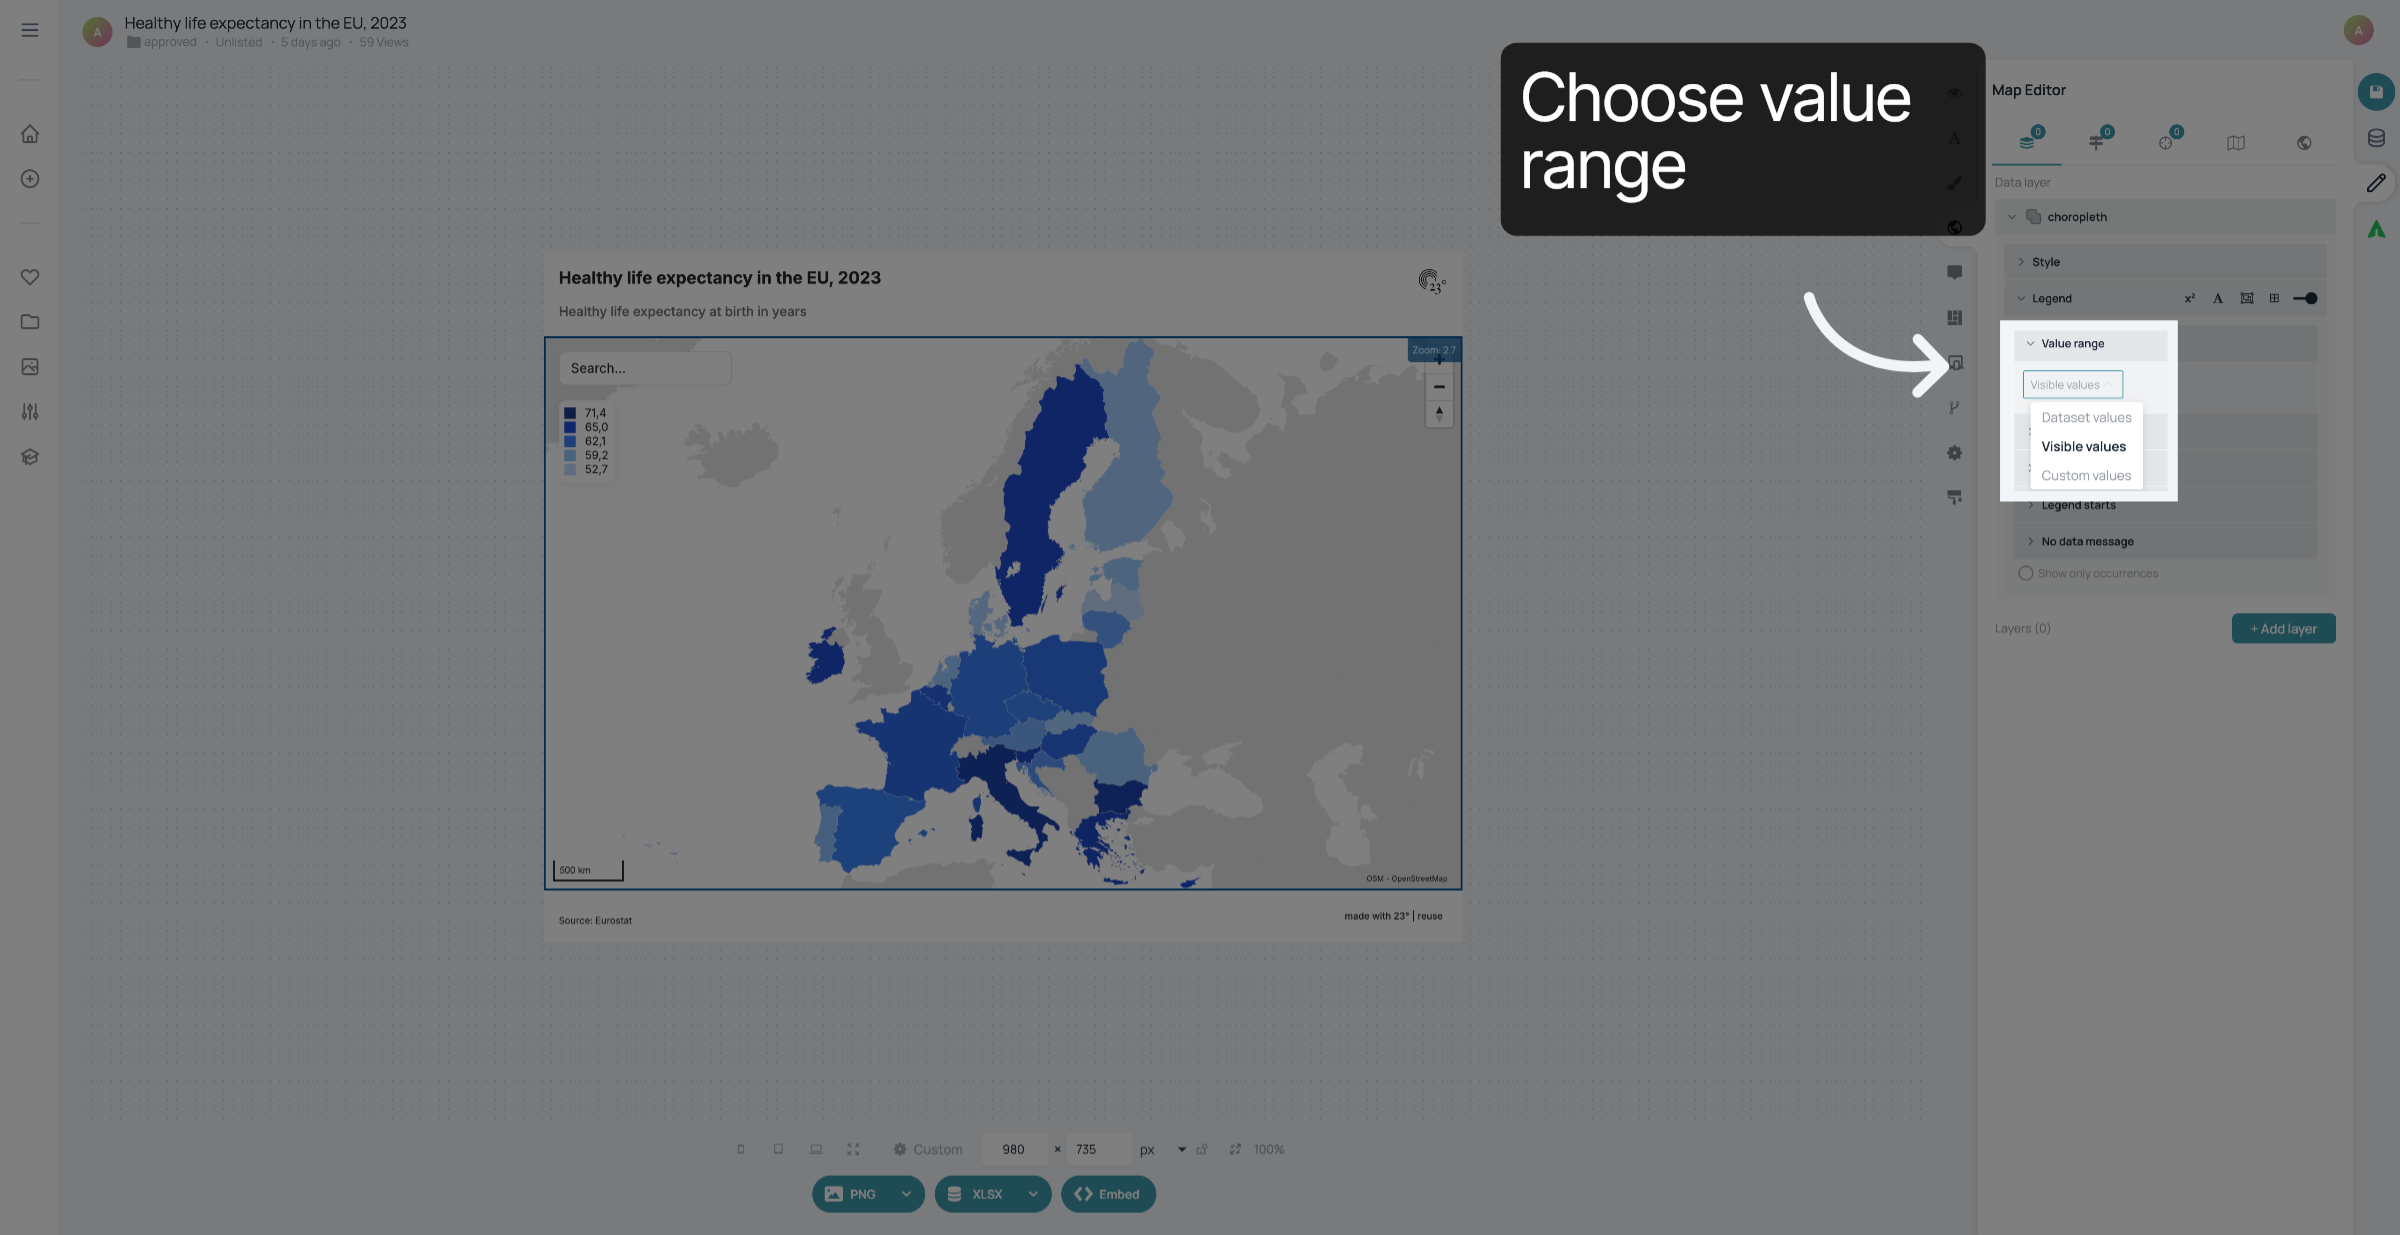
In "Value range", you can select which values you want to show in the legend of your map. It can either be all the values in your dataset, all currently visible values or a custom value range.
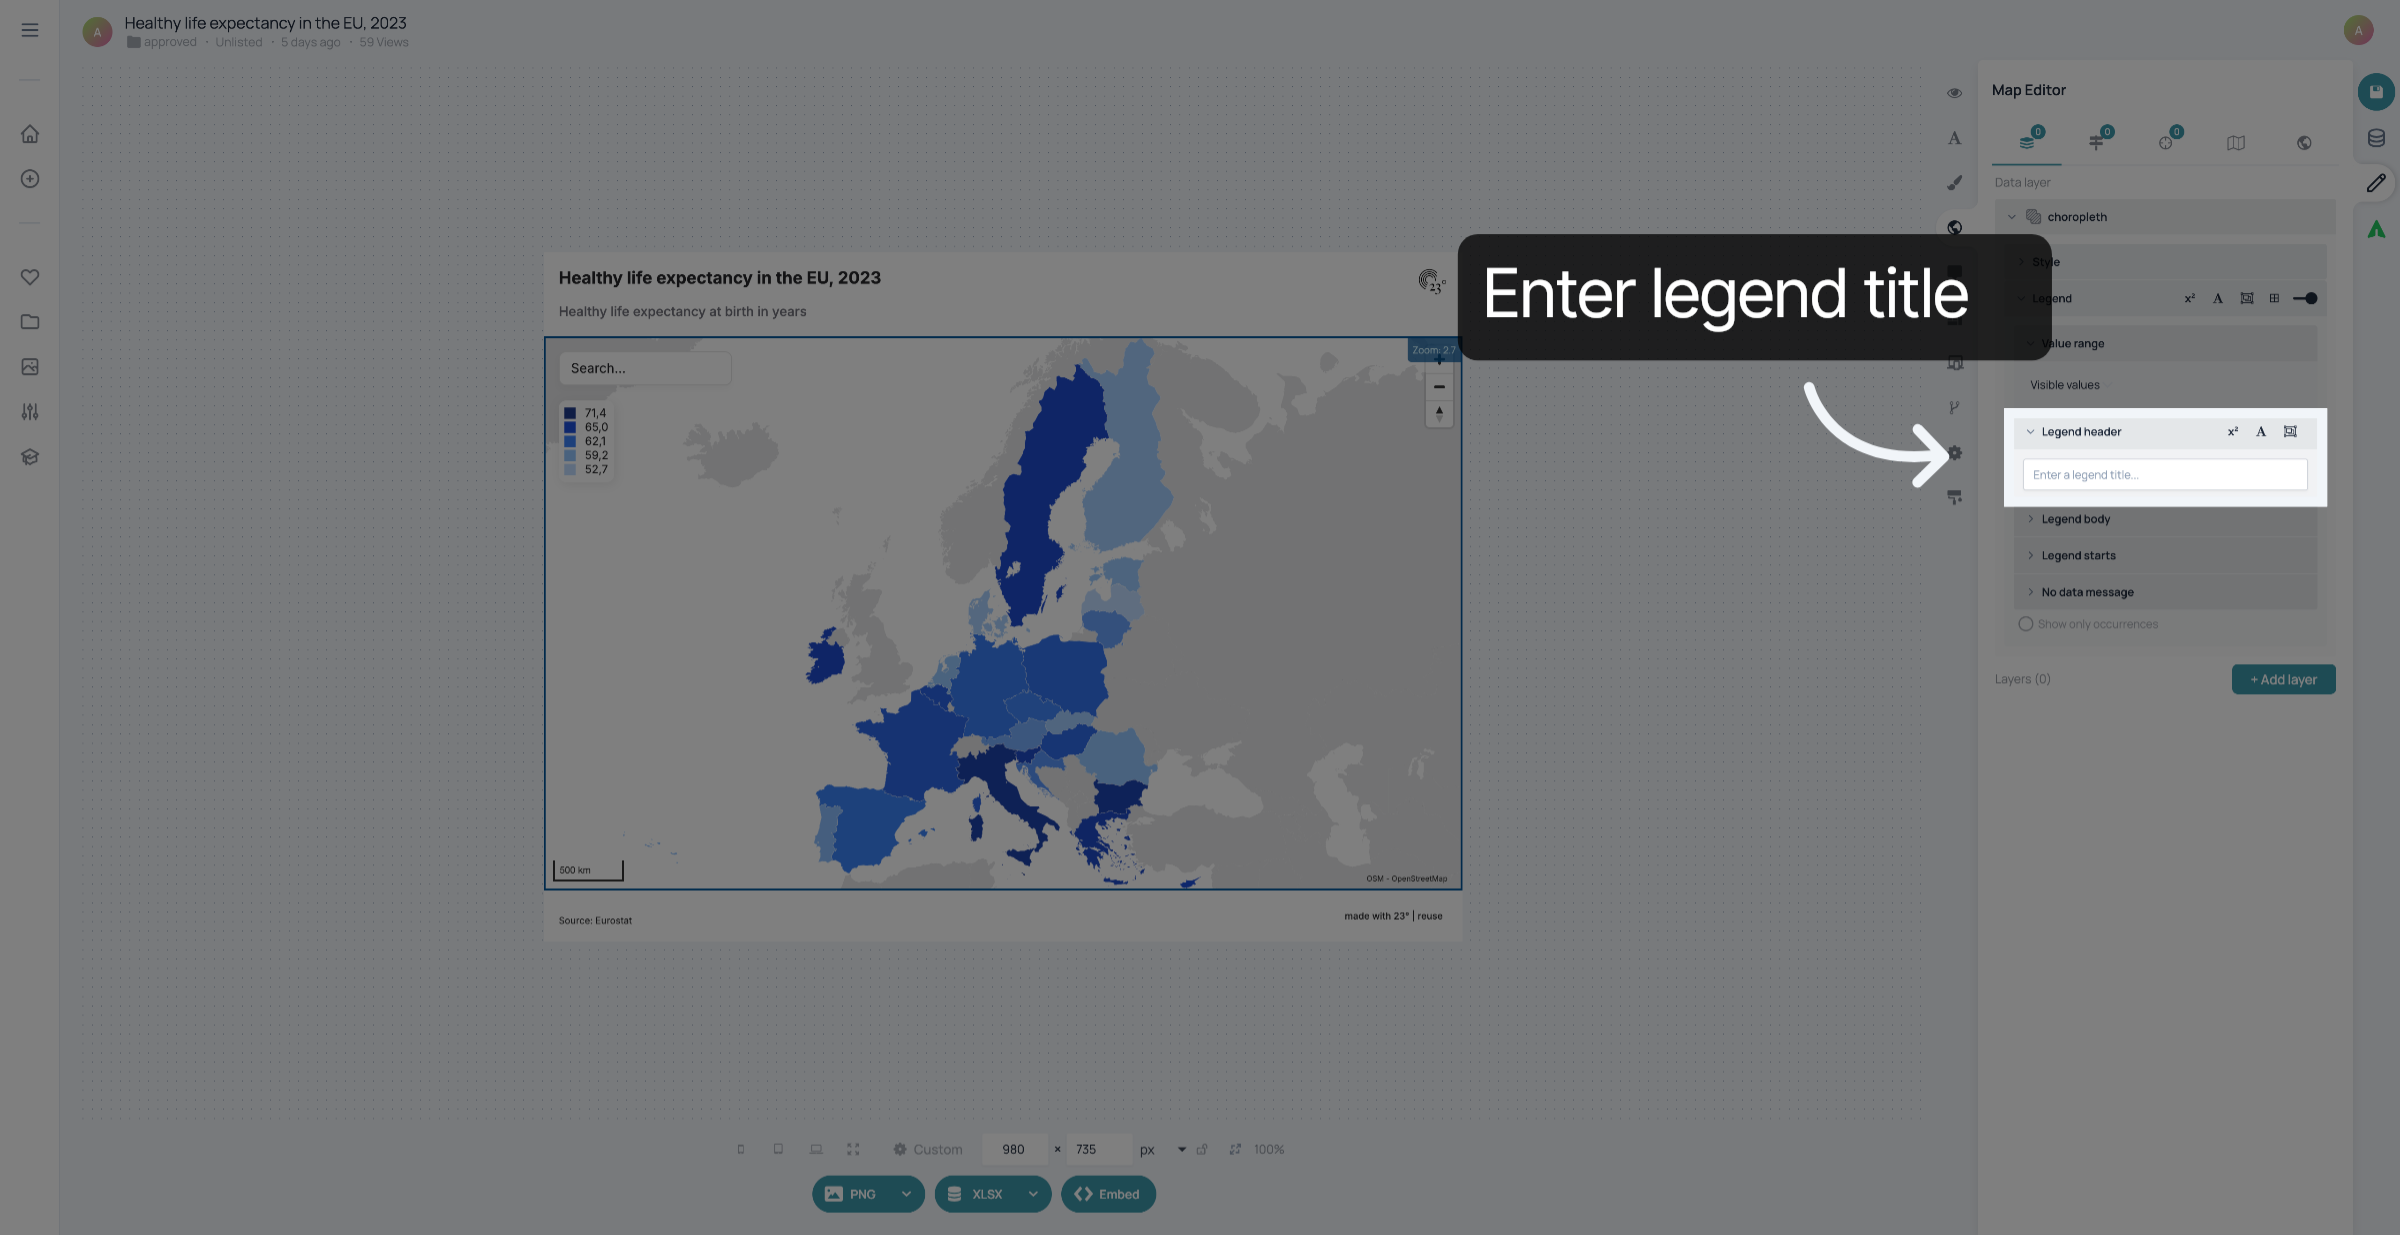
You can enter a header for your legend here.
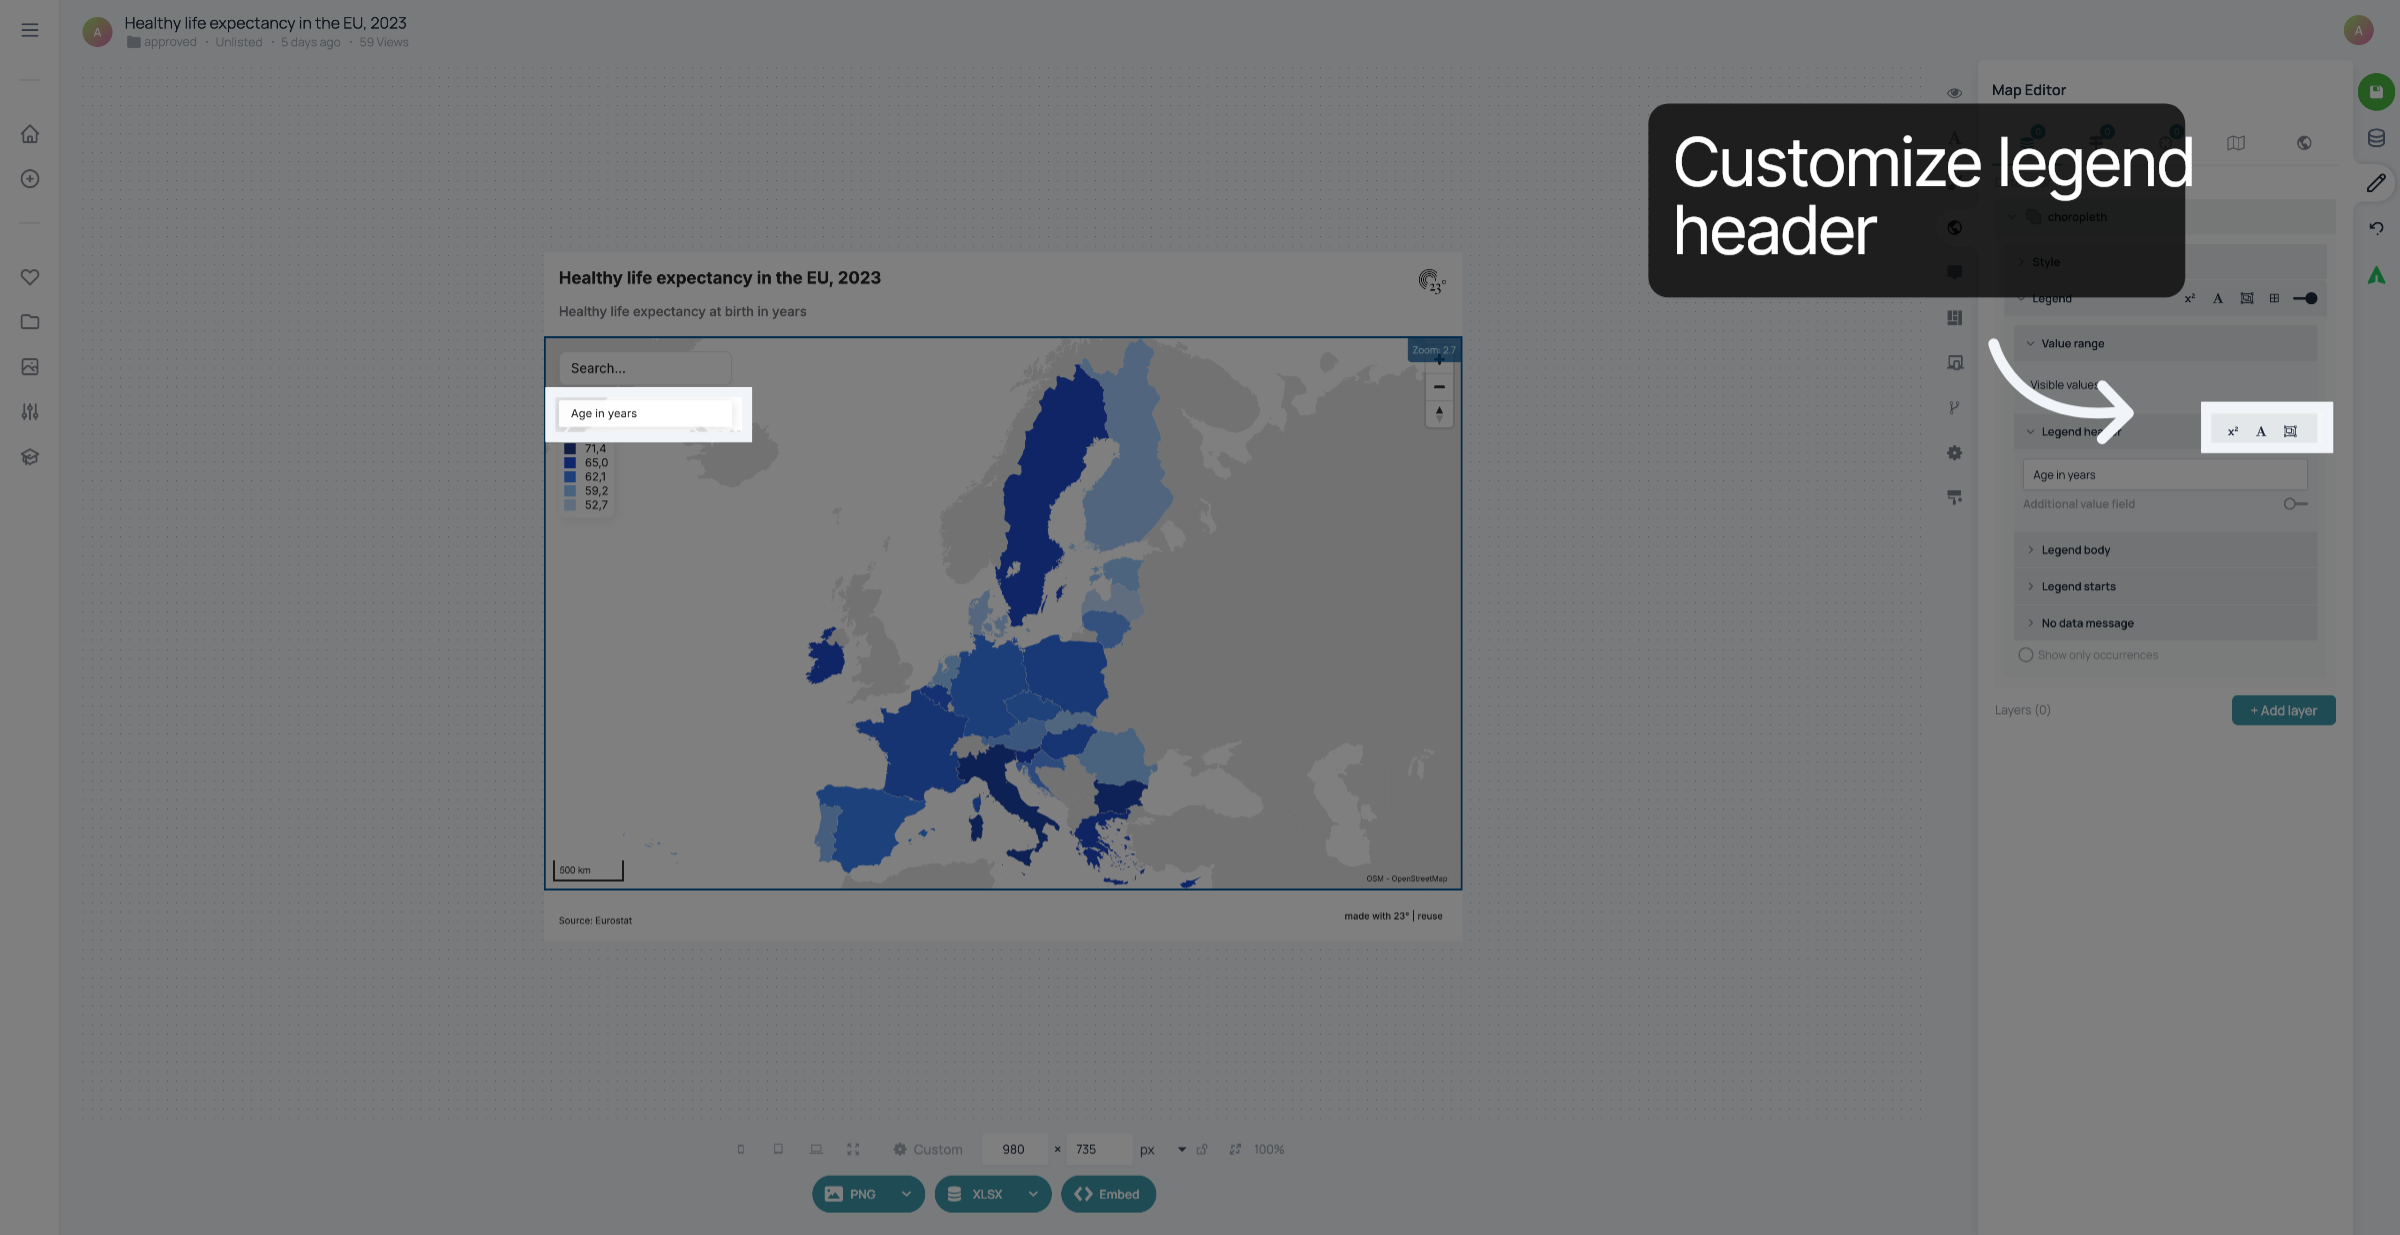
For the legend header, you have the same customizing options as for the legend. You can also edit the font and the borders here.
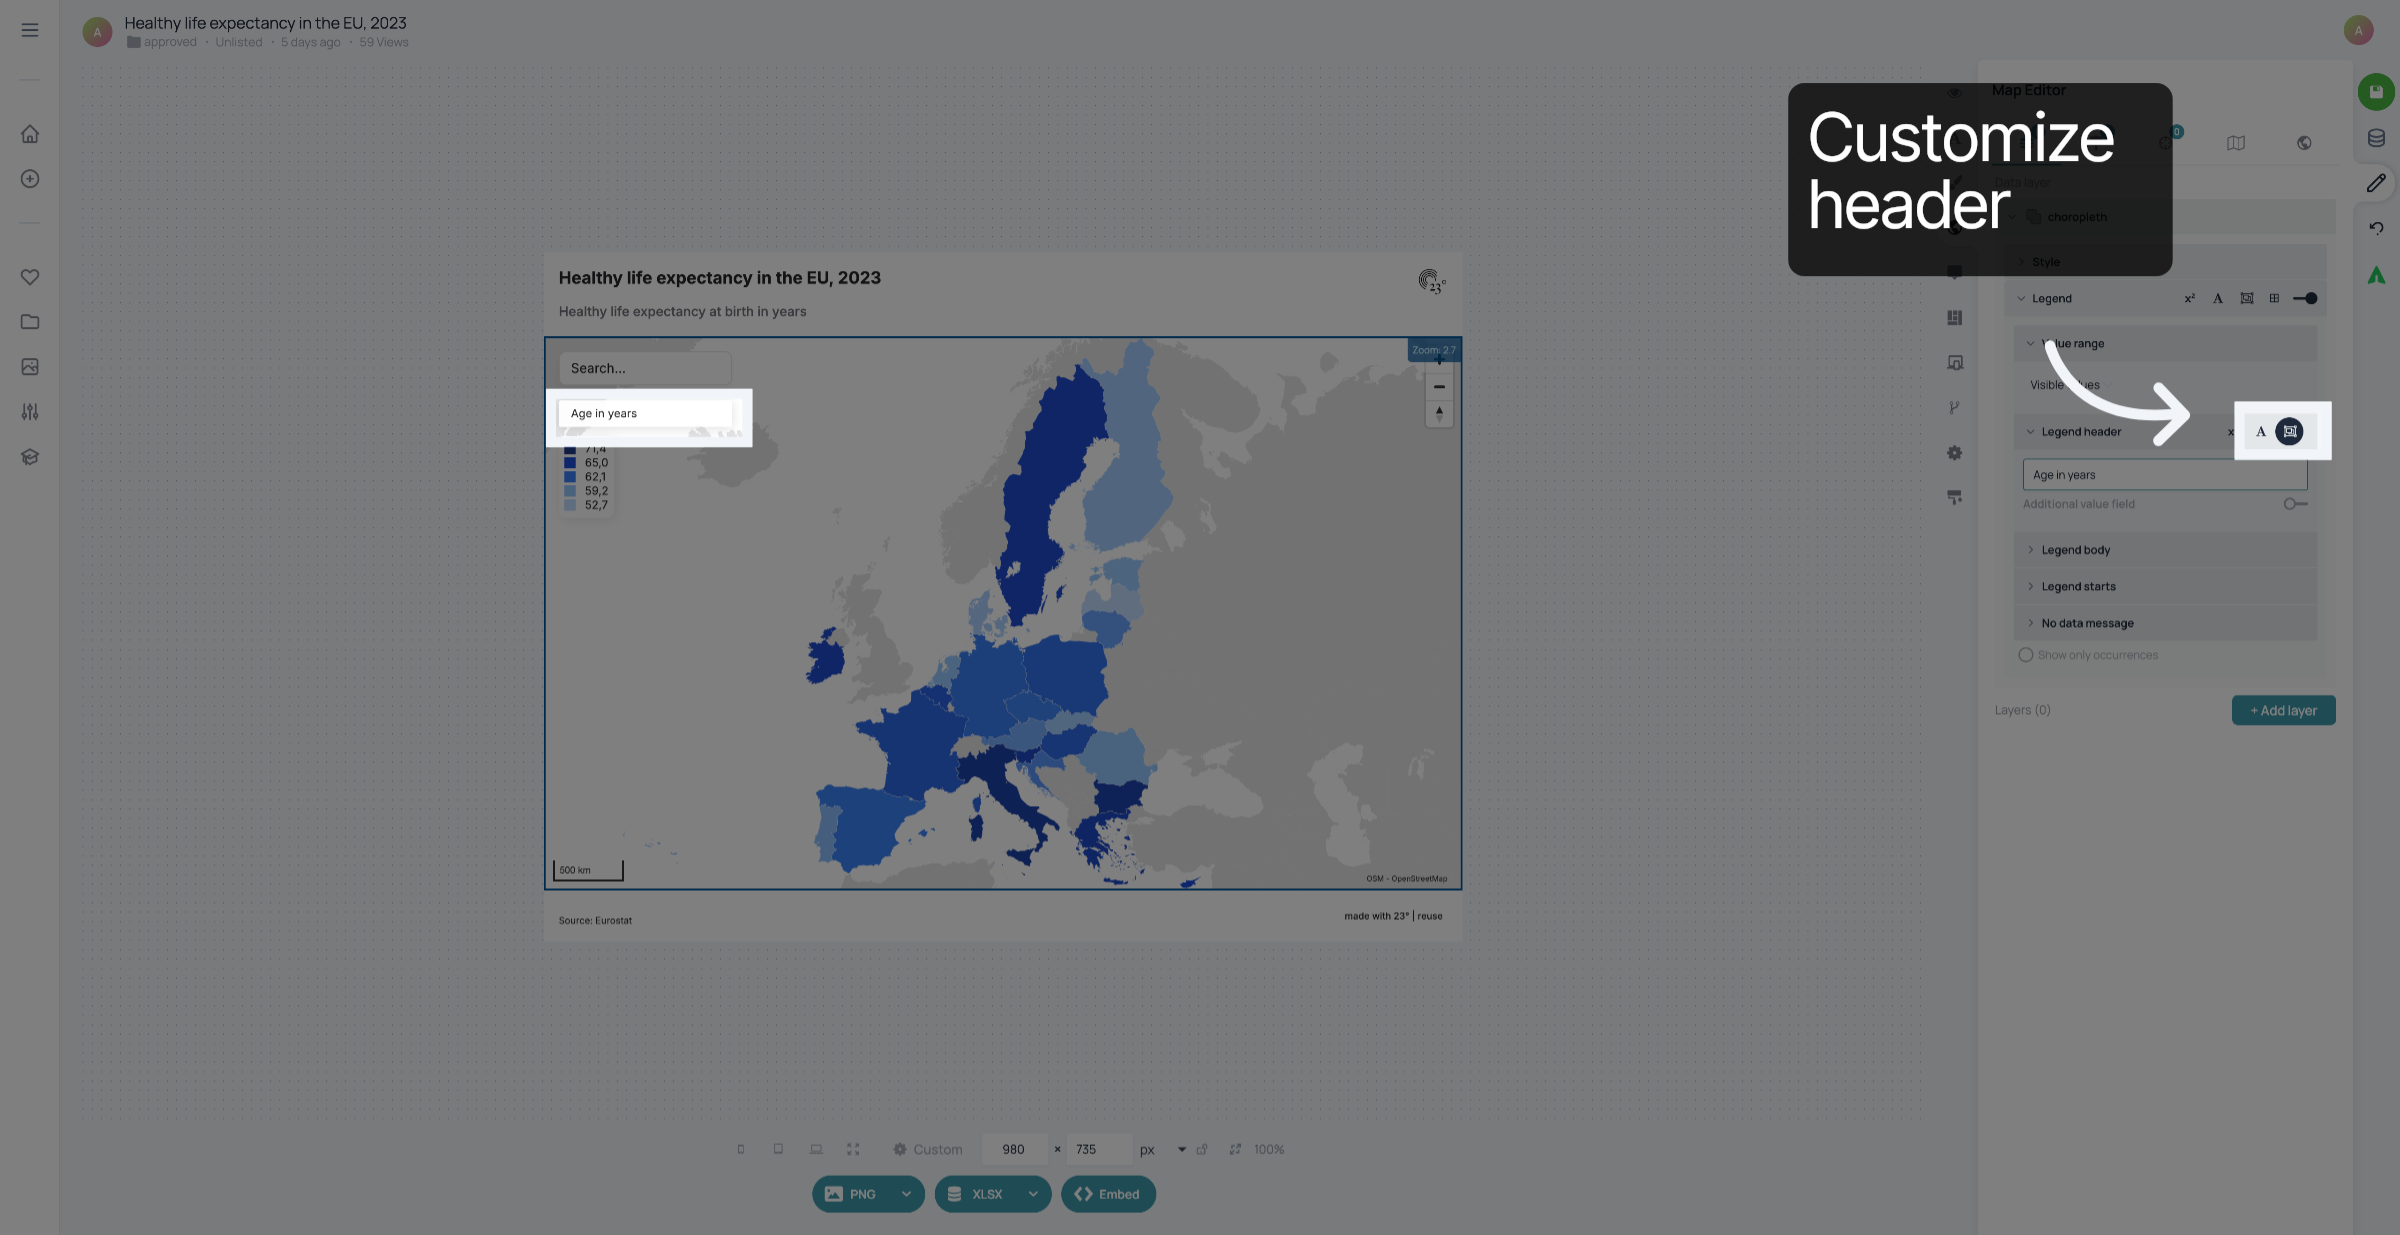
For the legend header, you have the same customizing options as for the legend. You can also edit the font and the borders here.
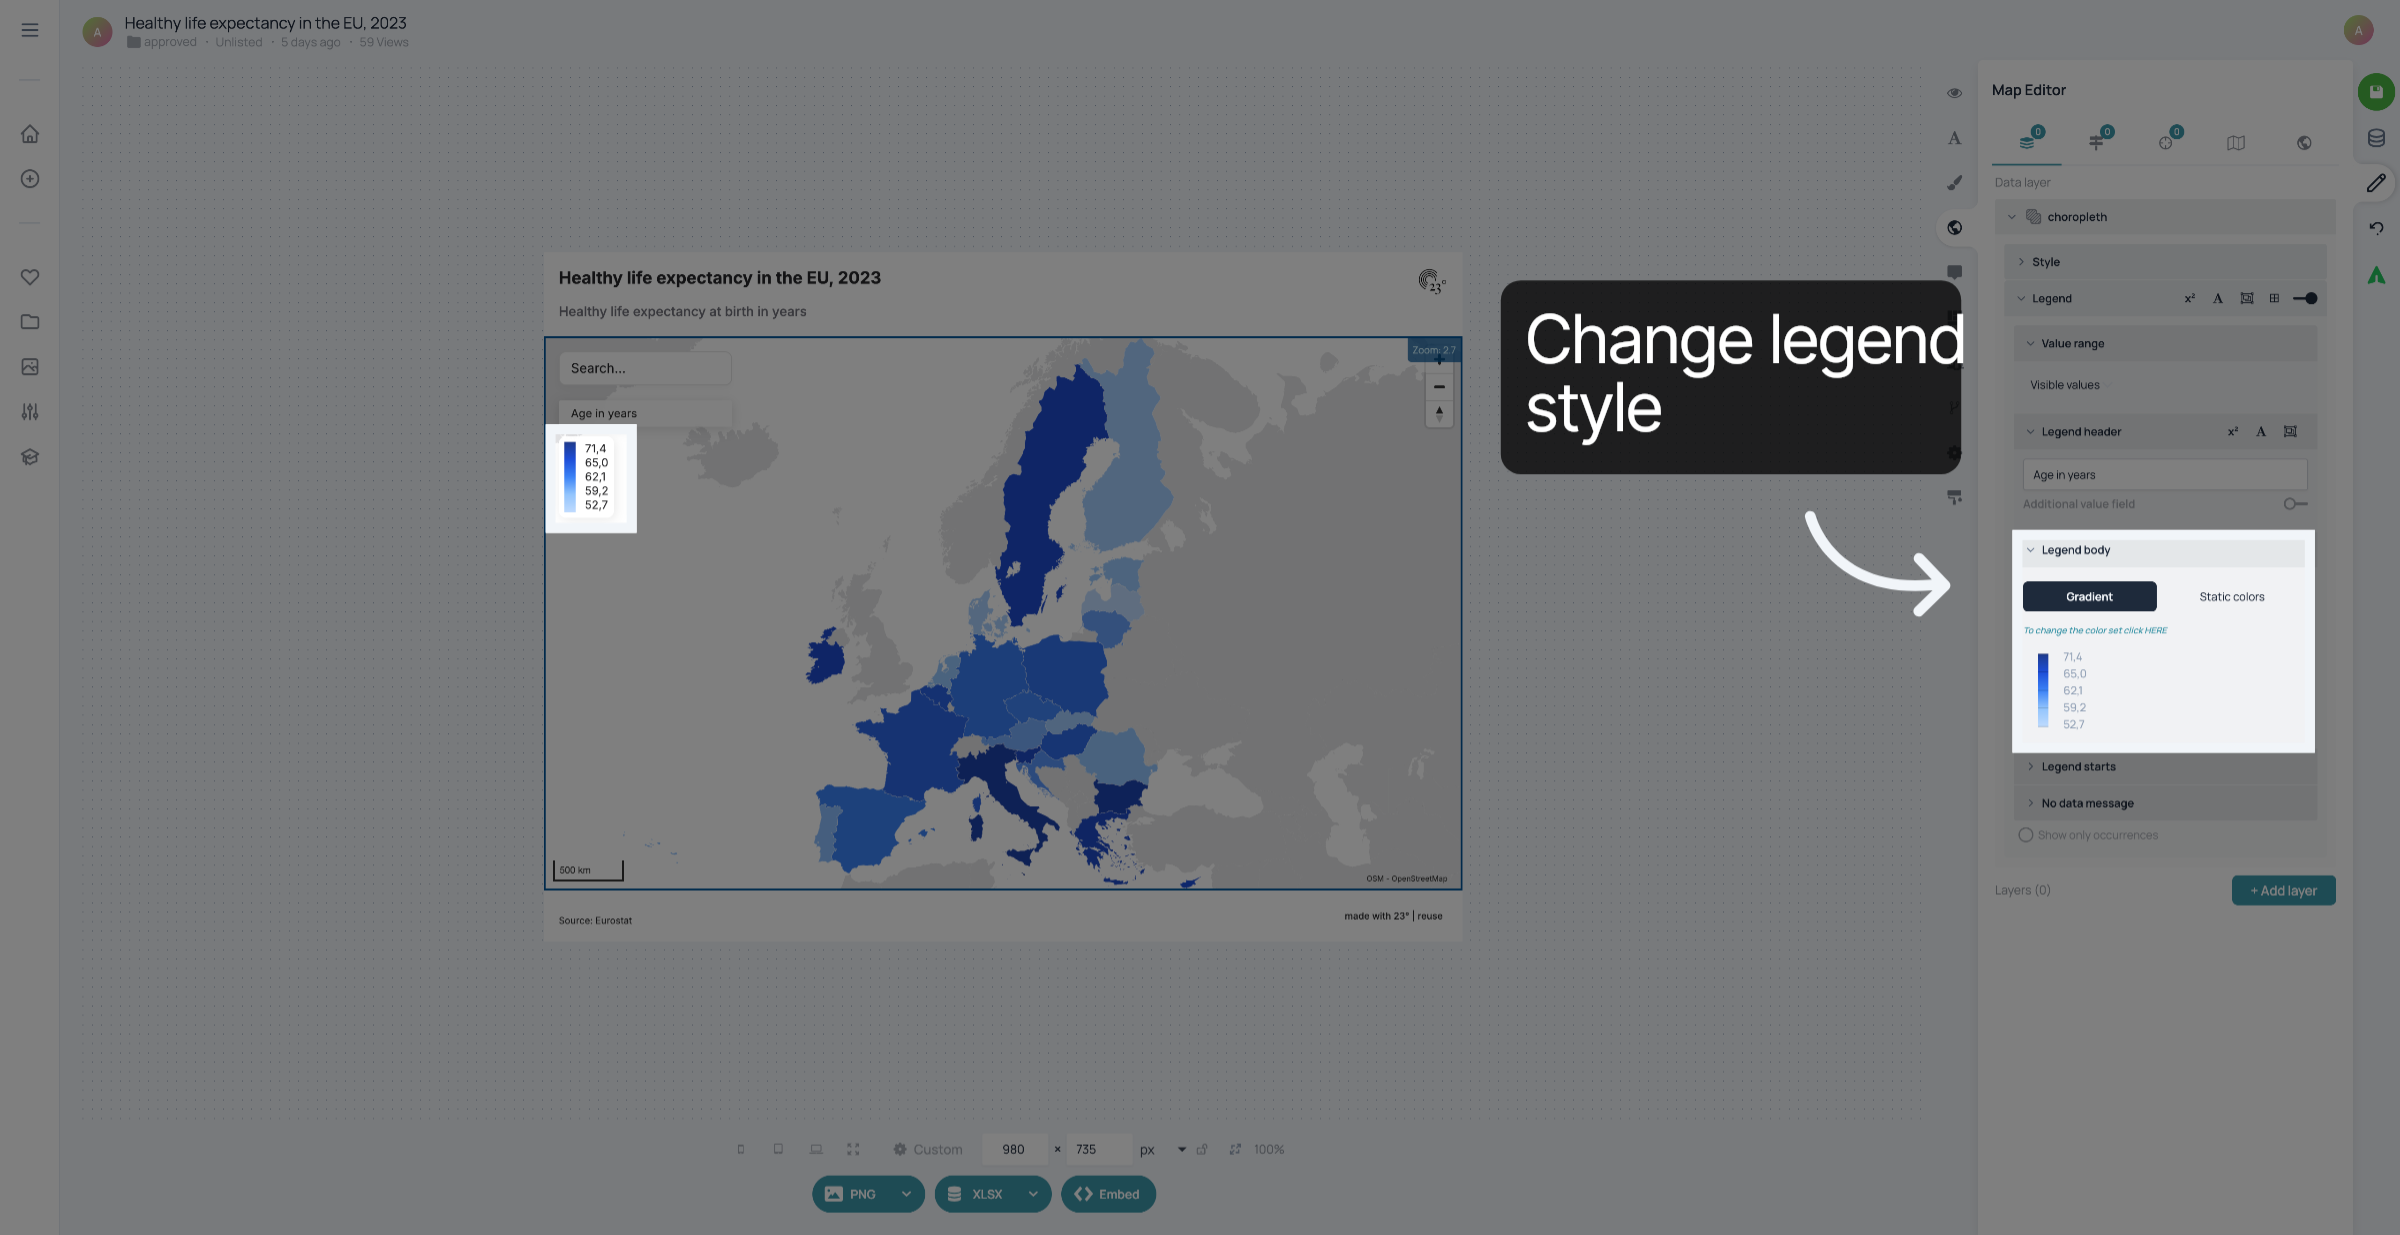
Click "Legend body" to change the style of your legend. You can either have static colours...
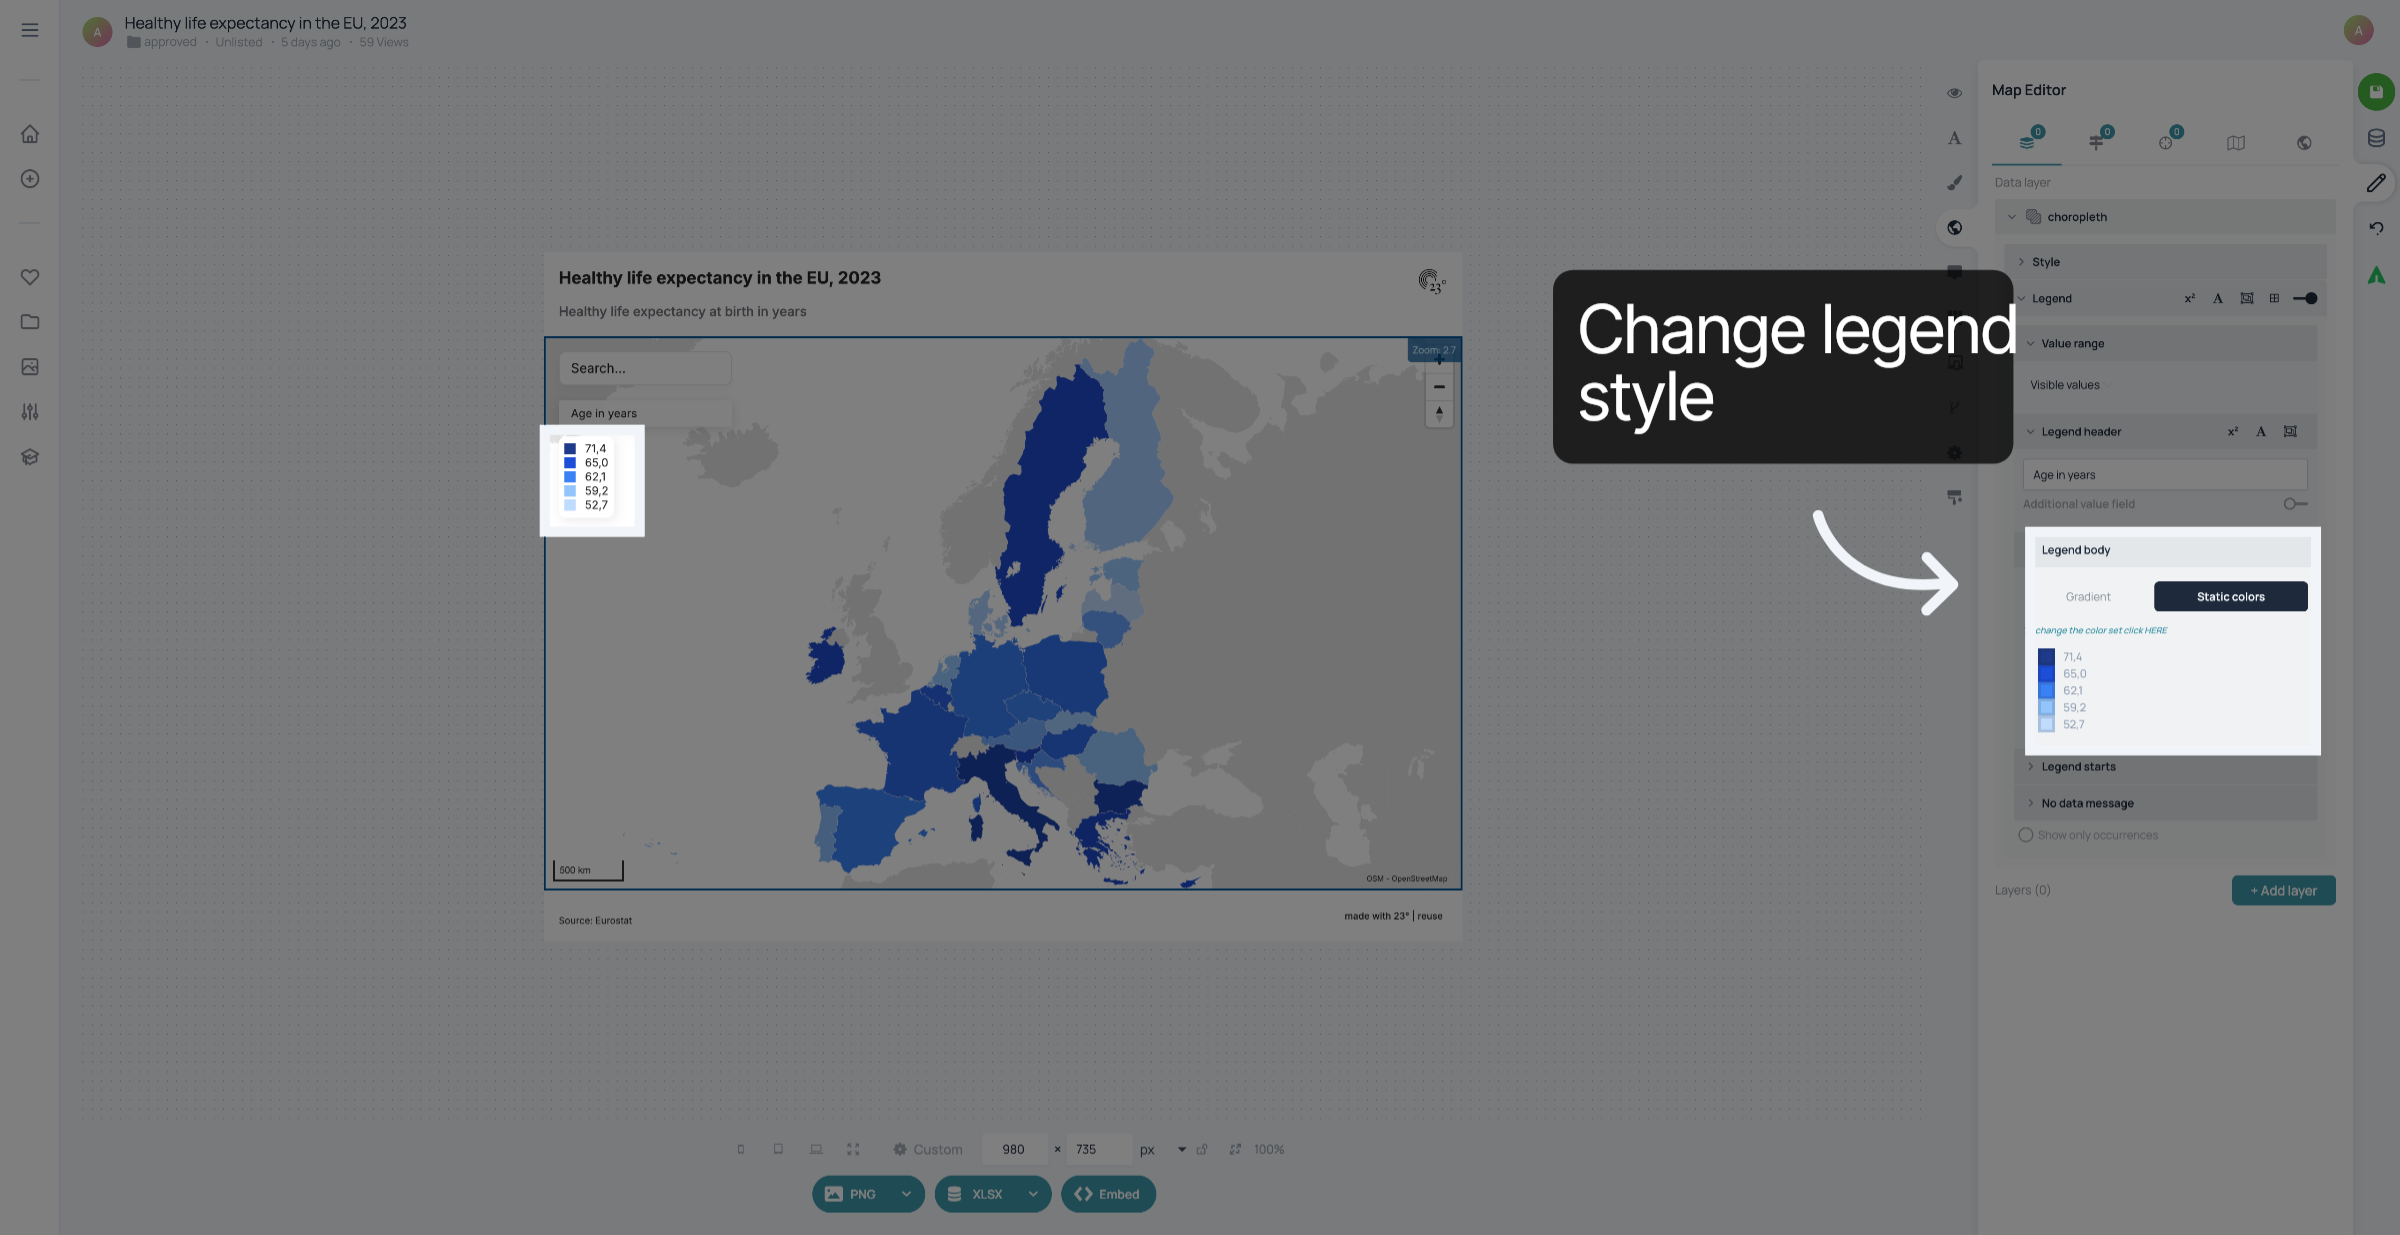
...or a gradient.
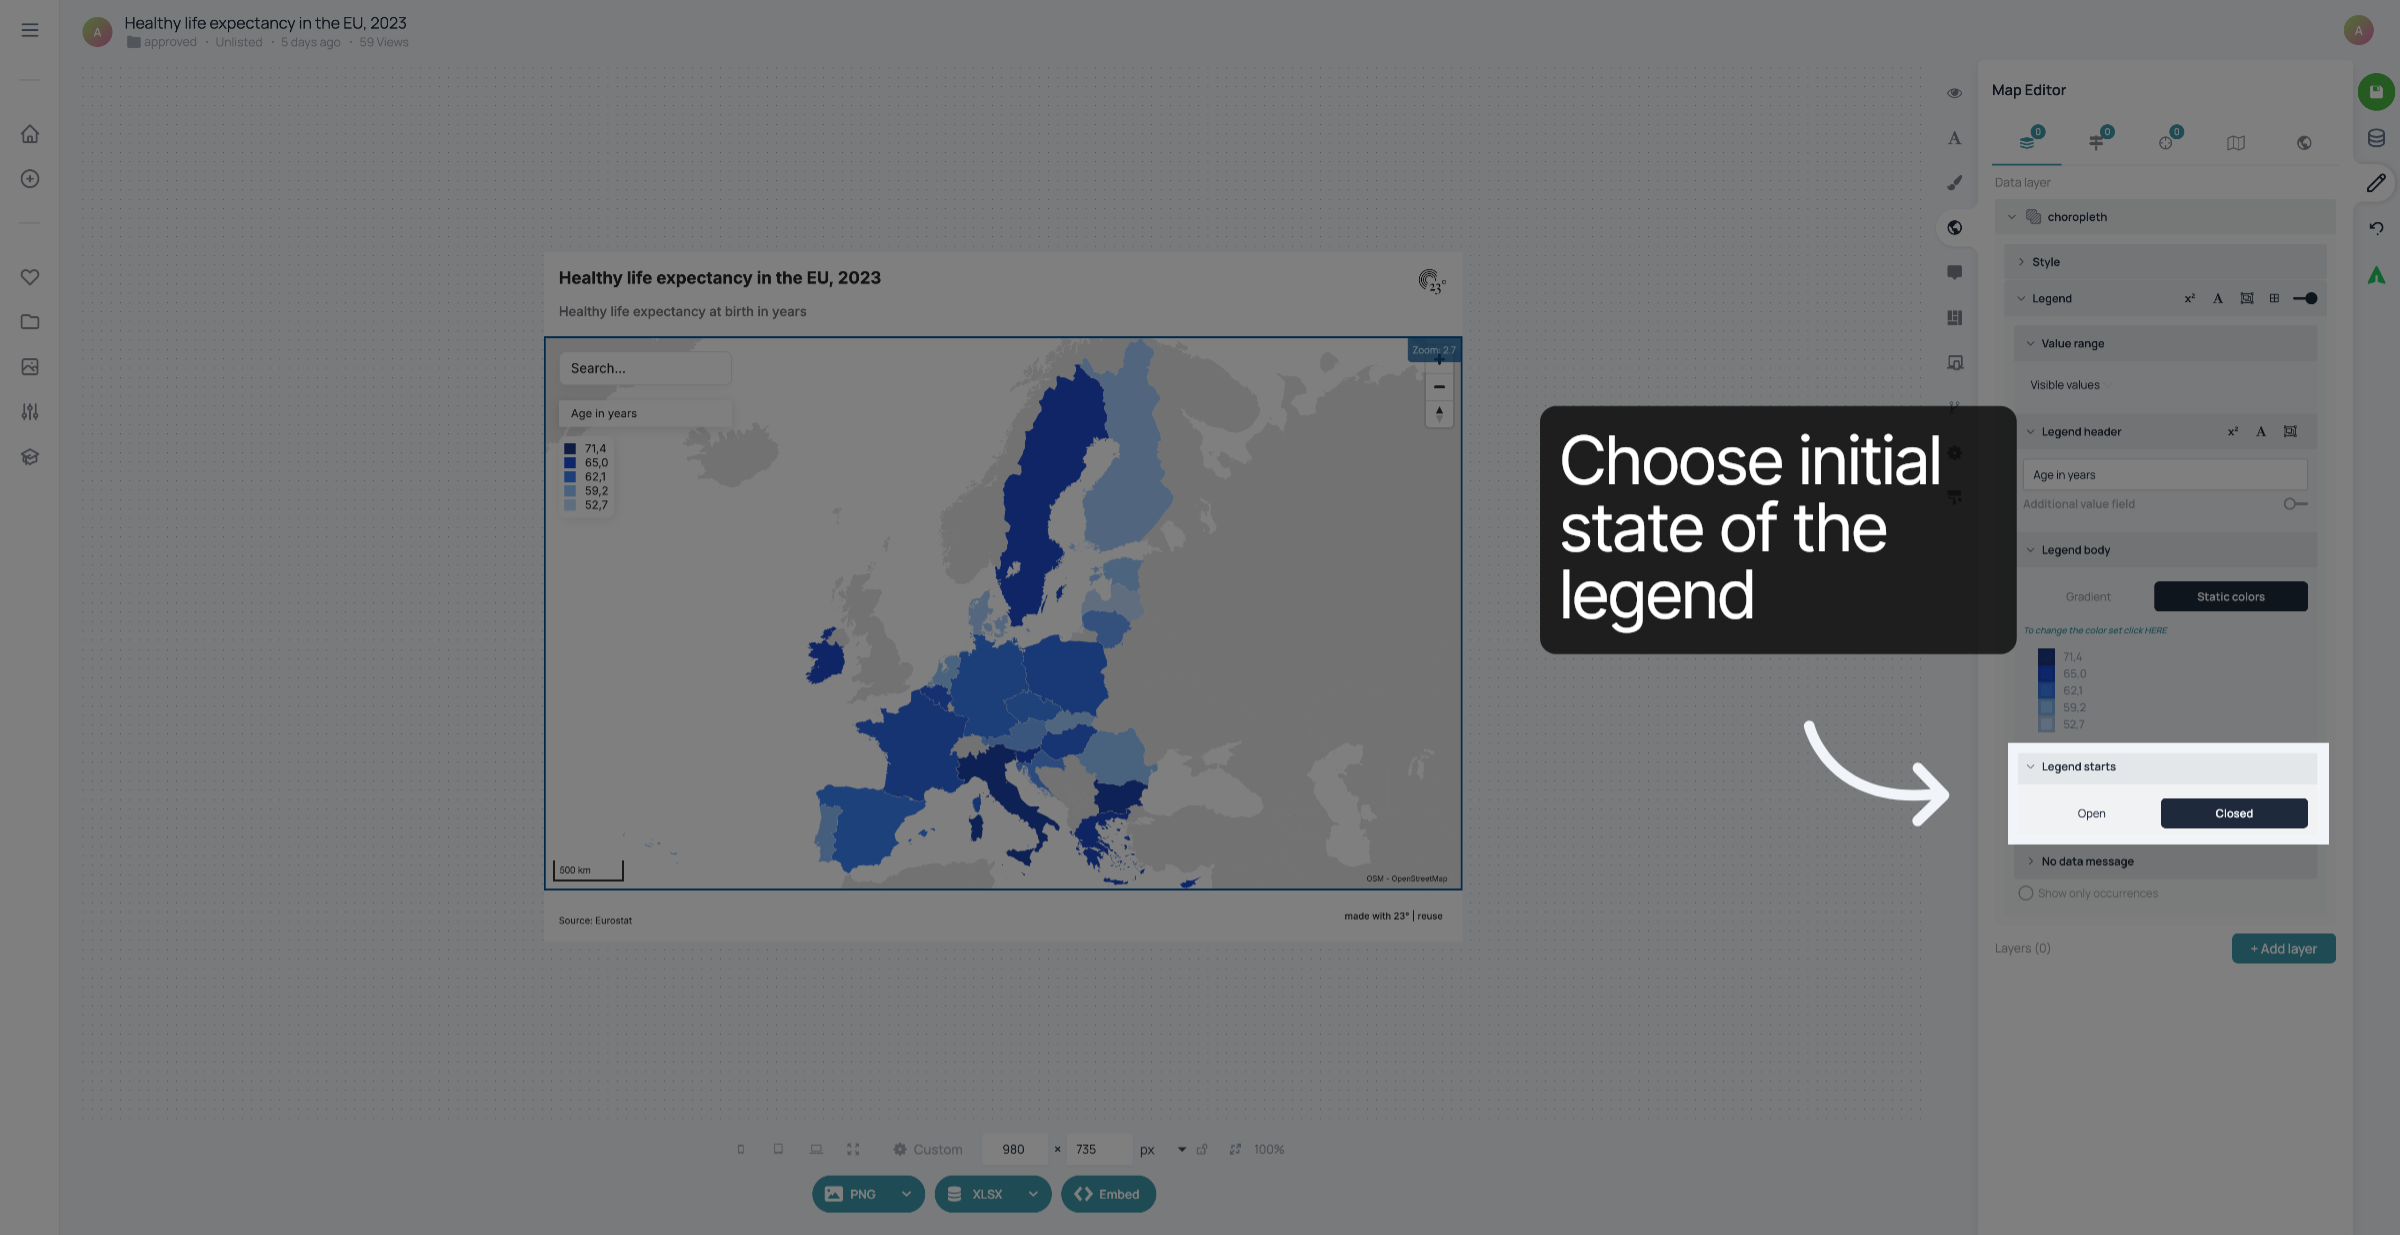
In "Legend starts", you can edit the initial display of the legend when someone opens your map. It can either be open or closed. The user can always expand or collapse the legend by clicking on it.
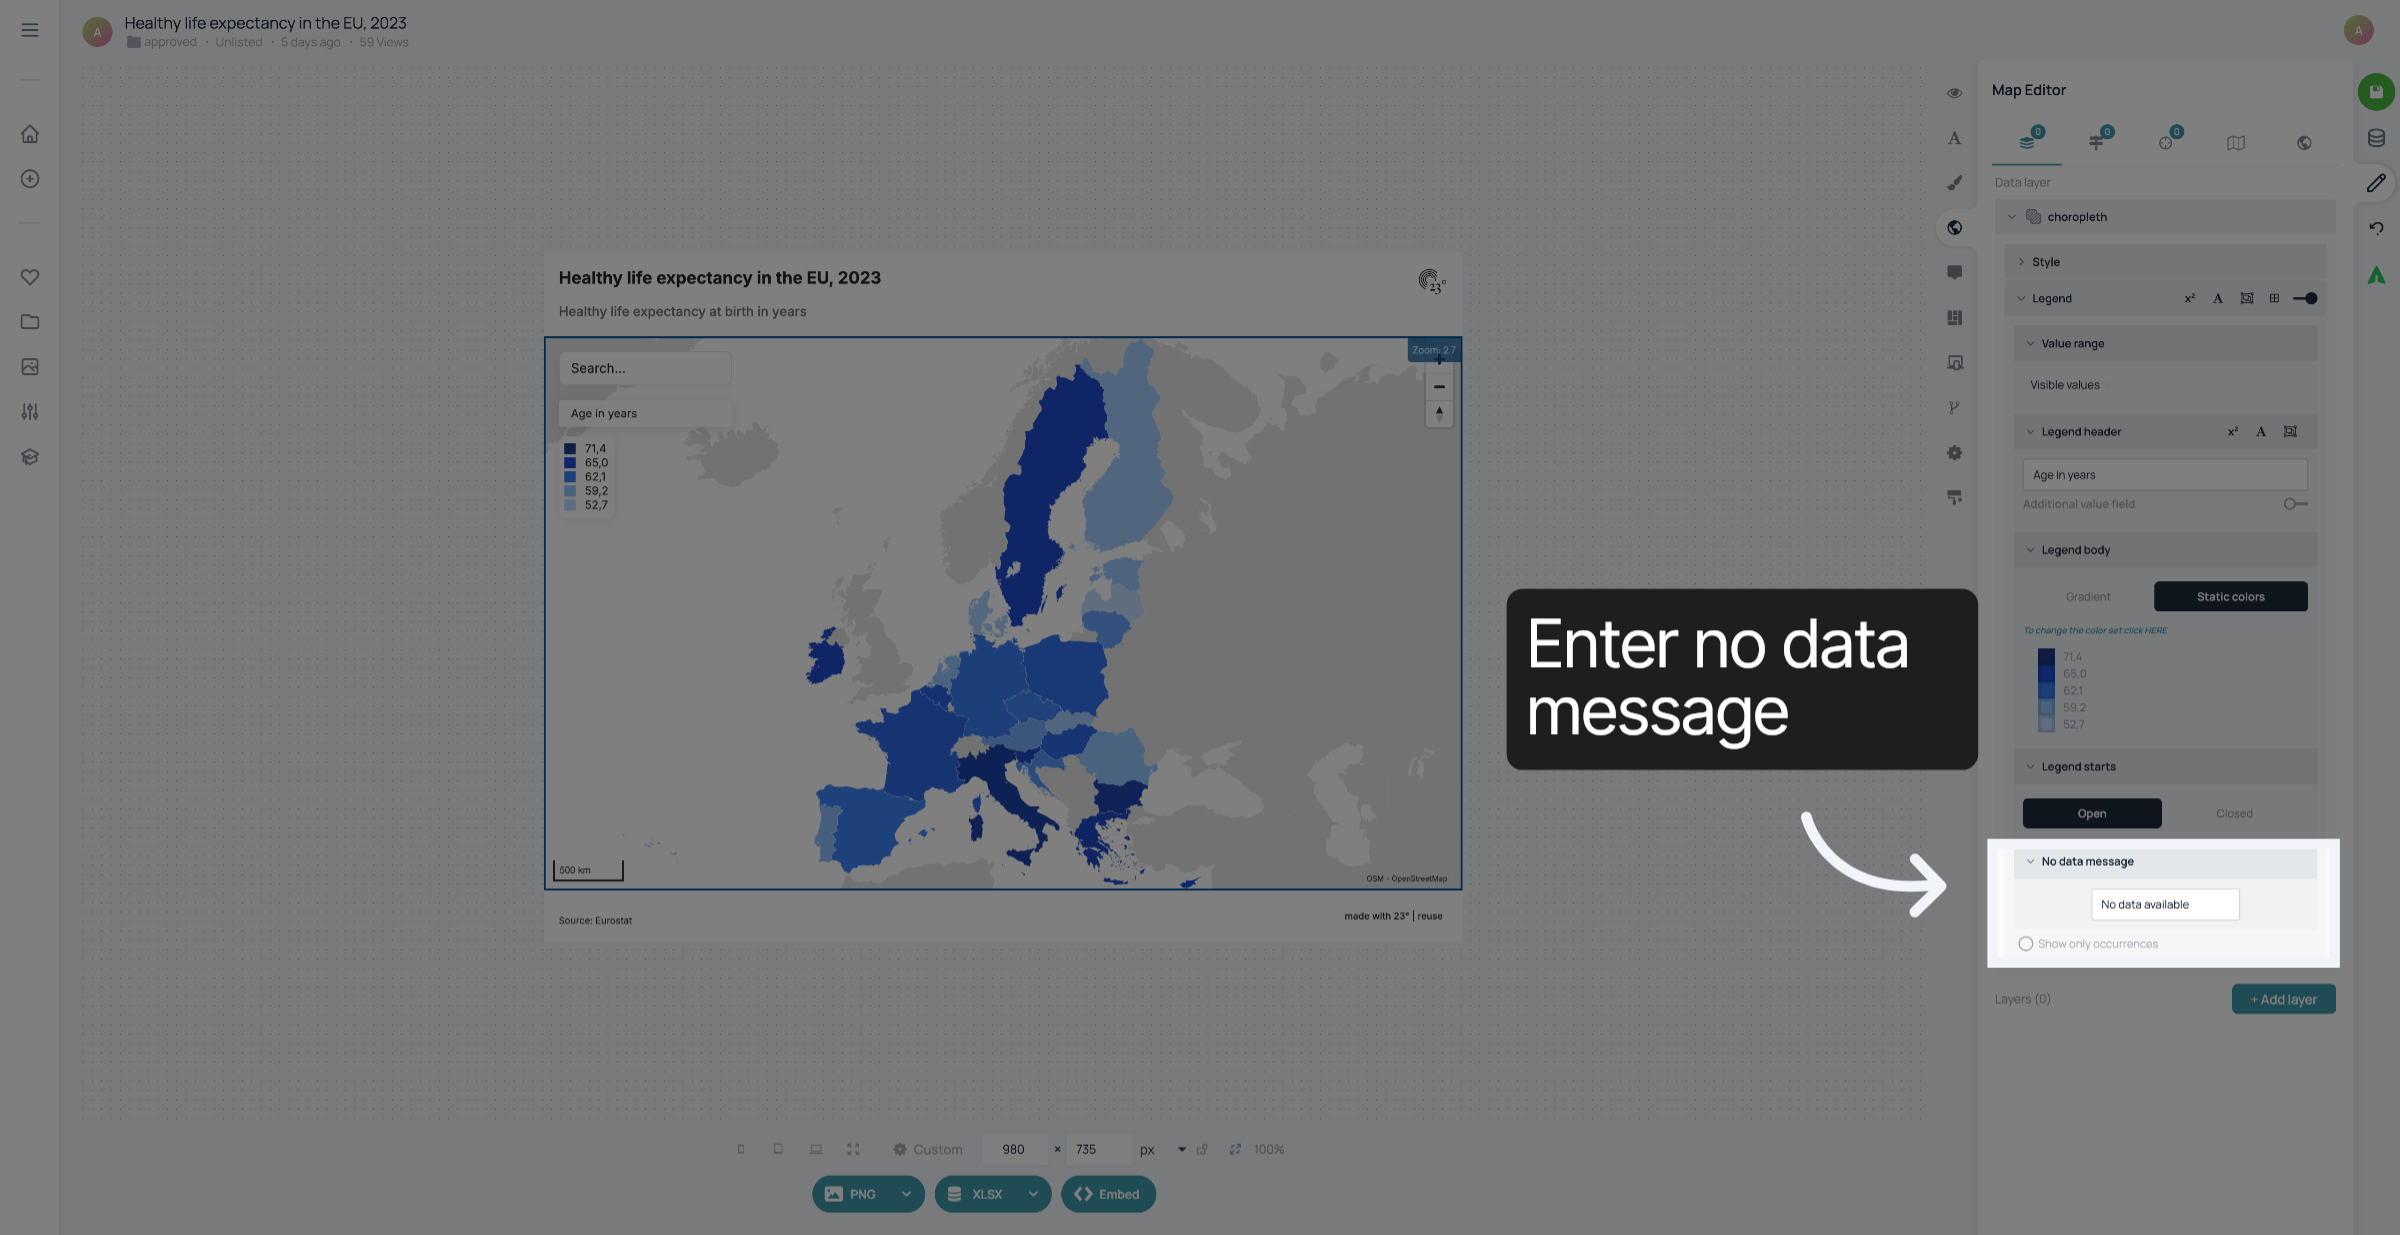
If your dataset contains a country that does not have a value, a no data message will be displaye in the legend. You can enter it here.
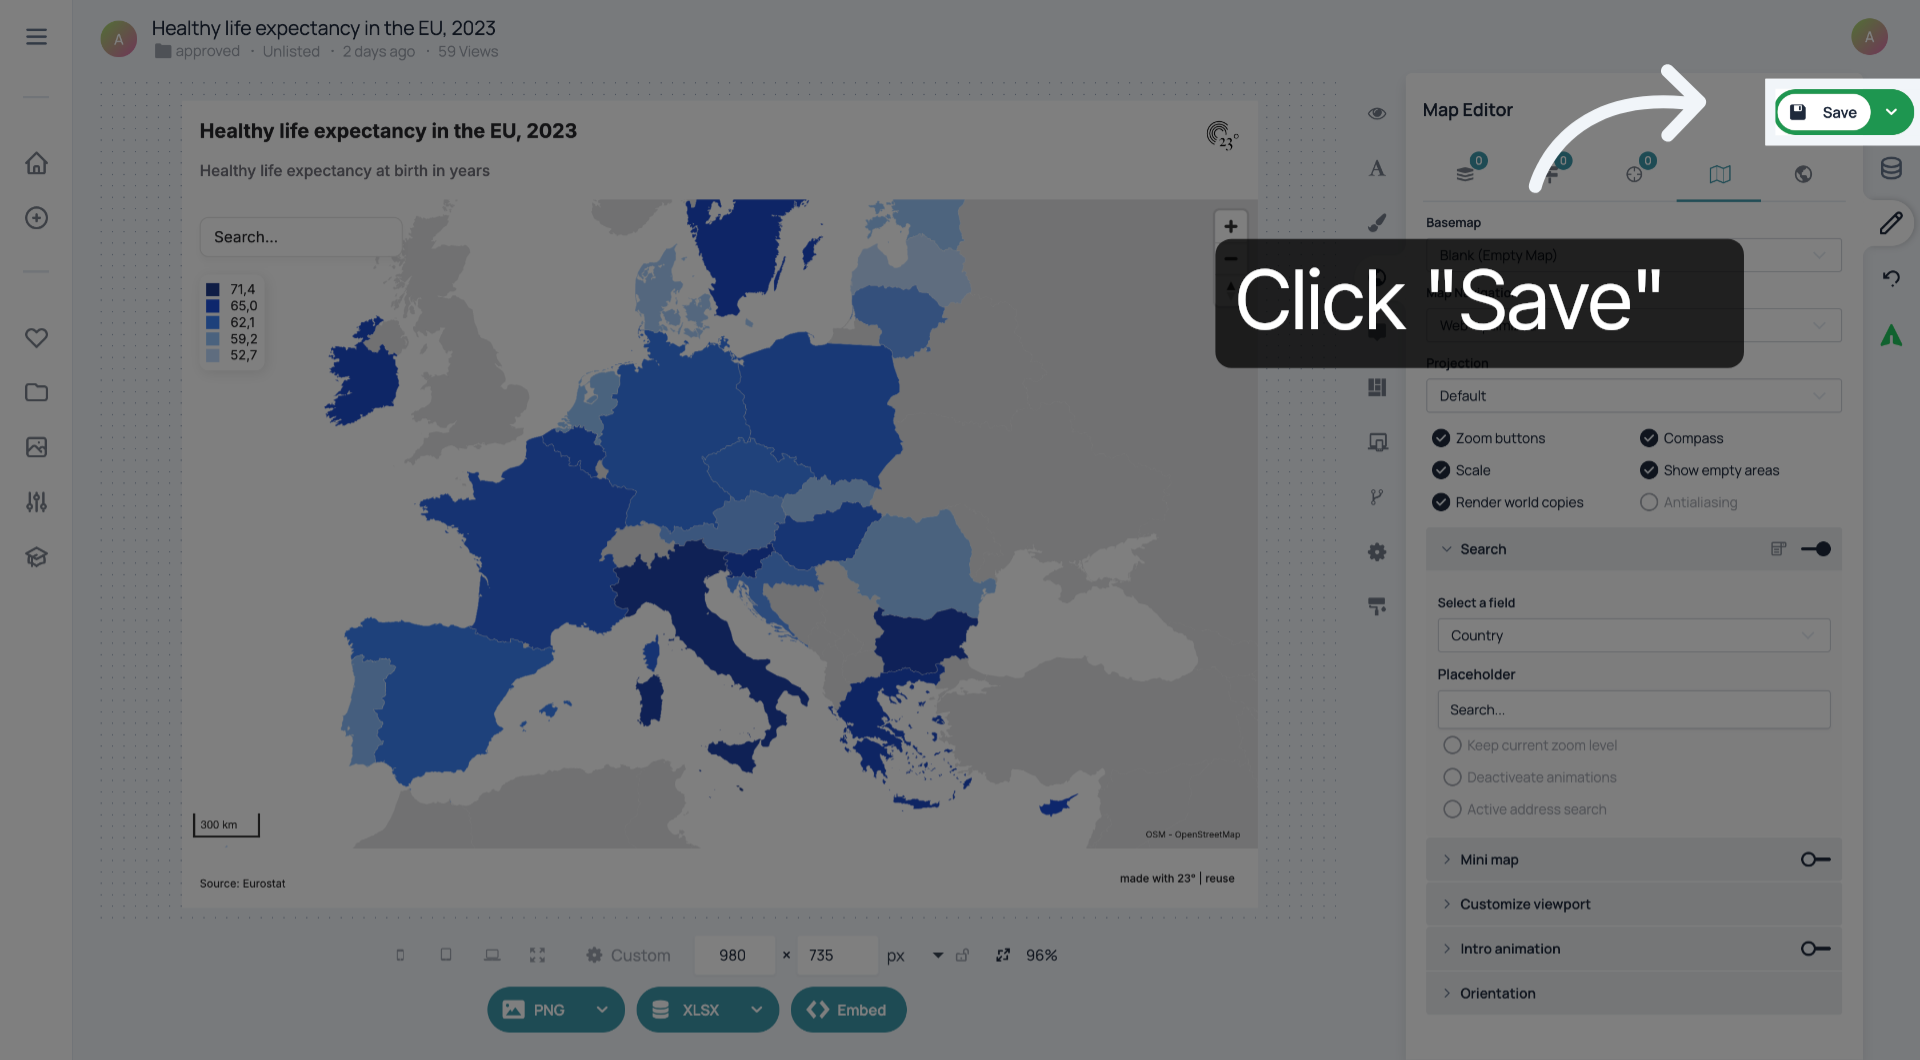
Don't forget to save your changes.
You have successfully styled the legend of your choropleth map.